


Abstract
We present new radio continuum observations of NGC 253 from the Murchison Widefield Array at frequencies between 76 and 227 MHz. We model the broadband radio spectral energy distribution for the total flux density of NGC 253 between 76 MHz and 11 GHz. The spectrum is best described as a sum of a central starburst and extended emission. The central component, corresponding to the inner 500 pc of the starburst region of the galaxy, is best modeled as an internally free–free absorbed synchrotron plasma, with a turnover frequency around 230 MHz. The extended emission component of the spectrum of NGC 253 is best described as a synchrotron emission flattening at low radio frequencies. We find that 34% of the extended emission (outside the central starburst region) at 1 GHz becomes partially absorbed at low radio frequencies. Most of this flattening occurs in the western region of the southeast halo, and may be indicative of synchrotron self-absorption of shock-reaccelerated electrons or an intrinsic low-energy cutoff of the electron distribution. Furthermore, we detect the large-scale synchrotron radio halo of NGC 253 in our radio images. At 154–231 MHz the halo displays the well known X-shaped/horn-like structure, and extends out to ∼8 kpc in the z-direction (from the major axis).
1. Introduction
Observing at low radio frequencies (≲0.5 GHz) is of particular value: low-energy and old plasma can be revealed, tracing and constraining physical conditions in galaxies. In star-forming galaxies this plasma of low surface brightness forms, e.g., extended halos associated with winds and large-scale magnetic fields, or it produces diffuse emission from galactic disks. Furthermore, measurements at low radio frequencies can help to distinguish, for instance, between thermal and nonthermal plasma, and their absorbing mechanisms, responsible for the level of observed radio emission. It is expected that the Square Kilometre Array (SKA) will unravel a large population of star-forming galaxies (e.g., Beswick et al. 2015; Jarvis et al. 2015), but before we can embark on a large-scale study of star-forming and starburst galaxies and their evolution with continuum radio surveys, we need to understand the origin of the complex radio spectral energy distributions and morphologies of these galaxies. Nearby objects are ideal laboratories for this task.
NGC 253 is the dominant galaxy in the nearby Sculptor Group, at a distance of 3.94 Mpc from the Local Group (Karachentsev et al. 2003) and velocity cz = 240 km s−1. It is an almost edge-on SBc-type galaxy (de Vaucouleurs et al. 1991) observed at an inclination of 78 5 (Pence 1980) and is considered to be a prototype of nuclear starburst galaxies (Rieke et al. 1980). Its estimated stellar mass is ∼4 × 10¹⁰ M⊙, with a prominent stellar halo of 2.5 × 10⁹ M⊙ extending up to 30 kpc above the disk (Bailin et al. 2011). As one of the closest and most prominent galaxies, NGC 253 has been extensively studied in all wavelengths, including broadband radio continuum, polarization, and H i observations (Beck et al. 1979, 1994; Klein et al. 1983; Hummel et al. 1984; Carilli et al. 1992; Ulvestad & Antonucci 1997; Lenc & Tingay 2006; Heesen et al. 2009a, 2009b, 2011; Lucero et al. 2015, among others).
Radio emission from starburst galaxies originates from two principal components: the nonthermal synchrotron emission from relativistic electrons spiralling in the interstellar magnetic field, and the thermal emission from electrons colliding with ions in the ionized interstellar medium around hot stars. The sources of the nonthermal emission are predominantly cosmic rays accelerated by supernova remnants (SNRs), which in NGC 253 ultimately create a prominent synchrotron radio halo (Carilli et al. 1992). Studies of the magnetic field of NGC 253 suggest that the disk wind model and large-scale dynamo action are shaping the vertical structure of the field, which in turn enhances the transport of cosmic rays through a collimation of strong, starburst-driven superwind (Beck et al. 1994; Pietsch et al. 2000; Strickland et al. 2002; Heesen et al. 2009a, 2009b, 2011).
The starburst region of NGC 253 is violently active; the supernova rate of the inner 300 pc of the galaxy is estimated to be between 0.14 and 2.4 yr−1, and the star formation rate is ∼5 M⊙ yr−1 (Lenc & Tingay 2006; Rampadarath et al. 2014; Bendo et al. 2015; Lucero et al. 2015). It has been suggested that up to half of the radio sources in the central starburst region are dominated by thermal emission, i.e., H ii regions characterized by a flat radio spectral index24 α ≃ 0.1 and including at least one large supercluster of stars (Ulvestad & Antonucci 1997; Keto et al. 1999). Outside the central starburst region the radio emission at gigahertz frequencies is dominated by steep-spectrum diffuse emission and SNRs, but several strong thermal sources are detected (Ulvestad 2000). Based on integrated radio continuum spectra, Niklas et al. (1997) estimated 10% of the flux density of NGC 253 at 1 GHz to be of thermal origin, increasing to 35% at 10 GHz.
At low radio frequencies both of these principal components become pronounced. Synchrotron emission has a steep spectrum, becoming dominant at sub-gigahertz frequencies, due to the population of old, low-energy electrons. However, such emission may also be subject to self-absorption in the case of compact objects. Thermal emission also becomes increasingly more absorbed with decreasing frequency. The free–free absorption (FFA) in the central starburst of NGC 253 has previously been measured (Carilli 1996; Tingay 2004).
Here, we present extensive imaging of NGC 253 at low radio frequencies (<230 MHz) obtained with the Murchison Widefield Array (MWA; Bowman et al. 2013; Tingay et al. 2013). Our images are some of the deepest yet at these frequencies, and at low angular resolution they are especially sensitive to large-scale diffuse structure, allowing us to investigate the extent and frequency dependence of the radio halo. The paper is structured as follows. Our radio data and methods, including assumed models of radio spectra and model fitting, are described in Sections 2 and 3 respectively. Results are presented in Section 4. The synchrotron radio halo of NGC 253 is discussed in Section 5.1. We discuss low-frequency radio emission from NGC 253, its radio spectral energy distribution, and radio spectral maps in Section 5.2. Conclusions are given in Section 6.
2. Observations and Data Reduction
We use radio continuum data from the Galactic and Extragalactic All-Sky MWA Survey (GLEAM; Wayth et al. 2015) and the MWA Epoch of Reionization experiment (MWA/EoR; Bowman et al. 2013; Pober et al. 2016). The GLEAM survey provides unprecedented spectral coverage between 72 and 231 MHz, while the MWA/EoR image at 169 MHz is almost twice as deep as the most sensitive GLEAM image at 200 MHz (rms noise 4.1 mJy beam−1 and 7.3 mJy beam−1 respectively). In addition, the data have been observed and processed independently, providing a verification of our flux density calibration.
2.1. The Galactic and Extragalactic All-Sky MWA Survey (GLEAM)
The GLEAM survey observed the entire radio sky south of declination +30° at an angular resolution of approximately 1.7 arcmin (227 MHz) to 5 arcmin (76 MHz). At 154 MHz the GLEAM survey is sensitive to structures up to 10° in angular scale, and has an instantaneous field of view of 25 × 25 deg2. The observations were made in a meridian drift scan mode covering frequencies between 72 and 231 MHz with bandwidths of 7.68 MHz grouped in five bands each 30.72 MHz wide. These bands, centered on 87.7, 118.4, 154.2, 185.0, and 215.7 MHz (hereafter 88, 118, 154, 185, and 216 MHz), were observed sequentially as 112 s snapshots; each frequency was observed every 10 minutes. During a night typically 8–10 hr in hour angle were observed. Frequencies between 134 and 137 MHz were avoided because of satellite interference. For more details on the survey parameters and strategy see Wayth et al. (2015).
Here we use GLEAM data from the first year of observing (Data Release 1 from 2013 August–2014 June; Hurley-Walker et al. 2017). The sky area covering NGC 253 was observed on 2013 August 10 and 2013 November 25. The full data reduction process is described in detail in Hurley-Walker et al. (2017); here we summarize only the main calibration and imaging steps.
The correlated data were first preprocessed with the cotter pipeline, which performs flagging of data affected by radio-frequency interference (RFI) and averaging of the data to 1 s time and 40 kHz frequency resolution (Offringa et al. 2010, 2015). Standard calibration (phase and amplitude bandpass calibration) was done with CASA (Common Astronomy Software Applications package; McMullin et al. 2007). Imaging and self-calibration were then performed using WSClean imager (Offringa et al. 2014), which corrects for wide-field w-term effects. Images of 7.68 MHz bandwidth at 20 frequencies distributed continuously between 72 and 231 MHz (avoiding 134–137 MHz) and using a robust weighting r = −1.0 (Briggs 1995) were then created. Deconvolution has been performed at this stage, and details are provided in Hurley-Walker et al. (2017).
The primary beam correction of our GLEAM observations was done with the model of Sutinjo et al. (2015) down to the 10% level of the beam response. An additional calibration stage was necessary to correct for residual declination dependence of the flux density scale in the final mosaics arising from the limited accuracy of the adopted primary beam model. This was done by comparing flux density measurements of all unresolved sources extracted from GLEAM images above 8σ rms noise level to their radio spectra as predicted by three catalogs: VLA Low-Frequency Sky Survey redux (VLSSr; Lane et al. 2014), Molongo Reference Catalogue (MRC; Large et al. 1981, 1991), and NRAO VLA Sky Survey (NVSS; Condon et al. 1998). The absolute flux density scale of the GLEAM images is accurate to 8%, which is included in the quoted uncertainties of the measurements (for details see Hurley-Walker et al. 2017).
Images for each of five central frequencies centered on frequencies of 88, 118, 154, 185, and 216 MHz and of bandwidth 30.72 MHz were made. The images at the two highest frequencies are further combined to create a "deep" image at 200 MHz with a bandwidth of 61.4 MHz. We also use the 7.68 MHz images for construction of the high-resolution radio spectrum of NGC 253. The final synthesized beam sizes, and rms and background noise levels in the deep 200 MHz image are 2.22 × 2.12 arcmin2, position angle (PA) = −78°, 11 mJy beam−1, and 7.3 mJy beam−1 respectively, and their range between the lowest and highest GLEAM frequencies is listed in Table 1.
Table 1. Range of Angular Resolution and Noise Values of the GLEAM Data
| ν | Synthesized Beam | rms Noise | Background | |
|---|---|---|---|---|
| (MHz) | bmaj × bmin | PA | (mJy beam−1) | Noise |
| (arcmin2) | (deg) | (mJy beam−1) | ||
| 76 | 5.03 × 4.72 | −18.8 | 107 | −44 |
| 227 | 1.73 × 1.67 | −26.0 | 12.8 | −3.3 |
Download table as: ASCIITypeset image
2.2. MWA Epoch of Reionization (EoR) Data
The observed MWA/EoR field that contains the Sculptor Group (EoR0 field) is centered on R.A. = 0h, decl. = −27°, and was observed for a total of 30 hr between 2013 August and October in a combination of a tracking mode and a drifting mode. In this hybrid mode the telescope tracks a set of discrete pointing centers through which the field of interest is drifting. The observations cover frequencies between 138.9 and 197.7 MHz observed as two bands (low and high), each with an instantaneous bandwidth of Δν = 30.72 MHz.
The correlated MWA/EoR0 data were preprocessed with the cotter pipeline (Offringa et al. 2015) and averaged to 4 s time and 40 kHz frequency resolution. Calibration of the data was performed as a direction-independent self-calibration using the mitchcal tool (Mitchell et al. 2008) and was based on a bootstrapped sky model. The initial sky model was generated from the MWA Commissioning Survey (Hurley-Walker et al. 2014), the MRC catalog, and the Sydney University Molonglo Sky Survey (SUMSS; Mauch et al. 2003). Imaging was performed with the WSClean software that corrects for the nonzero w-term effects. During the imaging process 2500 sources were peeled, and the images were created with a uniform weighting. The primary beam, and so the flux density scale, was corrected by applying the model of Sutinjo et al. (2015). As shown by Hurley-Walker et al. (2014), this model is accurate to 10%, hence we add this error in quadrature to the quoted uncertainties of our measurements.
The final image used in this paper is centered at 169.6 MHz (hereafter 169 MHz) with a total bandwidth of Δν = 58.8 MHz, synthesized beam size 2.3 × 2.3 arcmin2, and rms noise 4.1 mJy beam−1. The calibration and imaging process of the EoR0 data is presented and discussed in detail in Offringa et al. (2016).
2.3. Other Low-frequency Radio Surveys
There are two additional all-sky low-frequency radio surveys that include NGC 253: the 74 MHz VLSSr (Lane et al. 2014) and the 150 MHz Tata Institute of Fundamental Research (TIFR) Giant Metrewave Radio Telescope (GMRT) Sky Survey (TGSS) Alternative Data Release 1 (ADR1; Intema et al. 2016).
The TGSS survey observed the whole radio sky north of declination −53° at a frequency 150 MHz (bandwidth Δν = 16.7 MHz) at an angular resolution arcsec2 at declinations south of +19°. The instantaneous field of view of the survey at half power at 150 MHz is 3.1 × 3.1 deg2, with sensitivity to structures up to 68 arcmin in angular scale (Intema et al. 2016). Since the absolute flux density calibration of the TGSS ADR1 may be uncertain up to 50% in some sky regions,25 we independently verified the calibration in the area of NGC 253. We selected unresolved sources with flux density >1 Jy from the 5 × 5 deg2 mosaic that included NGC 253 (R03_D17). We compared the TGSS ADR1 flux densities of these sources with the predicted values based on the spectral modeling in which we used the VLSSr, GLEAM (deep 200 MHz), MRC, and NVSS surveys. We found that the TGSS mosaic required scaling by a factor 1.02 in flux density, and the absolute flux density calibration was accurate to 7%; we further added this error in quadrature to the quoted uncertainties of our measurements.

The VLSS survey (Cohen et al. 2007) observed the radio sky north of −30° at a frequency 74 MHz. Here we use the recent re-reduction of the survey data, the VLSSr (Lane et al. 2014). VLSSr images have an angular resolution of 75 × 75 arcsec2 and a theoretical sensitivity to structures of 13–37 arcmin in angular scale.
We find that neither TGSS nor VLSSr is sensitive to the extended emission of NGC 253 (Figure 1). For this reason we use the TGSS data for the flux density measurement of the central starburst region, and both TGSS and VLSSr for measurements of the flux densities of background sources only.

Figure 1. 330 MHz image of NGC 253 from Carilli (1996) with overlaid contours from the TGSS ADR1 survey (white) and the MWA/EoR image (red). The TGSS contours start at 4σ local rms noise level (σ = 11.7 mJy beam−1) and increase as σ2i for i > 0. The MWA/EoR0 contour marks the 4σ radio intensity at 169 MHz (16.4 mJy beam−1). The sizes of the synthesized beams at 169 MHz (red), 330 MHz (green), and 150 MHz (black) are drawn in the top right corner. Background sources, not associated with the intrinsic emission of NGC 253, are labelled with numbers (see Section 4.1). The color scale is in units of Jy beam−1, and the pixel size is 5 × 5 arcsec2.
Download figure:
Standard image High-resolution image3. Methods
3.1. Flux Density Measurements
Measurements of the total flux density of NGC 253 were performed with CASA task imstat, which provides a summed flux density within a specified region of the image corrected for the synthesized beam. We masked all pixels below 2.6σ local rms noise level (Hales et al. 2012). For point sources the flux density was measured with the AIPS task jmfit; for each unresolved source we fit for two components—a Gaussian and a zero level with a slope. The absolute flux density scale is set to the scale of Baars et al. (1977).
3.2. Models of Radio Spectra
Radio sources often show simple spectra that can be approximated by a power law. However, at low radio frequencies (a few hundred megahertz and below) radio spectra are consistently more curved (Laing & Peacock 1980; Hummel 1991; Deeg et al. 1993; Blundell et al. 1999; Duffy & Blundell 2012; Marvil et al. 2015) until a turnover frequency below which they become inverted. The spectral turnover is typically caused by synchrotron self-absorption (SSA) and/or thermal FFA (Callingham et al. 2015, and references therein). If there is no evidence for a turnover in the radio spectra we construct here (see Section 3.4 for the method of model selection), we proceed with fitting a polynomial. The curved radio spectra are then modeled with an nth-order polynomial, which on a logarithmic scale takes the general form

where A0 is an offset parameter (equivalent to log(S0) in the case of a simple power law), A1 is the spectral index −α, and An are curvature parameters (cn). In the linear space the model takes the form

which we use in our modeling to preserve Gaussian noise characteristics of the measurements.
Where the data suggest or show a spectral turnover, the following models are tested: SSA, FFA, or a combination of these and power-law components.
3.2.1. Synchrotron Self-absorption
At low radio frequencies the intensity of the synchrotron radiation may become sufficiently high (optically thick regime) for reabsorption, termed SSA, to take over. The process may be important, or even dominant, for compact sources (Slysh 1990; Chevalier 1998). We model the synchrotron radio spectra that may turn over due to self-absorption at low radio frequencies as (e.g., Tingay & de Kool 2003)


where is a frequency at which the optical depth (τ) reaches unity.

3.2.2. Free–Free Absorption
The self-absorbed bremsstrahlung (i.e., free–free absorbed) radio spectrum can be expressed as (e.g., McDonald et al. 2002)

where the opacity coefficient is given by

As discussed in Section 1, radio emission from NGC 253 is a mixture of synchrotron emission from cosmic rays from SNRs and thermal emission from H ii regions. The FFA is expected to start dominating at low radio frequencies, where the intensity of the electrons in the ionized gas becomes high (optically thick regime). For NGC 253 it is a natural assumption that the thermal plasma coexists with the synchrotron-emitting electrons, hence the radio spectrum can be modeled as a synchrotron power law with an internal free–free absorbing screen (SFA; Tingay & de Kool 2003),

3.3. Weighted Nonlinear Least-squares Fitting
All measurements in this paper are considered to be independent of each other (in the GLEAM survey valid for flux densities ≳5 Jy; see Hurley-Walker et al. 2017), thus a simple form of χ2 statistic is used for the fitting of the radio spectra, which at the same time is the goodness-of-fit of the fitted model (Mi),

for i = 1, ..., n data points. In minimization of Equation (8) we use the Levenberg–Marquardt algorithm (Levenberg 1944; Marquardt 1963) implemented in the Python26 module lmfit (Newville et al. 2014).
3.4. Model Selection
We use the Bayesian inference method for the formal model selection. We follow the prescription outlined in Callingham et al. (2015), with the log-likelihood function (the probability of observing the data given model parameters θ) in the form of

Under the hypothesis that the models being compared (M1, M2) are equally likely, the model can be selected based solely on the Bayesian evidence (Z), where

and

The dimensionality of the integration depends on the number of model parameters. If Δln(Z) ≥ 3 model M2 is strongly favored over M1. If 1 < Δln(Z) < 3 model M2 is only moderately favored over M1, and if Δln(Z) < 1 the preference of one model over the other is inconclusive. For more discussion on the theoretical background of the method used see Callingham et al. (2015). We use the MultiNest tool (Feroz & Hobson 2008; Feroz et al. 2009, 2013; Buchner et al. 2014) for our calculations of the Bayesian evidence.
4. Results
In what follows we refer to the "halo" as the radio emission beyond the boundary of the optical disk of the galaxy. Given the low angular resolution of the MWA observations we distinguish only between the disk of the galaxy and the extended synchrotron halo.
Table 2. Flux Density Measurements of Background Sources Embedded in NGC 253 Radio Emission
| Frequency | Background | Background | Background | Angular | References |
|---|---|---|---|---|---|
| (MHz) | Source 1 | Source 2 | Source 3 | Resolution | |
| (mJy) | (mJy) | (mJy) | (arcsec2) | ||
| 74 | 263 ± 76a | ⋯ | ⋯ | 75 × 75 | ac |
| 150 | 212 ± 19 | 15.6b | 162 ± 17 | 36 × 24 | bc |
| 200 | 233 ± 23 | ⋯ | ⋯ | 138 × 126 | c |
| 330 | 190 ± 10 | ⋯ | ⋯ | 72 × 72 | d |
| 610 | 84 ± 15 | ⋯ | ⋯ | 114 × 24 | e |
| 843 | 97 ± 10 | ⋯ | ⋯ | 47 × 43 | f |
| 1465 | 63.0 ± 2.5 | ⋯ | ⋯ | 66 × 38 | g |
| 1465 | 53.0 ± 3.0 | 17.2 ± 1.0 | 26 ± 2 | 30 × 30 | d |
| 1490 | 5.6 ± 0.5 | ⋯ | 53.0 ± 0.5 | 19.0 ± 0.5 | h |
| 4850 | 19.0 ± 1.0 | 6.6 ± 0.3 | 7.9 ± 0.4 | 30 × 30 | d |
| 8350 | 9.5 ± 0.5 | ⋯ | ⋯ | 84 × 84 | d |
Notes. All measurements are in the same absolute flux density scale of Baars et al. (1977).
aTentative detection (2.5σ). bUpper limit, equal 3 × local rms noise level. cOur measurement based on images from the quoted survey.References. (a) Lane et al. (2014), (b) Intema et al. (2016), (c) this publication, (d) Heesen et al. (2009a), (e) Bosma et al. (1983), (f) Reynolds & Harnett (1983), (g) Hummel et al. (1984), (h) Condon (1987).
Download table as: ASCIITypeset image
4.1. Background Sources
There are three discrete radio sources located within the extended emission of NGC 253; the sources are marked in Figure 1, and their positions are based on the NVSS and measurements of Heesen et al. (2009a).
Discrete radio source no. 1 is located at R.A.(J2000)= 00h47m59 10, decl.(J2000) = −25°18'22
 45 at 200 MHz, and is most likely a background radio source (Carilli et al. 1992). The radio source is detected in the GLEAM images, but at low frequencies it becomes increasingly confused with the halo emission of NGC 253. We measure the flux density of the source only in the deep GLEAM image (Table 2). Discrete radio source no. 2 is located at R.A.(J2000) = 00h47m1201, decl.(J2000) = −25°17'439 and is most likely a faint background radio source (Heesen et al. 2009a). This source is heavily embedded in the extended emission of NGC 253 in the MWA images. Discrete radio source no. 3 is located at R.A.(J2000) = 00h47m4491, decl.(J2000) = −25°13'384. This source is embedded in the extended emission in our MWA images, but is clearly detected in the TGSS ADR1 image (Figure 1). The flux density measurements of the background sources are listed in Table 2, and the spectral modeling results are given in Table 3. We subtract the estimated contribution of these sources to the flux density from the measurements of the total flux density of NGC 253. In addition, we model background source no. 1 as a point source with a peak flux density of 240 mJy at 169 MHz and 223 mJy at 200 MHz, and for pictorial purposes we subtract it directly from the plane of the radio image. The resulting radio contours are overlaid on Hα and X-ray images in Figure 2 and discussed in Section 5.1.

Figure 2. Left: Hα image from the Survey for Ionization in Neutral Gas Galaxies (SINGG; Meurer et al. 2006). The image was taken with the CTIO 0.9 m telescope for SINGG using a 75 Å wide narrowband filter, and continuum was subtracted using an image taken in the R band (Harris filter) in the same observing setup. The image has been smoothed by a factor 6 to aid in inspection of the faint wind features. The GLEAM contours start at 4σ rms level (σ = 11 mJy beam−1) and increase by a factor of for i > 0. The background discrete sources within extended emission of NGC 253 have been removed (see Section 4.1). Right: XMM-Newton image of soft X-ray emission from NGC 253 and its environment (0.2–1 keV band; Bauer et al. 2008) with overlaid MWA/EoR0 intensity contours.Both color bars are in units of 10−3 counts s−1 px−1. The MWA/EoR0 contours start at 4σ rms level (σ = 4.1 mJy beam−1) and increase by a factor of for i > 0.


Download figure:
Standard image High-resolution imageTable 3. Results of the Spectral Modeling of the Background Sources
| Background | Polynomial | S1 GHz | α | c1 | dof | χ2 |
|---|---|---|---|---|---|---|
| source | order | (mJy) | ||||
| 1 | 2 | 80.7 ± 1.9 | 0.79 ± 0.02 | −0.25 ± 0.04 | 7 | 19.2 |
| 2 | 2 | 21.9 ± 1.0 | 0.32 ± 0.07 | −0.63 ± 0.11 | 1 | 3.5 |
| 3 | 1 | 33.1 ± 1.4 | 0.88 ± 0.03 | ⋯ | 1 | 2.8 |
Download table as: ASCIITypeset image
4.2. NGC 253
Radio images of NGC 253 at six chosen radio frequencies are presented in Figure 3. At 200 MHz, the deepest image from the GLEAM observations presented here, the size of NGC 253 is 1310 arcsec (major axis) and 535 arcsec (minor axis) measured at PA = 52°, with a total radio luminosity density of 2.4(±0.1) × 1022 W Hz−1. At 169 MHz (MWA/EoR0 image), the size increases by 3%–6%, to 1440 arcsec (major axis) and 615 arcsec (minor axis), which may be a combination of the intrinsic increase in size and the uncertainty of the measurement.

Figure 3. Radio images of NGC 253 from the GLEAM survey at five selected frequencies: (centered on 88 MHz (top left), 118 MHz (top middle), 154 MHz (top right), and 215 MHz (bottom right) with bandwidth Δν = 30.7 MHz; centered on 200 MHz with bandwidth Δν = 61.4 MHz (bottom middle) and from the MWA EoR data (169 MHz; bottom left). The synthesized beam sizes are drawn in the top right corner of each image. The color scales are in units of Jy beam−1, and the pixel sizes are 28.8 × 28.8 arcsec2 at 88 MHz, 118 MHz, and 154 MHz, 30.6 × 30.6 arcsec2 at 169 MHz, and 18.8 × 18.8 arcsec2 at 200 and 215 MHz.
Download figure:
Standard image High-resolution image4.2.1. Total Radio Emission
Radio continuum spectra of NGC 253 between 76 MHz and 10.7 GHz are plotted in Figure 4 and the flux density measurements are tabulated in Table 4. Background radio sources (Section 4.1) located within the diffuse emission of NGC 253 were subtracted from the total flux density measurements. In the construction of the radio spectrum we used archival data provided that the measurements were of angular resolution comparable to GLEAM or were sensitive to low-brightness emission on angular scales of at least 05, the total flux density was integrated over the diffuse emission of NGC 253 and not fitted by Gaussian components, and the absolute flux density scale and the uncertainties of the measurements were quoted. We do not use measurements at an angular resolution of >20 arcmin because of confusion of NGC 253 with nearby sources.

Figure 4. Left: Radio spectra of the total radio emission of NGC 253 (filled symbols) and the central starburst region (empty symbols; measured at an angular resolution of ∼20–30 arcsec, equivalent to ∼300–500 pc; Table 5). The measurements from the GLEAM survey are drawn as circles, those from the MWA/EoR0 observations as a star, and data from the literature as triangles (Table 4). The final spectral energy distribution of the NGC 253 total emission is modeled as a three-component model (solid line, purple) and is a combination of a power law, a second-order polynomial component modeling the extended emission (drawn cumulatively as dashed–dotted–dotted, green), and internally free–free absorbed synchrotron emission of the central starburst (dash-dotted, brown/yellow; refer to Section 5.2). For reference the central starburst modeled as self-absorbed synchrotron emission (dashed, blue) and a second-order polynomial (dotted, gray) is also drawn. The contribution of the background sources to the flux density has been subtracted from the total flux density of NGC 253 (Section 4.1). Right: Radio spectra of the background sources. The measurements are listed in Table 2, and results on the spectral fitting in Table 3. The uncertainties on each fit are drawn as shaded areas.
Download figure:
Standard image High-resolution imageTable 4. Total Integrated Flux Density Measurements of NGC 253
| Frequency | Total | Angular | Largest | References |
|---|---|---|---|---|
| (MHz) | (Jy) | Resolution | Angular Scale | |
| (arcmin2) | (deg) | |||
| 76 | 23.9 ± 2.0 | 5.1 × 4.7 | 29 | a |
| 80 | 23.7 ± 4.0 | 3.7 × 3.7 | no info | b, c |
| 84 | 22.6 ± 1.9 | 5.1 × 4.7 | 27 | a |
| 92 | 20.9 ± 1.7 | 5.1 × 4.7 | 24 | a |
| 99 | 20.0 ± 1.6 | 5.1 × 4.7 | 23 | a |
| 107 | 20.3 ± 1.7 | 5.1 × 4.7 | 21 | a |
| 115 | 20.0 ± 1.6 | 5.1 × 4.7 | 19 | a |
| 122 | 18.8 ± 1.6 | 5.1 × 4.7 | 18 | a |
| 130 | 17.8 ± 1.5 | 5.1 × 4.7 | 17 | a |
| 143 | 17.9 ± 1.5 | 5.1 × 4.7 | 16 | a |
| 151 | 16.6 ± 1.4 | 5.1 × 4.7 | 15 | a |
| 158 | 16.1 ± 1.3 | 5.1 × 4.7 | 14 | a |
| 166 | 15.7 ± 1.3 | 5.1 × 4.7 | 13 | a |
| 169 | 15.0 ± 1.2 | 5.1 × 4.7 | 13 | a |
| 174 | 16.4 ± 1.3 | 5.1 × 4.7 | 13 | a |
| 181 | 15.7 ± 1.3 | 5.1 × 4.7 | 12 | a |
| 189 | 15.3 ± 1.2 | 5.1 × 4.7 | 12 | a |
| 197 | 15.4 ± 1.2 | 5.1 × 4.7 | 11 | a |
| 204 | 15.8 ± 1.3 | 5.1 × 4.7 | 11 | a |
| 212 | 15.1 ± 1.2 | 5.1 × 4.7 | 11 | a |
| 220 | 14.7 ± 1.2 | 5.1 × 4.7 | 10 | a |
| 227 | 15.0 ± 1.2 | 5.1 × 4.7 | 10 | a |
| 330 | 16.5 ± 1.9 | 1.2 × 1.2 | 1.2 | d, e |
| 408 | 15.7 ± 1.9 | 2.9 × 2.86 | no info | f |
| 468 | 15.1 ± 1.5 | 2.1 × 2.1, 5.2 × 5.2a | extr. single dishb | c, g |
| 610 | 9.4 ± 0.6 | 1.9 × 0.4 | no info | h |
| 843 | 9.0 ± 0.9 | 0.72 × 0.78 | no info (th: 1.1) | i |
| 960 | 8.0 ± 0.12 | 20.2 × 20.2 | single dish | c, g |
| 1100 | 6.7 ± 0.08 | 4.2 × 4.2 | no info, dense core | j |
| 1200 | 6.68 ± 0.10 | 3.4 × 3.4 | no info, dense core | j |
| 1300 | 6.22 ± 0.07 | 3.2 × 3.2 | no info, dense core | j |
| 1400 | 5.89 ± 0.16 | 2.9 × 2.9 | no info, dense core | j |
| 1410 | 6.12 ± 0.12 | 15.5 × 15.5 | single dish | c, g |
| 1430 | 5.7 ± 0.5 | 0.91 × 0.83 | no info (th: 0.8) | h |
| 1465 | 5.9 ± 0.1 | 1.1 × 0.63 | extr. single dishb | k |
| 1465 | 6.3 ± 1.1 | 0.5 × 0.5 | 0.25 | d, e |
| 1490 | 5.6 ± 0.5 | 0.9 × 0.9 | 0.27 | m |
| 2650 | 3.85 ± 0.12 | 8.3 × 8.3 | single dish | c, g |
| 2695 | 4.26 ± 0.14 | 4.9 × 4.9 | single dish | n |
| 2700 | 3.49 ± 0.12 | 8.0 × 8.0 | single dish | c, g |
| 4850 | 2.93 ± 0.13 | 2.7 × 2.7 | single dish | n |
| 4850 | 2.71 ± 0.14 | 0.5 × 0.5 | single dish | e |
| 4850 | 2.69 ± 0.10 | 4.2 × 4.2 | single dish | p |
| 5009 | 2.50 ± 0.23 | 4.0 × 4.0 | single dish | c, g |
| 5009 | 2.12 ± 0.09 | 4.0 × 4.0 | single dish | c, r |
| 8350 | 1.66 ± 0.08 | 1.4 × 1.4 | single dish | e |
| 8700 | 2.06 ± 0.12 | 1.5 × 1.5 | single dish | n |
| 10550 | 1.98 ± 0.18 | 1.2 × 1.2 | single dish | s |
| 10700 | 1.95 ± 0.15 | 1.2 × 1.2 | single dish | t |
Notes. Uncertainties associated with the GLEAM, MWA/EoR, and TGSS measurements include the fitting error and the uncertainty of the absolute flux density calibration; for the remaining data the errors quoted in references are adopted. All measurements are brought to the same absolute flux density scale of Baars et al. (1977). If no information on the largest angular scale of the final images was reported, we state "no info," and we provide a theoretical value (upper limit, marked as "th") for those measurements for which information on the interferometer's shortest baseline was provided, and assume that adequate uv coverage has been achieved and no minimum-uv cut has been applied.
aConflicting details given in the reference. bCorrected for zero-spacing missing flux density with extrapolation.References. (a) This publication, (b) Slee & Higgins (1973), (c) Kuehr et al. (1981), (d) Carilli et al. (1992), (e) Heesen et al. (2009a), (f) Cameron (1971), (g) Wills (1975), (h) Bosma et al. (1983), (i) Reynolds & Harnett (1983), (j) Williams & Bower (2010), (k) Hummel et al. (1984), (m) Condon (1987), (n) Beck et al. (1979), (p) Griffith et al. (1994), (r) Wall et al. (1976), (s) Beck et al. (1994), (t) Klein et al. (1983).
Download table as: ASCIITypeset image
We find the best fitting model to be a second-order polynomial with S0 = 7.30 ± 0.04 Jy, α = 0.56 ± 0.01, and a curvature c1 = −0.12 ± 0.01 at a reference frequency of 1 GHz (χ2 = 140, with degrees of freedom: dof = 45; Figure 4), which is significantly preferred to a simple power law (Δln(Z) = 100.5 ± 0.3).
4.2.2. Central Starburst Region
The angular resolution of the MWA data is too low to resolve the central starburst region of NGC 253; the highest angular resolution achieved is 102 arcsec at 227 MHz (GLEAM) and 138 arcsec at 169 MHz (EoR), which is over three times the size of the starburst region (Condon et al. 1982; Antonucci & Ulvestad 1988; Carilli 1996). We construct radio spectra of the central starburst region using data from the literature and new measurements from the TGSS ADR1 survey (Figure 4, Table 5). We limit the measurements to those that are at an angular resolution comparable to the size of the central starburst region (approximately 20–30 arcsec).
Table 5. Flux Density Measurements of the Central Starburst Region of NGC 253
| Frequency | Central | Angular | References |
|---|---|---|---|
| (MHz) | Component | Resolution | |
| (Jy) | (arcsec2) | ||
| 150 | 2.16 ± 0.15 | 36 × 24 | ab |
| 330 | 2.67 ± 0.16 | 33 × 21 | b |
| 610 | 2.3 ± 0.2 | 114 × 24 | c |
| 1413 | 2.33 ± 0.14a | 3 × 1.8 | d |
| 1450 | 2.07 ± 0.04 | 33 × 21 | b |
| 1465 | 2.04 ± 0.10 | 30 × 30 | e |
| 1660 | 1.96 ± 0.04 | 33 × 21 | b |
| 4520 | 1.36 ± 0.04 | 33 × 21 | b |
| 4850 | 1.27 ± 0.06 | 30 × 30 | e |
| 4890 | 1.30 ± 0.04 | 33 × 21 | b |
| 6700 | 1.13 ± 0.04 | 37 × 37 | f |
| 7000 | 1.04 ± 0.04 | 35 × 35 | f |
| 8090 | 0.93 ± 0.03 | 33 × 21 | b |
| 8350 | 0.98 ± 0.05 | 84 × 84 | e |
| 8470 | 0.89 ± 0.03 | 33 × 21 | b |
Notes. All measurements are in the same absolute flux density scale of Baars et al. (1977).
aIntegrated. bOur measurement based on images from the quoted survey.References. (a) Intema et al. (2016), (b) Carilli (1996), (c) Bosma et al. (1983), (d) Condon et al. (1982), (e) Heesen et al. (2009a), (f) Williams & Bower (2010).
Download table as: ASCIITypeset image
We find the best fitting model to be a second-order polynomial with S0 = 2.28 ± 0.02 Jy, α = 0.20 ± 0.01, and a curvature c1 = −0.24 ± 0.01 at a reference frequency of 1 GHz (χ2 = 12.8, dof = 13; Figure 4). We further attempt to model the spectral turnover, and we find SFA (Equation (7)) to be the best fitting model with Jy, α = 0.43 ± 0.01, and (χ2 = 42.9, dof = 13). Based on the Bayesian evidence the SFA model (synchrotron plasma absorbed by an internal free–free absorbing screen) is preferred to the pure SSA model (


4.2.3. Spectral Index Maps
Using the total flux density images at 200 MHz (GLEAM), 169 MHz (MWA/EoR), and 1.46 GHz (Carilli et al. 1992), we created maps of the spectral index distribution and corresponding maps of the uncertainty and signal-to-noise ratio (Figure 5). To create the spectral index maps we convolved the 1.46 GHz image with the resolution of the GLEAM image (for the 200 MHz–1.46 GHz spectral index map), and the MWA/EoR image (169 MHz–1.46 GHz spectral index map). The spectral index maps suggest an apparent variation in α across the disk and halo of NGC 253. The central regions of the galaxy are dominated by a flat component (α = 0.31–0.34), coinciding with the central starburst. The gradual steepening along the minor axis found by Heesen et al. (2009a) is seen only on the northern side of the galaxy in our maps. Further, the region extending southwest (SW) from the central starburst region seems to be flatter (α ≲ 0.53) than the other parts of the galaxy outside the central starburst (α ∼ 0.60–0.65).

Figure 5. Top left: map of the radio spectral index distribution between 200 MHz (GLEAM) and 1.465 GHz (Carilli et al. 1992) at an angular resolution of 133 × 127 arcsec2 (drawn in the top right corner). The color scale is α px−1 with the pixel size 18 × 18 arcsec2. The spectral index was calculated only for pixels at ≥4σ rms level at each frequency. We also mark regions for which we calculate their separate spectral index for the T–T method (see Section 4.2.3). Top middle: a map of the average signal-to-noise ratio (S/N) of pixels at 200 MHz and 1.46 GHz used to create the spectral index map. Top right: uncertainty on the spectral index calculation per pixel based purely on the off-source rms noise levels. This uncertainty will be dominant for the low S/N pixels. At high S/N this uncertainty can only be considered as a lower limit. Bottom row: same as top row but between 169 MHz (MWA/EoR0) and 1.465 GHz (Carilli et al. 1992), at an angular resolution of 138 × 138 arcsec2.
Download figure:
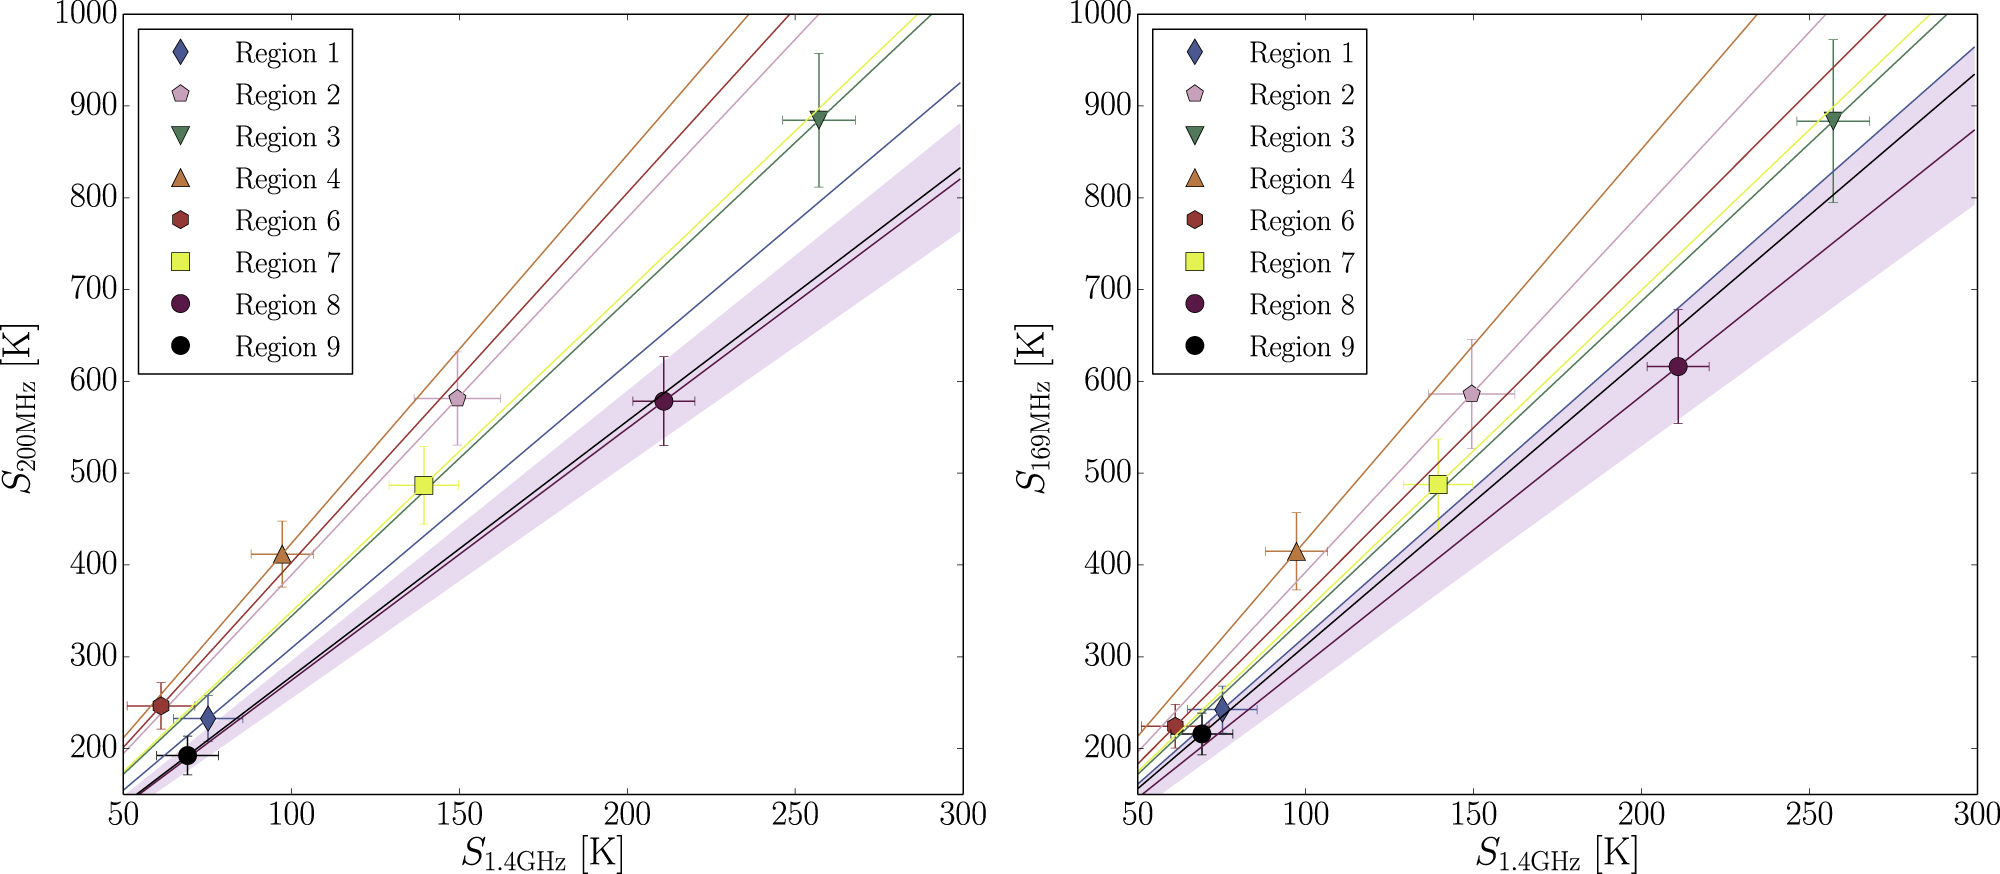
Standard image High-resolution imageTo verify the significance of the variation in spectral index across the galaxy, we used the T–T method (Turtle et al. 1962). The method allows one to estimate a spectral index within defined regions of a source between two frequencies. We define nine regions within NGC 253 (Figure 5). Due to the low angular resolution of our observations and to avoid oversampling, only one data point is associated with each region. The results are shown in Table 6 and Figure 6.

Figure 6. T–T plots between 200 MHz and 1.465 GHz (left) and between 169 MHz and 1.465 GHz (right). The fitted spectral index for each region (Figure 5) is drawn as a solid line and is tabulated in Table 6. Region 5 (central starburst) is not pictured. For clarity, only the uncertainties associated with Region 8 are drawn as a shaded area.
Download figure:
Standard image High-resolution imageTable 6. Radio Spectral Indices (α) Measured for Selected Regions of NGC 253 (Figure 5)
| Region | ||||||
|---|---|---|---|---|---|---|
| (mJy) | (mJy) | (mJy) | (mJy) | |||
| 1 | 0.54 ± 0.06 | 242 ± 26 | 75 ± 10 | 0.57 ± 0.06 | 233 ± 25 | 75 ± 10 |
| 2 | 0.63 ± 0.04 | 586 ± 59 | 149 ± 13 | 0.68 ± 0.03 | 581 ± 51 | 149 ± 13 |
| 3 | 0.57 ± 0.02 | 883 ± 89 | 257 ± 11 | 0.62 ± 0.02 | 884 ± 73 | 257 ± 11 |
| 4 | 0.67 ± 0.04 | 415 ± 42 | 97 ± 9 | 0.72 ± 0.04 | 412 ± 36 | 97 ± 9 |
| 5 | 0.31 ± <0.01 | 6558 ± 656 | 3341 ± 14 | 0.34 ± <0.01 | 6589 ± 528 | 3341 ± 14 |
| 6 | 0.60 ± 0.07 | 224 ± 24 | 61 ± 10 | 0.70 ± 0.07 | 246 ± 25 | 61 ± 10 |
| 7 | 0.58 ± 0.03 | 488 ± 49 | 139 ± 10 | 0.63 ± 0.03 | 487 ± 42 | 139 ± 10 |
| 8 | 0.50 ± 0.02 | 616 ± 62 | 211 ± 9 | 0.51 ± 0.02 | 578 ± 49 | 211 ± 9 |
| 9 | 0.53 ± 0.06 | 216 ± 23 | 69 ± 9 | 0.51 ± 0.06 | 192 ± 21 | 69 ± 9 |


Note. Radio spectral index maps are used at 169 MHz (MWA/EoR0; S169 MHz), 200 MHz (GLEAM; S200 MHz), and 1.465 GHz convolved to 169 MHz () and separately to 200 MHz () angular resolution.


Download table as: ASCIITypeset image
We find that between 200 MHz and 1.465 GHz the apparently flat regions (Regions 8 and 9) are statistically different from the other regions within NGC 253 apart from Region 1 (Figure 6, Table 6). This spectral flattening is not present in the map of the radio spectral index distribution between 330 MHz and 1.46 GHz of Heesen et al. (2009a), even though the same high-frequency map is used. This clearly indicates that the flattening occurs at <300 MHz. There is also a slight flattening of the spectral index in the northeast (NE) region perpendicular to the major axis (Region 1), although we find this flattening to be statistically different only from Regions 2 (eastern northwest (NW) halo), 4 (radio spur), and 5 (including central starburst) in the map. All regions flatten further at 169 MHz, reducing the differences between spectral indices of the regions.

5. Discussion
5.1. Low-frequency Synchrotron Radio Halo
A large-scale radio halo in NGC 253 was discovered and confirmed by Carilli et al. (1992) and studied extensively by Beck et al. (1994) and Heesen et al. (2009a, 2009b, 2011). This synchrotron halo is most pronounced at low radio frequencies, with estimated scale heights of 1.7 ± 0.1 kpc at 1.4 GHz and 2.5 ± 0.2 kpc at 330 MHz (Heesen et al. 2009a). Both the deep 200 MHz GLEAM image and the MWA/EoR image at 169 MHz reveal the extended synchrotron halo, which is at least as extensive as one detected in the 330 MHz map of Carilli et al. (1992) (Figure 1).
5.1.1. Maximum Vertical Extent
We measured the observed, projected maximum vertical extent of the disk and halo of NGC 253 at 169 MHz as a function of the distance from the nuclear region along the major axis (Figure 7, Table 7). The extent is measured perpendicular to the major axis (at PA = −38°, z-direction) in steps of 132 arcsec (2.4 kpc) separately for the north (filled circles) and south (empty circles) sides of the disk and halo as divided by the major axis (PA = 52°). We find the projected radio halo to extend up to 4.75 kpc above the optical edge (B band including 90% of total light, Lauberts & Valentijn 1989) and 6.3 kpc above the infrared edge (total Ks band, Jarrett et al. 2003) of the galaxy, reaching up to a total 7.9 kpc in the z-direction. This is consistent with previous radio measurements at higher radio frequencies (Reynolds & Harnett 1983; Hummel et al. 1984; Carilli et al. 1992, Figure 1; but see Heesen et al. 2009a), as well as with broadband X-ray observations of the galaxy's extended extraplanar emission (Pietsch et al. 2000). Heesen et al. (2009a, 2009b) attributed the decrease in scale height they measured and modeled to the increased synchrotron losses in the central regions, where the magnetic field is highest.

Figure 7. Projected maximum vertical extent of the disk and halo of NGC 253 at 169 MHz (h) as a function of the distance from the nuclear region along the major axis (x), where 0 is centered on the nucleus of the galaxy. The NE direction along the major axis is negative and SW is positive. The extent is measured perpendicular to the major axis (at PA = −38°) at a step of 132 arcsec (2.4 kpc) separately for the north (filled circles) and south (empty circles) sides of the disk and halo as divided by the major axis (PA = 52°). The synthesized beam size of the radio image, 138 × 138 arcsec2, is not included in the uncertainties and is drawn as a solid horizontal line. Measured sizes of NGC 253 in the optical B band including 90% of total light (dashed–dotted line) and total infrared Ks band (dashed line) are drawn for reference. Plotted values are tabulated in Table 7.
Download figure:
Standard image High-resolution imageTable 7. Projected Maximum Vertical Extent of the Disk and Halo of NGC 253 at 169 MHz (h)
| x | x | h North | h North | h South | h South |
|---|---|---|---|---|---|
| (arcsec) | (kpc) | (arcsec) | (kpc) | (arcsec) | (kpc) |
| −658 | −11.8 | 113 | 2.0 | 100 | 1.8 |
| −526 | −9.5 | 213 | 3.8 | 211 | 3.8 |
| −395 | −7.1 | 262 | 4.7 | 327 | 5.9 |
| −263 | −4.7 | 396 | 7.1 | 440 | 7.9 |
| −132 | −2.4 | 416 | 7.5 | 367 | 6.6 |
| 0 | 0.0 | 311 | 5.6 | 291 | 5.2 |
| 132 | 2.4 | 270 | 4.9 | 291 | 5.2 |
| 263 | 4.7 | 297 | 5.5 | 323 | 5.8 |
| 395 | 7.1 | 279 | 5.0 | 260 | 4.7 |
| 526 | 9.5 | 201 | 3.6 | 171 | 3.1 |
| 658 | 11.8 | 56 | 1.0 | 100 | 1.8 |
Note. The projected maximum vertical extent is measured at a distance x from the nuclear region along the major axis, where 0 is centered on the nucleus of the galaxy. The NE direction along the major axis is negative and SW is positive. The extent is measured perpendicular to the major axis (PA = −38°) separately for the north and south sides of the disk and halo. The uncertainties on the measurements are 21.6 arcsec (equivalent to 0.4 kpc). See Section 5.1 for discussion.
Download table as: ASCIITypeset image
5.1.2. Halo Morphology
The shape of the radio halo in our MWA radio images (Figure 2) resembles the "horn-like" or "X-shaped" structure seen at gigahertz radio frequencies (Heesen et al. 2009a), in H i (Boomsma et al. 2005; Lucero et al. 2015), X-rays (Fabbiano 1988; Pietsch et al. 2000; Bauer et al. 2008), Hα (G. Meurer, private communication; Figure 2), UV (Hoopes et al. 2005), and far-IR (Kaneda et al. 2009).
The radio halo was investigated in detail by Heesen et al. (2009b) who, through modeling of the large-scale magnetic field, attributed its origin to disk wind, confirming previous suggestions (Carilli et al. 1992; Beck et al. 1994). This is also in line with the Hα and optical analyses of the inner starburst-driven superwind (Westmoquette et al. 2011). In our MWA maps both the NE and NW halo regions are pronounced. The extended soft X-ray emission (<1 keV) of the halo, detected in the northwestern direction from the disk of NGC 253, is interpreted as bubbles of hot low-density gas (Figure 2; Pietsch et al. 2000; Strickland et al. 2002). Heesen et al. (2009b) postulate that the large-scale magnetic field of the halo follows the walls of these bubbles, where it may be compressed, producing the X-shaped synchrotron radio halo as well as heating up pre-existing cold gas to X-ray energies. The northern halo can also be easily seen, in projection, in our Figure 2 where we overlay MWA/EoR intensity contours on the XMM-Newton image of soft X-ray emission.
The southeast (SE) region of the extended halo, the "spur" (Carilli et al. 1992), is contaminated by a background source. We modeled the background source as unresolved (at MWA angular resolution) and subtracted it from the 169 MHz EoR and deep 200 MHz GLEAM images as described in Section 4.1. The residual emission, which we consider intrinsic to the "spur," is shown in Figure 2 overplotted on the Hα and X-ray images. Although slightly offset (as expected, see Figure 19 in Heesen et al. 2009b), the feature broadly coincides with the extended outflows at both frequencies as clearly seen in our figure. The spur has been previously interpreted as originating from the active star formation region in the NE end of the bar (Waller et al. 1988; Carilli et al. 1992). We confirm the association of the radio "spur" with an extended Hα outflow, which can be clearly seen in our Figure 2 (G. Meurer, private communication; Kennicutt et al. 2003). In our radio spectral map between 200 MHz and 1.46 GHz the spur displays the steepest spectral index within the galaxy (Figure 5), gradually steepening from α ∼ 0.7 to α ∼ 0.9 outward from the disk of the galaxy (though it still contains background source no.1 with α = 0.57), which is indicative of ageing unabsorbed synchrotron plasma.
5.2. Spectral Properties of NGC 253
5.2.1. Broadband Spectrum of Total Radio Emission
The broadband spectrum of the total radio emission from NGC 253 is steep, although flattening at megahertz radio frequencies (Figure 4). The total radio emission originates from SNRs, H ii regions (predominantly the central starburst region; e.g., Ulvestad & Antonucci 1997; Ulvestad 2000; but see Waller et al. 1988; Hoopes et al. 1996) and electrons (cosmic rays) freely spiralling in the large-scale magnetic field (radio halo; Heesen et al. 2009a). The steep spectrum is understood to be of a synchrotron origin. The flattening of the spectrum, however, may be due to a number of reasons, including some degree of absorption of the synchrotron emission (Equation (3)) and a low-energy cutoff of the electron population, where in general it is assumed the spectrum of the electron energy (E) can be described as a power law with the index p related to the radio spectral index as . The flattening of the spectra of starburst galaxies at low radio frequency is not unusual and it has been observed previously (e.g., Marvil et al. 2015).


We attempt to separate the contributions of the extended and central starburst emission to the total flux densities to see whether the spectral flattening can be attributed mostly to the absorption occurring in the central starburst region. To do this we simultaneously fitted the spectra of the total flux density and the central starburst region, assuming an underlying two- or three-component spectrum composed of the central starburst region (component C) and extended emission (component E, consisting of one or two components). As an example of our fitting method, in the case where component E is modeled as a power law and component C as free–free absorbed synchrotron emission, the model equation ( takes the form


where


τff(ν) is given by Equation (6) and the indices indicate: tot—total, cor—core, C—component C, E—component E, ext—extended. This model equation is then compared to our observed data (), where . In the two-component model, we fit component E with either a simple power law or a curved spectrum (second-degree polynomial; Equation (1)). In the three-component model, we fit component E with a combination of a power law and either a curved spectrum, a synchrotron self-absorbed component (Equation (3)), or a synchrotron free–free absorbed component (Equation (7)). Component C is modeled with either a second-degree polynomial, self-absorbed synchrotron emission, or synchrotron power-law emission with a free–free absorbing screen.


We find the best fitting model to be the three-component model, with (1) component E modeled as a combination of a simple power law and a second-order polynomial, with a total flux density S0 = 5.08 ± 0.50 Jy and α = 0.71 ± 0.01 at reference frequency 1 GHz, and 34% of S0 becoming absorbed at low frequencies as described by a second-order polynomial with c1 = −0.76 ± 0.17, and (2) component C modeled as a synchrotron plasma with an internal free–free absorbing screen, with Jy, , αSSA = 0.41 ± 0.01. The three-component model (χ2 = 173, dof = 58) is favored over any two-component model, even if component E is modeled as a second-order polynomial (


Preference of the three-component model indicates that flattening of the spectrum of component E at the lower frequencies is non-negligible. In principle, this flattening could be attributed to SSA caused by shock reacceleration of the halo/disk plasma, an external free–free absorbing screen, or an intrinsic low-energy cutoff of the electron distribution. Thermal FFA can be largely excluded based on the limited evidence for high thermal content in the halo of NGC 253, especially in the SW region (see Section 5.2.2 for details). Although our Bayesian inference tests indicate that the flattening caused by the SSA is moderately favored over the low-energy cutoff in the electron distribution, which could be inferred from the second-order polynomial fit (), we find that the former fit is associated with very high uncertainties. We also find that any model invoking multiple internal components that we tested is strongly favored over an external free–free absorbing screen. Our results do not change in the absence of the data points between 300 and 600 MHz that may seem unusually high, which further strengthens our result that the radio-emitting plasma in the disk and halo of NGC 253 is composed of at least two spectral components that behave differently. This result is also in line with our findings on the variation of the radio spectral index across the galaxy (discussed further in the next section).

Furthermore, another important result of our spectral modeling is that the central starburst region is best modeled by the SFA model. Although, in principle, the second-order polynomial is statistically favored, the SFA model is more realistic. Curved radio spectra can be explained by a low-energy cutoff of the electron population, SSA, SFA, or FFA models. As we have shown, the SSA model is statistically ruled out (Section 4.2.2). Given the overwhelming evidence of a significant thermal component in the central starburst (e.g., Figure 2; Ulvestad & Antonucci 1997; Keto et al. 1999; Kepley et al. 2011) coexisting with synchrotron plasma, the synchrotron FFA model is more likely than the low-energy cutoff in the electron population. The plasma becomes optically thick around a frequency of 230 MHz. Given this result, and under a simplified assumption that a uniform optical depth holds across the region, we estimate a typical emission measure (Oster 1961; Spitzer 1978) of the absorbing gas toward the central starburst region to be very high, of the order 4 × 10⁵ pc cm−6 (assuming electron temperature Te = 4000 K; see discussion in Carilli 1996).
5.2.2. Maps of the Radio Spectral Index Distribution
We now consider the origin of the variation in α across the disk and halo of NGC 253. The southern flattening occurs beyond the SW spiral arm, in the halo region. In Figure 8 we overplot the and extraplanar H i contours on the XMM-Newton soft X-ray image of NGC 253. The diffuse X-ray emission indicates ionized hot gas. As pointed out by Lucero et al. (2015), the neutral cold H i gas seems to surround the X-ray-emitting regions. The spatial variations of the radio spectral index seem to follow the distribution of the X-ray emission, with the steepening of α occurring in the regions of intense soft X-ray emission (radio spur and NW halo) and the flattening around the voids of diffuse X-ray plasma (western SE halo, eastern NW halo). This distribution seems to also match the extraplanar H i emission, especially in the western SE halo region. In Hα we detect faint diffuse emission in the NE halo and the southern "spur" (Figure 2), with the line fluxes measured down to 3 × 10⁻¹⁸ erg cm−2 s−1 arcsec−2. In these regions the spectral index seems to steepen (Figure 8(B)). There is, however, almost no Hα emission present in the western SE halo, while most of the flattening of component E in the modeling of Section 5.2.1 is due to this region (Figure 8(C), Regions 8 and 9 in Figure 5).


Figure 8. (A) XMM-Newton image of soft X-ray emission from NGC 253 and its environment (0.2–1 keV band; Bauer et al. 2008) with overlaid contours of the GLEAM radio spectral index distribution (black) and anomalous extraplanar H i (Lucero et al. 2015). The color bar is in units of 10−5 counts s−1 px−1. The H i contour levels are 0.09, 0.58, 1.45, 2.9, and 4.8 × 1019 cm−2. The beam size of the H i observations is 3.5 × 3.0 arcmin2. (B) Zoom-in on the north disk and NE halo in our Hα image (Figure 2) with overlaid contours of the GLEAM radio spectral index. (C) Zoom-in on the SW halo in Hα with overlaid contours of the GLEAM radio spectral index. The two objects at R.A. = 00:47:20.3, decl. = −25:22:51.4 and R.A. = 00:47:34.8, decl. = −25:23:41.9 are foreground stars. The color bar of panels B and C is in units of counts s−1 px−1.
Download figure:
Standard image High-resolution imageIt has previously been suggested that the halo gas originates from both galactic "fountains" from the star-forming disk and a galactic superwind (Pietsch et al. 2000; Bauer et al. 2008). This strong superwind may be pushing and collimating the neutral cold gas in the halo (Lucero et al. 2015). In the case of strong collimation shocks one may observe flattening of radio spectra due to SSA in transverse shocks. Our results seem to favor such a scenario. It is also worth noting that the spectral flattening of the SW halo corresponds to an extended loop, or arch, seen in optical images (blue filter; Beck et al. 1982). However, if the SW halo is predominantly diffuse and of low density, the flattening may be rather due to an intrinsic low-energy cutoff of the electron distribution.
Another important note is that, based on our modeling of the broadband radio spectrum, the SW halo region cannot be fully responsible for the total spectral flattening. Radio emission that becomes absorbed at lower frequencies constitutes more than 30% of the total extended radio emission at 1 GHz (1.73 ± 0.36 Jy), while the SW region is only 0.77 Jy at that frequency, which means that the flattening must also be occurring, although to a lesser degree, in other regions across the disk and halo.
Although the SW flattening of the radio spectral index is most likely of a synchrotron origin, an external free–free absorbing screen was also previously suggested. The foreground absorption model was favored by Bauer et al. (2008) based on their modeling of X-ray data and apparent differences in radio and X-ray halo morphologies. As proved later (e.g., Heesen et al. 2009a, 2009b; this publication, Section 5.1), deep continuum and polarization radio observations at both gigahertz and megahertz frequencies reveal the horn-like structure of the radio halo, which directly resembles the X-ray diffuse emission. Based on the assumptions of equipartition, Heesen et al. (2009a, 2011) find the magnetic field within the halo to be very high, 7–12 μG, reaching as much as 160 ± 20 μG in the central regions and 46 ± 10 μG in the starburst outflow. The magnetic field in the central regions is strong enough for synchrotron emission to contribute a few per cent to the total X-ray emission (Lacki & Thompson 2013). As discussed in the previous section, we also find that an external free–free absorbing screen is not a statistically preferred model. These new findings support models in which the total X-ray emission may indeed come from a combination of thermal and synchrotron plasma rather than multi-temperature pure thermal plasma with an externally caused absorption (see Bauer et al. 2008).
6. Conclusions
We present deep, low-frequency radio continuum images and flux density measurements of a nearby, archetypal starburst galaxy, NGC 253. Our data are part of the GLEAM and the MWA EoR observations. The images span frequencies between 76 and 231 MHz at an angular resolution of 1.7–5 arcmin and rms noise levels of 4–75 mJy (depending on frequency), and represent the deepest measurements of NGC 253 at these low radio frequencies yet.
Our main findings are summarized as follows.
- 1.We detect a large-scale synchrotron radio halo that at 154–231 MHz displays the X-shaped/horn-like structure seen at gigahertz radio frequencies, and it is broadly consistent with other multiwavelength observations of NGC 253.
- 2.The projected maximum vertical extent of the synchrotron emission at 169 MHz is up to 7.5 kpc NW (7.9 kpc SE) from the major axis of NGC 253, consistent with large-scale soft X-ray emission (extending 9 kpc NW) and X-ray outflow (6.3 kpc SE).
- 3.The radio spectrum of the central starburst region of NGC 253 is significantly curved at low radio frequencies, with the spectral turnover occurring around 230–240 MHz, which is statistically constrained for the first time.
- 4.The maps of radio spectral index show significant spectral variations in the structure of NGC 253 between 200 MHz and 1.465 GHz. In particular, we isolate a region of statistically significant spectral flattening to the western side of the SE halo. However, as the SW region is rather faint at 1.46 GHz it cannot be fully responsible for the total spectral flattening, which indicates that the flattening must also be occurring, likely to a lesser degree, in other regions across the disk and halo.
- 5.The broadband spectrum of integrated total radio emission of NGC 253 is best described as a sum of central starburst and extended emission, where the central starburst component is best modeled as an internally free–free absorbed synchrotron plasma, and the extended emission as synchrotron emission flattening at low radio frequencies. We also find that an external free–free absorbing screen is not a statistically preferred model when compared to models including multiple internal components.
- 6.We find that the extended emission of NGC 253 is best modeled by a combination of two synchrotron components, one of which becomes significantly absorbed at low radio frequencies. The flattening occurs at frequencies below 300 MHz, and may be attributed to SSA of shock-reaccelerated electrons or an intrinsic low-energy cutoff of the electron distribution.
A.D.K. thanks P. A. Curran for valuable discussions on data modeling and constant encouragement in achieving the goals. The authors thank the anonymous referee for careful reading of the manuscript and suggestions that improved this paper. The authors thank W. Pietsch and D. Lucero for providing, respectively, X-ray and H i fits images of NGC 253, and O.I. Wong and X. Sun for helpful comments. The authors thank V. Heesen for 1.465 GHz image of NGC 253 and for helpful discussions. S.B. acknowledges funding for the ICRAR Summer Scholarship.
This research was conducted under financial support of the Australian Research Council Centre of Excellence for All-sky Astrophysics (CAASTRO), through project number CE110001020. This scientific work makes use of the Murchison Radio-astronomy Observatory, operated by CSIRO. We acknowledge the Wajarri Yamatji people as the traditional owners of the Observatory site. Support for the operation of the MWA is provided by the Australian Government (NCRIS), under a contract to Curtin University administered by Astronomy Australia Limited. We acknowledge the Pawsey Supercomputing Centre, which is supported by the Western Australian and Australian Governments. This research has made use of the NASA/IPAC Extragalactic Database (NED), which is operated by the Jet Propulsion Laboratory, California Institute of Technology, under contract with the National Aeronautics and Space Administration. This publication uses the following radio data reduction software: the Multichannel Image Reconstruction, Image Analysis and Display software (Miriad; Sault et al. 1995), the Common Astronomy Software Applications package (CASA; McMullin et al. 2007), and the Astronomical Image Processing System AIPS. AIPS is produced and maintained by the National Radio Astronomy Observatory, a facility of the National Science Foundation operated under cooperative agreement by Associated Universities, Inc.
Footnotes
- 24
Radio spectral index α is defined such that the flux density Sν at a frequency ν is .
- 25
- 26
