


Abstract
Three different types of rocks were tested in a high enthalpy air plasma flow. Two terrestrial rocks, basalt and argillite, and an ordinary chondrite, with a 10 mm diameter cylindrical shape were tested in order to observe decomposition, potential fragmentation, and spectral signature. The goal was to simulate meteoroid ablation to interpret meteor observation and compare these observations with ground based measurements. The test flow with a local mass-specific enthalpy of 70 MJ kg−1 results in a surface heat flux at the meteorite fragment surface of approximately 16 MW m−2. The stagnation pressure is 24 hPa, which corresponds to a flight condition in the upper atmosphere around 80 km assuming an entry velocity of 10 km s−1. Five different diagnostic methods were applied simultaneously to characterize the meteorite fragmentation and destruction in the ground test: short exposure photography, regular video, high-speed imaging with 10 kHz frame rate, thermography, and Echelle emission spectroscopy. This is the first time that comprehensive testing of various meteorite fragments under the same flow condition was conducted. The data sets indeed show typical meteorite ablation behavior. The cylindrically shaped fragments melt and evaporate within about 4 s. The spectral data allow the identification of the material from the spectra which is of particular importance for future spectroscopic meteor observations. For the tested ordinary chondrite sample a comparison to an observed meteor spectra shows good agreement. The present data show that this testing methodology reproduces the ablation phenomena of meteoritic material alongside the corresponding spectral signatures.
Export citation and abstract BibTeX RIS
1. Introduction
Meteorites are recovered pieces of meteoroids which entered the Earth's atmosphere (Jenniskens 2008). Only in one single case have meteorite fragments found on the ground been related directly to a meteoroid entry and this meteoroid was linked to its parent body. It was in 2008 when the meteoroid 2008TC3 was discovered in space and observed until it entered the Earth's atmosphere over the Nubian desert (Jenniskens et al. 2009). Jenniskens et al. found meteorite fragments on the ground during systematic search expeditions. The meteorites were named after the region where the fragments were found: Almahata Sitta. This is the only occasion where space observations were directly related to material found on the ground. Only a few fragments were analyzed in renowned institutions worldwide. At the Institute of Space Systems, an Almahata Sitta fragment was used to measure surface emissivity as a function of the fragment's temperature (Loehle et al. 2016c). A large part of this meteorite was an ordinary chondrite, but also ureilite fragments were found.
The essential questions of interest are (1) what are the driving parameters for ablation during the entry flight and (2) how do we distinguish different meteorites? Furthermore, it is not clear whether these differences can be observed from the ground, for example with appropriate spectrally resolving systems. It is speculated that the origin of life could have been seeded by entering meteorites (Park & Brown 2012). In that case, the amino acids would have had to sustain meteor entry. Thus, a detailed understanding of meteorite entry is not only of significant importance to predict potentially hazardous entries, but can add information on the origin of life on planet Earth.
There is increasing interest in the analysis of potentially hazardous asteroids and their entry scenario which has led aerothermodynamic engineers to investigate meteor entries by applying the engineering tools developed for the entry of space capsules (Prabhu et al. 2015). The more recent re-entry flights from interplanetary travel, e.g., Stardust and Hayabusa, required the development of tools which allow the prediction of entry heat loads for capsules the size of a salad bowl flying at speeds as fast as 12 km s−1. The heat shields for these capsules were tested in shock tube facilities and plasma wind tunnels (Liu et al. 2010; Trumble et al. 2010; Suzuki et al. 2014).
First experimental studies in ground testing facilities of meteoroid entries were performed by Shepard et al. in 1967 (Shepard et al. 1967). Rocks were exposed to a high enthalpy air plasma flow in the NASA Ames arc-jet facilities. It was found that some materials, such as gabbro or basalt, resulted in similar radiation behavior in an arc-jet facility as fragments cut from stony meteorites. The focus in this early study was on the investigation of the apparent luminosity which was understood to be in close correlation to the fragmentation mechanism. Melting of these samples in arc-jet testing was used to improve analytical tools for entry predictions of meteors (Allen & Baldwin 1967). Compared to these very early investigations, recent ground tests by Park et al. in 2012 at the ballistic range at NASA Ames Research Center showed that, depending on the porosity of the meteor, fragmentation behavior can be very different (Park & Brown 2012).
In 2015, a laser radiation study was published by Stern et al. (2015). Park et al. were numerically analyzing the amount of radiative heat flux the meteoroid would face because of the extremely strong shock in front of the meteoroid, and the laser heating of Stern et al. was meant to provide a first data set for an ablation analysis of a meteoritic material. The data sets were analyzed with respect to the development of a fusion crust and numerical ablation codes were calibrated against the data.
In this paper, the experimental simulation of the entry scenario was conducted by exposing the fragment to a high enthalpy subsonic air plasma flow. The testing principle is similar to the tests of Shepard et al. (1967). The enthalpies are similar, however the total pressure is higher (with the exception of one condition in the testing of Shepard et al.) and thus the heat flux is higher. The goal of the present measurements was to identify the emission spectra of the fragment while it ablates under heat load and to analyze the potential fragmentation process. Three fragments were tested: two terrestrial rocks, a basalt and an argillite, as well as a meteorite fragment (H4 ordinary chondrite).
The duration during which the samples were exposed to the flow was not pre-defined. The samples were exposed to plasma flow until the sample disintegrated. Then, the facility was shut down quickly, so that heating stopped immediately.
Five different diagnostic methods were applied simultaneously: photography, video, high-speed imaging, thermography, and Echelle emission spectroscopy.
The next section provides a detailed description of the test setup with the facility, diagnostics, and the sample mount. The following section shows the measured data for each sample separately detaling particular observations. In a comparison section, the measured spectroscopic data sets are analyzed with respect to apparent temperature and experimentally observed spectra.
2. Testing
The experiments within this study were conducted in the plasma wind tunnel named PWK1 (Loehle et al. 2016a). The sample is mounted on a moving platform inside a vacuum chamber (6 m in length and 2 m in diameter) which is connected to an in-house vacuum pumping system. The vacuum chamber is comparably large in order to avoid significant influences from the chamber to the flowfield. The plasma generator RD5, a magnetoplasmadynamic arc-jet generator, is mounted into the front lid of the vessel (Auweter-Kurtz & Wegmann 2000). Electric power is provided by a current-regulated 6 MW DC power supply. The performance of the whole facility is monitored with over 45 sensors to protocol temperatures, power levels, cooling performance, and pressure data.
The probes with the samples or sensor facing the plasma can be moved in three axes inside the chamber. A specific flow condition is set by adjusting the ambient pressure in the vessel, the gas mass flow through the generator, and the current setting of the generator (Loehle et al. 2016a). These parameters result in repeatable heat flux and total pressure at a specified axial probe position with respect to the nozzle exit of the generator on the centerline of the plasma jet. Heat flux and total pressure are measured in separate experiments using respective probes (Loehle 2016; Loehle et al. 2016a).
During the sample testing, the fragment's front face is positioned at the same axial position of the measured heat flux and total pressure measurement. The mentioned generator parameters and the ambient pressure show that the specified condition is set, so that the fragment is facing the measured heat flux and total pressure. During start-up of the plasma wind tunnel the probe is positioned outside the flow and is not heated. When the condition is set, the probe is moved quickly to the defined position in the flow and the sample experiences the heating conditions.
The present investigation was conducted using a modified total pressure probe (Loehle et al. 2016a). The probe is the holder for a fragment to be tested. This probe is water-cooled and withstands the heat load. Usually, an interface is designed between the tested sample and the cooled holder in order to avoid cooling of the fragment. Figure 1 shows a sketch of a fragment mounted to the probe as a top view. The fragments are connected on the rear side with a copper tube to the probe. This tube is the only connection of the sample to be heated to the cooled probe. Figure 5 shows on the left a sample before testing and the copper cylinder after testing when the fragment was ablated completely.

Figure 1. Schematic view (from top) to the mounted fragment connected with a copper cylinder to the probe.
Download figure:
Standard image High-resolution imageThe chosen flow condition has been investigated extensively for ground test based analysis and characterization of the Hayabusa re-entry in 2010, which was a superorbital re-entry (Loehle et al. 2012; Hermann et al. 2016). This re-entry was also observed with instruments aboard an aircraft (Jenniskens 2010; Loehle et al. 2012). The parameters defining the condition for the present investigation are summarized in Table 1. Heat flux and total pressure have been determined in separate tests. The local heat flux is measured as a cold wall heat flux on oxidized copper with a probe diameter of 80 mm diameter (Loehle 2016). It is scaled to the present sample geometry using standard correlations and results in approximately 16 MW m−2 (ASTM International 2005).
Table 1. Plasma Wind Tunnel Condition Corresponding to the Hayabusa Re-entry at 78.8 km (Loehle et al. 2012)
| Parameter | Value |
|---|---|
Mass flow 
|
18.0 
|
| Ambient pressure p∞ | 16.6 hPa |
| Total pressure ptot | 24.3 hPa |
| Arc current I | 1220 A |
| Arc voltage U | 133 V |
| Electric power P | 162 kW |
| Probe position | x = 270 mm |
Heat flux 
|
4100 
|
| Mass-specific enthalpy h | 68.43 
|
Download table as: ASCIITypeset image
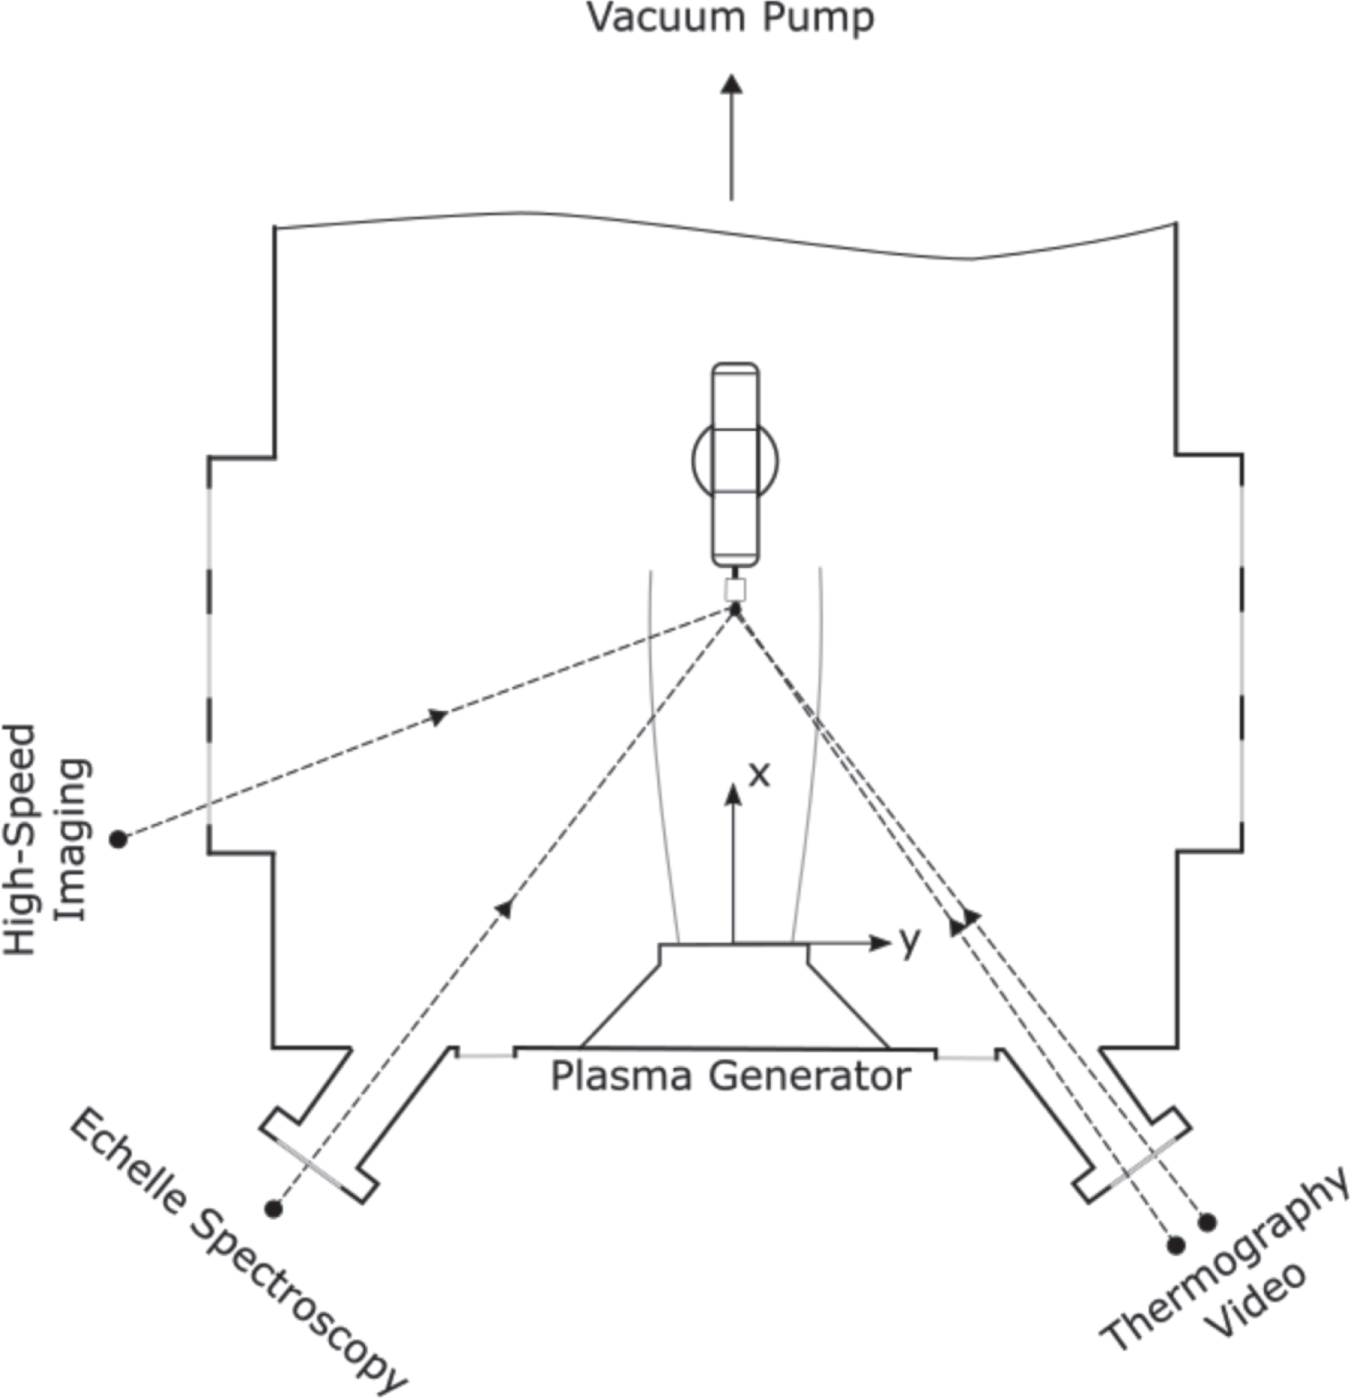
There are optical accesses available to the test section which are used to observe the fragment's behavior during testing. Figure 2 shows a top view schematic of the positioning of the five diagnostic methods applied.

Figure 2. Schematic of the arrangement of the suite of five different diagnostic setups in the wind tunnel (top view). Photos were taken from the top. Definition of the coordinate system for Table 1 is indicated.
Download figure:
Standard image High-resolution imageThe diagnostic methods were chosen in order to analyze the transient phenomenological process and spectral signature of the ablating fragment. The apparent surface temperature was observed using a thermographic video system with a frame rate up to 60 Hz, the Echelle spectrometer was used to acquire spectra between 250 and 880 nm with very short exposure times and high frame rate imaging was applied with a frame rate of 10 kHz (Zander et al. 2015; Loehle et al. 2016b). All systems acquired data simultaneously and were time correlated.
The rocks were shaped as cylinders of 10 mm in diameter and about 10 mm in length. This allows a direct comparison of the results, because all three samples experienced the same pressure and heat load. A 2 mm hole was drilled on the rear side to mount the samples with a cooled copper dowel (see e.g., Figure 8, Loehle et al. 2016a). The copper sample holder itself was water-cooled and could withstand the high heat loads indefinitely.
Testing was conducted as follows. The sample was positioned laterally outside the flow and close to the generator exit plane. This assured minimal exposure of the sample during the facility startup phase. Usually, the required test condition is reached within 3 minutes, mainly depending on the ambient pressure setup. When all parameters were steady, the sample was moved quickly to the required distance to the plasma generator (x = 270 mm) and then centrally into the flow. Moving back takes about 8 s and the lateral movement into the flow about 4 s. However, significant heating occurs only on the last 50–100 mm, which are passed in less than 2 s. The test time started (t = 0 s) when the specified test position was reached. The plasma was switched off when the meteroite fragment disintegrated, but all data acquisition continued until no more useful data could be acquired.
3. Diagnostic Methods
The following subsections introduce the details of the diagnostic methods applied.
3.1. Thermography
A commercial thermographic camera system (Lumasense Mikron MCS640) was used to measure the apparent surface temperature. The system was calibrated up to 3273 K at a fixed wavelength of 960 nm and the emissivity set in the control software prior to the experiment. The radiation was detected with a silicon detector with 640 × 480 pixels calibrated by the manufacturer against black body radiation.
For the present investigation, the emissivity was set to  for all three samples. This value has been measured for a ureilite sample (Loehle et al. 2016c). Other rocks have similar values, so we chose this value for all samples. The frame rate of the system was restricted by the computer graphics adapter to 40 fps. The measured data were corrected for window transmission losses of the vacuum chamber window (
 ). This value is a typical value for the window material at hand (BK7).
All data were stored in a proprietary video format, but could be read out after the experiment as single images for further data analysis. Tools were developed to correct the emissivity after testing and to read out particular regions of interest.
In the present analysis several regions of interest were defined in order to distinguish the useful data sets from apparent changes in emissivity of molten material. As a consequence only a small ellipse around the center spot of the sample was used for further analysis. At the beginning of a test, this ellipse is possibly smaller than the fragment, but this is sufficient to measure the apparent temperature of the fragment. The emissivity of a melting fragment is probably different from the known emissivity of the solid. This was not considered further for this initial data analysis. The drops of molten material seen downstream indicate that their actual temperature is higher or the emissivity is lower. This higher apparent temperature of the molten drops occurring further back may also be due to a lower emissivity value. Only further emissivity measurements as conducted in Loehle et al. (2016c) would give useful insight here.
3.2. High Speed Imaging
A commercially available high frame rate imaging system was used. It consists of a combination of an Optronis CR5000x2 camera and a HiCATT 18 intensifier.
The maximum resolution of the Optronis camera is 512 × 512 pixels at frame rates of up to 5 kHz. The maximum frame rate is 0.6 MHz, but at much lower pixel resolution. In the present investigation the camera was used at 10 kHz. The camera sensor has 16 × 16 μm2 size pixels with an 8-bit recording depth. The spectral sensitivity was optimized for the visible wavelength interval, i.e., between 400 nm and 700 nm. Toward the infrared, the camera sensitivity drops significantly above 1000 nm.
The image intensifier is a hyprid system composed of a Gen II followed by a Gen I intensifier. The minimum gating time is 40 ns at variable intensifier gains from 500 to 900 V. A gain of approximately 100–10,000 at a spectral sensitivity from 200 to 900 nm can be realized. Attached to the front of the intensifier was a Nikon Zoom Nikkor 28–85 mm f/3.5–4.5 lens.
This system is regularly in use to analyze the high frequency behavior of the facility and it was used to observe potentially fast occurring events with sufficient resolution (Zander et al. 2015, 2016).
3.3. Echelle Spectroscopy
The main feature of Echelle spectroscopy is the ability to acquire a comparably large wavelength interval with a comparably high wavelength resolution in a single exposure. Thus, it is the ideal candidate for optical emission spectroscopy for transient processes like the fragmentation of spacecraft during re-entry as well as for ground based plasma wind tunnel observations for the analysis of thermal and chemical non-equilibrium processes (Jenniskens et al. 2016; Loehle et al. 2016b).
An Echelle grating is a diffraction grating with around 300 l mm−1 which is used at high orders, i.e., orders 40–60. With a subsequently mounted diffraction grating with higher diffraction, using about 1000 l mm−1, the spectra of the Echelle grating are dispersed and aligned. Thus, a long wavelength range with high resolution is acquired. The drawback of this setup is its limited efficiency and often Echelle sensor boundaries result in intervals without detection for a wavelength interval of interest.
In the present investigation an Aryelle 150 spectrograph of LTB Lasertechnik Berlin was used. This particular spectrograph was tuned by the manufacturer for the application as a measurement method for airborne observations and plasma wind tunnel testing within the research group. The wavelength region covers 250–880 nm with a pixel resolution of 43 pm at the short end and 143 pm at the long wavelength end. The advantages of this Echelle system are its compact setup, the fiber fed detection optics, and short exposure times. The detector is an EMCCD with 
 pixel size and 14-bit resolution. Compared to an intensified ICCD, which is often applied for Echelle spectroscopy, this setup is robust and small.
In the current setup, a f = 100 mm lens was used to collect the radiation from the hot fragment and the plasma. A 4 mm aperture was used to reduce the field of view to only the rock. Figure 3 (left) shows the collection optics mounted to the chamber window. A two-axes translational stage and an additional rotation stage allowed fine manual alignment. Data below about 350 nm could not be acquired because of the window transmission limit. The light was collected with the lens and focused onto the fiber entrance which was connected to the spectrometer. The collection optics were mounted to one of the windows in the front lid allowing the sample surface to be viewed (see Figure 2). Sending a red laser spot inversely through the detection fiber allowed optical alignment. Figure 3 shows a red laser dot which covers the fragment. There is no red light on a piece of paper placed behind the sample, which shows that only the fragment is observed by the Echelle spectrograph.
Figure 3. Focusing lens setup (left) and spot observed by the Echelle spectrometer (right).
Download figure:
Standard image High-resolution imageThe spectra were calibrated for absolute radiance by placing a calibrated light source (Gigahertz BN102, last calibrated 2015) at the measurement location. The acquired camera signals were then directly comparable to the calibration measurements. The system was also checked for linearity with exposure time and logarithmic behavior of the amplification of the electron multiplier of the camera.
Figure 4 shows an example spectrum from the observation of the chondrite sample including the underlying black body curve and a Planck curve fit with T = 2273 K.

Figure 4. Example spectrum and the continuum background from the solid EM132 sample at T = 2273 K.
Download figure:
Standard image High-resolution image4. Results
Three different fragments were tested: a Pleistocene basalt (collected in Chanteuges, France), an Oligocene argillite (collected in SE France), and a meteorite (ordinary chondrite El Médano 132, classified as H4). Ordinary chondrites are the most common type of meteorites, amounting to 80% of the total number of meteorites that fell over the last two centuries. For the argillite and the EM132 sample all diagnostic methods performed nominally. During the basalt test, there was a software error due to which the thermography camera did not capture in time.
An essentially different ablation behavior was observed for all three fragments and three different spectral signatures were recorded. Details are described in the following subsections.
4.1. Basalt
Figure 5 shows the sample before and after testing. There is no material left after the test.

Figure 5. Basalt sample before and after test.
Download figure:
Standard image High-resolution imageThe sample started melting immediately upon insertion into the flow. The originally cylindrical shape changed very quickly into a blunt hemispherical front face. The melting semi-fluid material flowed over the probe holder and then vanished. This happened rather quickly, all material was lost in about 4 s. Figure 6 shows an image sequence of the high-speed video. The flow is coming from the left, images are taken in 2 ms intervals. It can be seen how a larger viscous drop forms (image 1) and builds a streak further to the right (image 5) before it is released and transported with the flow (images 8–10).

Figure 6. Series of images (upper left to lower right) from the high-speed video of the basalt test. Images are taken in 2 ms intervals.
Download figure:
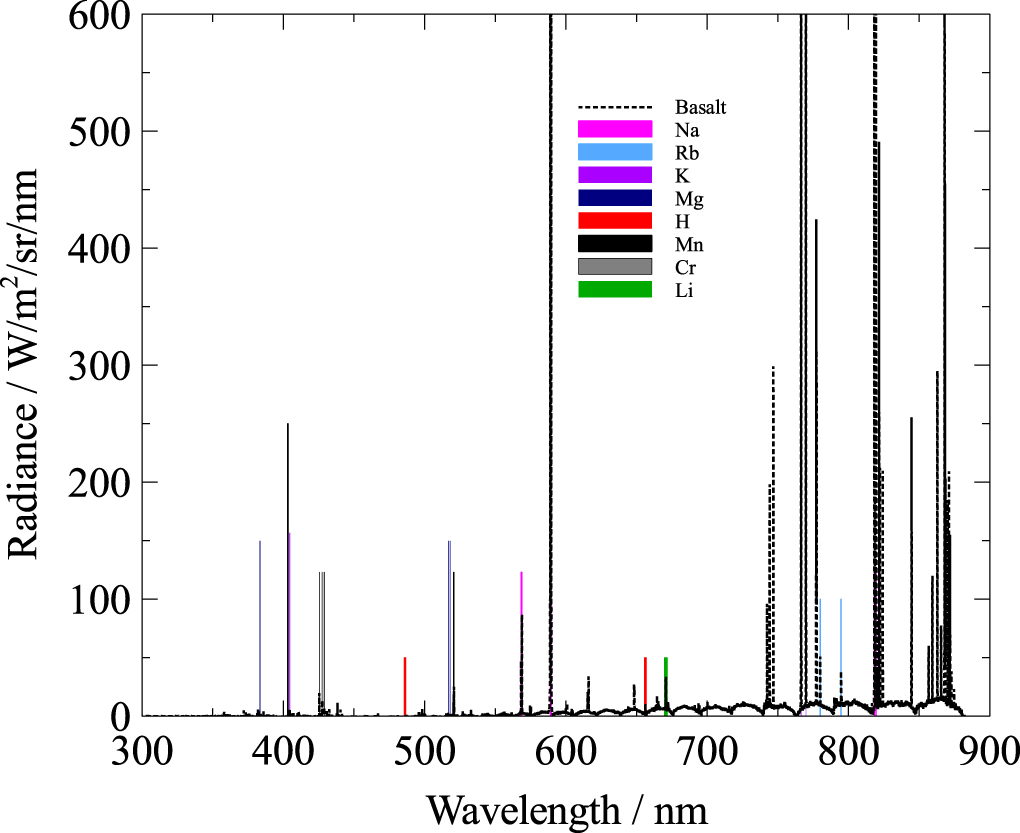
Standard image High-resolution imageFigure 7 shows an Echelle spectrum taken about 2 s after sample insertion. In the figure, the continuum background, i.e., the Planck curve, is subtracted. In the following sections, all spectral data are plotted in a similar way: the measured fragment spectrum is plotted as a dotted line. Observed atomic radiation is indicated by straight lines indicating the line position. The measured spectrum of the basalt fragment shows only atomic radiation with very intense lines from the fragment, and some oxygen and nitrogen atomic lines which are most likely linked to the plasma flow rather than to the sample.

Figure 7. Echelle spectrum of basalt.
Download figure:
Standard image High-resolution imageShepard et al. also tested a basalt sample in their study of frothening in 1967 (Shepard et al. 1967). The spectra acquired at that time had a much lower resolution. A strong sodium line (at approximately 589 nm) appears in these data sets. This line was also measured in the present campaign. In the present spectrum, strong lines of potassium, chromium, hydrogen, and iron are also measured. Furthermore, a rubidium line is identified. A weak signal of lithium at 670 nm is observed as well.
The thermographic system unfortunately failed during this experiment. The starting trigger was blocked by a software inconsistency.
4.2. Argillite
A significantly different melting mechanism was observed for the argillite sample when compared to basalt. Figure 8 shows the sample before (left) and after testing (right). The facility was stopped early enough to have some melted material left on the probe holder. Although the cylindrical shape changed as quickly as during the test with the basalt sample, the behavior was very different. Small drops of apparently melted material were released at the surface and seemed to be blown further downstream. Figure 10 shows this in a series of images from the high-speed video. Interestingly, the images shown in this series are with a time interval of 1.5 ms. This shows that even though the processes seem similar for both argillite and basalt, they happen significantly faster for the argillite sample. It can also be seen that on the lower side of the fragment, melted material begins to be released (images 8–10). The argillite sample is very fragile and has a high porosity, thus it seems as if the incoming hot gas flow causes quicker material release at the surface of the sample than with the basalt sample. The video data show that these bubbles were liquid and were blown around the probe holder. After the test some streaks are still seen on the probe holder (see Figure 8). In Figure 9 the photo on the left side shows the small bubbles at the surface of the already rounded argillite sample. The apparently strange distribution of the plasma around the fragment is an artifact from the very short exposure time (1/8000 s). The high flow velocity and the camera chip orientation result in an effect called rolling shutter. The sample reached approximately the same apparent temperature of about 1900 K.
Figure 8. Argillite sample before and after test.
Download figure:
Standard image High-resolution image
Figure 9. Argillite: photograph from the test (left) and apparent surface temperature (right).
Download figure:
Standard image High-resolution image
Figure 10. Series of images from the high-speed video from the argillite test. Images are taken in 1.5 ms intervals.
Download figure:
Standard image High-resolution imageThe argillite spectrum is plotted in Figure 11. The main feature which shows up compared to the other samples is the molecular band emission of CN in the UV wavelength interval shown in Figure 11 as an insert and separately in Figure 12. This is due to the presence of carbon (some carbon lines are also visible) and its recombination with atomic nitrogen of the flow field. A synthetic spectrum using the Parade database was fitted to this band. The comparison is shown in Figure 12. The resulting vibrational and rotational temperatures are  K and
K and  K, respectively. The Parade software is a tool developed for the European Space Agency for the calculation of the radiation of emission lines of atoms and molecules (Liebhart et al. 2012). The continuum background, i.e., the Planck curve, was subtracted for clarity. The free stream temperature of this flow condition for molecular nitrogen is
  K and
K and  K (Hermann et al. 2017). This clearly shows that the boundary layer species exhibit significantly lower temperatures due to the cooling effect of ablation. This effect is expected in flight and leads to the relatively low excitation temperatures reported by Vojáček et al. (2015). This indicates, from a data analysis point of view and comparison to flight data, that the plasma wind tunnel flow is suitable for the experimental simulation of the meteor flight scenario.

Figure 11. Echelle spectrum of argillite.
Download figure:
Standard image High-resolution image
Figure 12. Echelle spectrum analysis of argillite: CN,  K,
K,  K.
K.
Download figure:
Standard image High-resolution image4.3. Ordinary Chondrite
The EM132 sample is a fragment of the El Medano 132 meteorite, an H4 ordinary chondrite. Figure 13 shows photographs from before and after testing. The material melted with obviously higher viscosity. Toward the end of the test (again roughly 4 s), some material ended up smeared over the probe holder (see Figure 15 left). This effect looks very similar to what Allen named frothening of the meteorite material (Allen & Baldwin 1967) and it is similar to the behavior of the basalt sample. The essential difference is that for the EM132 sample this happened much faster. The high-speed frames shown in Figure 14 are taken with 0.2 ms intervals. The intensifier setup was not perfect for this test, so that the images are a bit dark. In the video data, it is also seen that there are small pieces coming off the surface which stick to the probe holder. Whether these pieces are melted or not is unclear. The EM132 sample reached the highest apparent surface temperature of 2400 K .

Figure 13. EM132 sample before and after testing.
Download figure:
Standard image High-resolution image
Figure 14. Series of images from the high-speed video of the EM132 test. Images are taken in 0.2 ms intervals.
Download figure:
Standard image High-resolution image
Figure 15. EM132: photography from the test (left) and apparent surface temperature (right).
Download figure:
Standard image High-resolution imageThe spectrum (see Figure 16) shows features expected for an ordinary chondrite with lots of iron lines, together with silicon, sodium, potassium, and manganese. In the figure, the continuum background, i.e., the Planck curve, is subtracted. As in the other tests, the atomic lines of nitrogen and oxygen appear. These are most likely from the air plasma inflow rather than from the meteorite fragment itself.

Figure 16. Echelle spectrum of ordinary chondrite and comparison to an observed meteor spectrum from Vojáček et al. (2015).
Download figure:
Standard image High-resolution image5. Comparison
The thermographic data sets and the surface temperature evaluation from the Echelle data are compared in Figure 17. As mentioned above, in the Echelle data sets a clear continuum background is observed. This is used to determine a surface radiation temperature using the Planck formula. Figure 17 shows the temperature over the test time. The Echelle data were shifted to fit to the timing of the thermographic data sets. However, there is still a discrepancy between the two measurements, which is related to an unknown frame rate delay in the thermographic system. The overall trend of the data evaluated from the Echelle and the thermographic image is similar. The discrepancy between the absolute values is probably due to the emissivity difference of the sample. For the present investigation the emissivity was set to  which is an experimentally determined value for a urelite sample (Loehle et al. 2016c). The increase in temperature determined from the Echelle data for the EM132 sample is most probably due to the continuously decreasing size of the sample which results in the detection of not only the sample, but also hot plasma. This hot plasma results in a higher apparent temperature.

Figure 17. Surface temperature evaluated from Planck background radiation in Echelle spectra.
Download figure:
Standard image High-resolution image
Comparing the three different spectra, a clear distinction between fragment types is possible based on ony the emission spectroscopic data. Although different materials were already tested by Shepard et al. (1967), this comparison was not published and possibly was not feasible with the experimental equipment at that time. The experimental setup of the present investigation features higher spectral resolution at higher frame rates and is therefore very well suited to investigate the spectral features of different materials in further detail. For the first time, clearly distinguishable spectra for different representative materials in a flight representative scenario are presented.
The Echelle spectrum of the chondrite fragment is shown in Figure 13. Additionally an observed spectrum from a typical asteroidal-chondritic orbit is reproduced from observation data published by Vojáček et al. (2015). The continuum background is subtracted for clarity. The two spectra agree fairly well. Especially below 700 nm the spectrum of the EM132 sample is well comparable to the Vojacek spectrum. There are different peaks in the observed data which can be associated to iron lines and also a strong sodium peak was observed during meteor entry. The resolution of the observation is much lower than the Echelle spectroscopic data from wind tunnel testing. This is due to the simple observation system which consisted of a Mullard image intensifier, a simple S-VHS-C camcorder, and a 600 l mm−1 transmission grating. At around 850 nm the observation data drop.
This spectral data confirm that the spectral signature measured in the ground testing facility is clearly connected to the material type and can be compared very well to observation data. Additional testing with more meteorite fragments will allow further identification of meteorite entries based on their spectral signature. Furthermore, the high spectral resolution allows for a detailed comparison between experiment and predictive tools, such as meteoritic ablation models.
6. Conclusion
The present investigation of two terrestrial rocks and a stony meteorite shows the behavior of such materials at flight comparable conditions in a ground testing facility for the first time. Thermographic imaging, high-speed videos, and Echelle spectra in the wavelength interval 350–880 nm lead to the conclusion that the ablation process in the ground test is well comparable to what is understood from observational data.
The successful testing shows clear differences: the fragmentation process varies between the materials. The brittle fragment shows droplets at the surface, whereas the denser materials melt as expected. The spectroscopic data show that the meteorite fragments can clearly be distinguished for the different materials. Each fragment features a clear spectral signature. The identified lines fit well to observed data.
Therefore, the data of this study can be used to further analyze meteor entries by comparing ground testing with known materials to spectra measured from observations. Eventually this will allow conclusions to be made concerning meteoritic origin. Thus, the analysis of the ablation of meteoritic material in a high enthalpy air plasma flow of a ground testing facility can support potential answers to some fundamental questions of the Earth's astrochemical heritage.
The IRS team gratefully acknowledges the support of the mechanical workshop in repairing the probes very quickly and adapting the sample holders very carefully to fragile fragments. Furthermore, we thank Emanuel Pismiok who designed the Echelle lens system during his Bachelor thesis and participated in data acquisition. We also would like to thank the reviewers for very valuable comments especially on a useful plotting representation of the data.