


Abstract
The next generation Very Large Array (ngVLA) will be the premiere centimeter-wave radio array in the Northern Hemisphere by the mid 2030s and thus has the potential to be one of the most effective instruments for the search for extraterrestrial intelligence (SETI). We show that, as of now, the ngVLA will be the only facility capable of detecting an extraterrestrial intelligence (ETI) signal generated by an Arecibo-like transmitter further than 300 pc. We present the optimal antenna array configurations and study the proposed frequency band coverage of the ngVLA and its implications to SETI. We argue for the ability to form of the order of 64 commensal high spectral resolution beams, as the large number of line of sights is critical to provide a competitive survey speed when compared to other modern surveys with telescopes such as MeerKAT and the future SKA. We advocate an Ethernet-based telescope architecture design for the ngVLA, which will provide a high degree of flexibility in SETI data analysis and will benefit the wider astronomy community through commensal science and open-source code, maximizing the potential scientific output of the ngVLA.
Export citation and abstract BibTeX RIS

Original content from this work may be used under the terms of the Creative Commons Attribution 4.0 licence. Any further distribution of this work must maintain attribution to the author(s) and the title of the work, journal citation and DOI.
1. Introduction
The search for extraterrestrial intelligence (SETI) is a subfield of astrobiology concerned with the pursuit of observables that constrain the presence of intelligent life in the universe. Current efforts are focused on the detection of technosignatures—signs of non-human technology—whether intentionally or unintentionally transmitted by some intelligent form of life that is not our own. From its earliest conception in the 1960s, SETI research has been conducted primarily in the radio domain. Cocconi & Morrison (1959) first argued that one of our best chances of successfully detecting any extraterrestrial intelligence (ETI) lies in radio emissions. Still today, radio searches are a good choice as a means of ETI detection from both a practical and a purely scientific point of view, as laid out in the "Nine Axes of Merit for Technosignature Searches" (Sheikh 2020), an analytical framework developed to assess the merits of any given SETI survey.
Electromagnetic radiation in the radio part of the spectrum remains a competitive strategy for information transfer over interstellar space. Unlike higher-frequency electromagnetic radiation, radio is not attenuated by dust extinction between us and any potential ETI. Radio receivers and transmitters, such as those developed here on Earth even before the age of space exploration, could also be easily within the engineering capabilities of any similarly advanced society. It is not unreasonable to assume that another technologically advanced civilization might arrive at the same conclusions as we have about the possibilities of the detection and/or transmission of radio waves over long distances. In terms of the scientific nature of the potential discovery of a radio technosignature, there are further advantages. An intentional communicative radio transmission offers the unquestionably exciting advantage that, assuming we can decode such a signal, it will unambiguously answer the question of whether or not ETIs exist. It also requires no theorized extrapolation from current known technology or understanding of the laws of physics. Such a search runs the risk, however, of making potentially unfounded sociological assumptions about the nature of the extraterrestrial civilization in question, as it assumes a definite motivation for communication; see, e.g., Wright (2021).
From a practical standpoint, radio SETI is favored for its cost efficiency. Costs can be kept relatively low through commensal observation: piggybacking on telescope time without interfering with other projects running concurrently. The first example of commensal SETI dates back to the SERENDIP project (Bowyer et al. 1983), where a spectrum analyzer tapped into a split stream of intermediate-frequency band at the Hat Creek Radio Observatory. Further, upgraded versions of SERENDIP were then deployed on Arecibo and the Green Bank Observatories (see, e.g., Chennamangalam et al. 2017). Commensal observing arrangements are beneficial for the observatory in general, for instance in terms of telescope usage efficiency and scientific output. Any data gathered could also have ancillary benefits to other areas of astrophysical research such as the advances made by the Breakthrough Listen (BL) Initiative. For example, fast radio bursts (FRBs) have been detected using both the BL digital backend at Green Bank (Gajjar et al. 2018; Michilli et al. 2018; Zhang et al. 2018) and during BL observations at Parkes (Price et al. 2019). It is well within our current technological capabilities, and without undue strain on available resources, to detect a radio signal from an ETI, if such a signal exists. It is one thing to find nothing because there is nothing there, but it is quite another thing, even from a purely objective standpoint, to find nothing because we did not look. As Cocconi & Morrison (1959) concluded: "The probability of success is difficult to estimate; but if we never search, the chance of success is zero."
What exactly is the radio ETI signal for which we are looking? Given that no convincing ETI detection has been made thus far, we do not definitively know the morphology and characteristics that might define a radio ETI signal. However, we can make an educated guess of what a potential ETI signal might look like by taking inspiration from human-made technosignatures observed in space. Figure 5 in Lebofsky et al. (2019) shows the signal of the Voyager spacecraft as detected by the Green Bank Telescope. This specific Voyager signal has a drift rate of 0.36 Hz s−1, and is extremely narrow in spectrum. Human-made technology has frequently used filters to concentrate information in a narrow region of the spectrum, whereas astrophysical emissions tend to be a lot broader in bandwidth. Siemion et al. (2013) pointed out that emission no more than a few Hz in spectral width is an unmistakable indicator of engineering by an intelligent civilization, while only a fraction of a Hz worth of broadening is expected from interstellar and interplanetary media. In order to detect narrow technosignatures like this, sensitive SETI projects require very high spectral resolution: the collected data must have frequency bins on the order of 1 Hz. Another characteristic of the Voyager signal is the drift in its frequency over time as observed from an Earthbound receiver. This Doppler drift arises due to the relative acceleration between the receiver on Earth and the transmitter from space. In contrast, a stationary signal generated by human technology on the Earth's surface would not have any differential drift rate. Thus far, the mainstream algorithm employed to search for these narrowband drifting signals involve the use of the "tree de-Doppler" technique (Siemion et al. 2013; Enriquez et al. 2017; Enriquez & Price 2019).
Multiple larger-scale radio telescope projects are expected to come online in the next decade, which present exciting opportunities for SETI. Notably, the next generation Very Large Array (ngVLA; Murphy 2018) is going to be the premiere centimeter-wave radio array in the Northern Hemisphere and will improve by more than an order of magnitude the sensitivity and spatial resolution over the current Jansky VLA (JVLA) and the Atacama Large Millimeter/submillimeter Array (ALMA) at the same wavelengths. Here we assume that the main SETI strategy on these telescopes is to maximize the number of stars monitored using beam-formed data. Although going forward, one can look into the possibility of technosignatures unassociated with stars, for example in interstellar space. In this work, we present the results of studies into how the ngVLA can optimally perform SETI by maximizing the number of stars targeted. We analyze the antenna configuration (Section 2.2), compare different operational modes (Section 2.3), and study various beamformer capabilities offered by the ngVLA (Section 2.4). We present the target-selection considerations in Section 2.5 and quantify the sensitivity of SETI with the ngVLA in Section 2.6. We argue for the need of an Ethernet-based telescope architecture in Section 2.7. In Section 3, we summarize the optimal SETI design for the ngVLA and propose indicative systems engineering design requirements that would enable these if adopted by the ngVLA.
2. The ngVLA
2.1. Overview
The ngVLA is a proposed radio interferometer in the frequency range 1.2–116 GHz led by the National Radio Astronomy Observatory (NRAO). It will be the Northern Hemisphere counterpart to the Square Kilometer Array (SKA; ≲50 GHz) and the Atacama Large Millimeter Array (ALMA; ≳50 GHz) in the South. The ngVLA will provide 10 times the collecting area of the JVLA (Murphy 2018) as well as an order of magnitude improvement on current observing capabilities in terms of both sensitivity and angular resolution. The ngVLA is a research infrastructure project strongly endorsed by the Astronomy and Astrophysics Decadal Survey (Astro2020) of the U.S. National Academy of Sciences. It will replace the JVLA as the U.S. flagship radio observatory by the mid 2030s when commissioning is planned to be completed. As noted by Murphy (2018), the five key science goals of the ngVLA include (1) unveiling the formation of solar system analogs on terrestrial scales, (2) probing the initial conditions for planetary systems and life with astrochemistry, (3) charting the assembly, structure, and evolution of galaxies from the first billion years to the present, (4) using pulsars in the Galactic Center to test gravity theories, and (5) understanding the formation and evolution of stellar and supermassive black holes in the era of multi-messenger astronomy. SETI research has implications for both (1) and (2), but could also be considered a key science goal on its own, making it relevant to the science strategy of the ngVLA.
2.2. Antenna Configuration
Currently, the ngVLA antennas are not planned to be configurable like the VLA which means that the ngVLA antennas will need to be located in a wide range of physical distances to sample fully various angular scales required by the diverse science goals. See Figure 1 for a visualization of the radial extent of the ngVLA dishes, based on the latest antenna configuration (Rev. D) provided by C. Carilli (2022, private communication). This up-to-date array layout can be found on the ngVLA website. 7 At the time of writing, the ngVLA is designed to have 244 18 m antennas as well as 19 6 m antennas (Selina et al. 2018). We created an interactive Google map of the positions of all the ngVLA antennas which can be found at this link. 8 In summary, the ngVLA array is divided into three sub-arrays. First, the Short Baseline Array (SBA) is composed of all the 6 m dishes and is contained entirely within the array core, approximately 1 km from the array center. Second, the Main Array (MA) is the main interferometric array and is made up of 214 18 m antennas. It can be further divided into three parts: the core consists of 114 antennas in a semi-random distribution within an approximately 2.2 km radius; the spiral sub-array consists of 54 antennas extending from the core in a five-armed spiral up to 20 km from the array center; and the mid-baseline array consists of the remaining 46 antennas in five arms extending to the south of the core with baselines from 30 to 700 km. Finally, further to the MA, there is the Long Baseline Array (LBA), consisting of 30 18 m antennas located at stations on a continental scale, in Hawaii, Washington, California, Iowa, West Virginia, New Hampshire, Puerto Rico, the US Virgin Islands, and Canada.

Figure 1. The size of the ngVLA array with respect to the number of antenna dishes. The reference antenna is taken to be that of the central antenna among the core array. The distance is calculated by taking the absolute distance from the (x, y, z) antenna coordinates.
Download figure:
Standard image High-resolution imageFor SETI, having a dense configuration of antennas toward the center is more desirable than including the very long baselines of the LBA, assuming we prioritize a larger field of view over high sensitivity of localized areas. While the telescope sensitivity, defined as the effective area (Aeff) over the system temperature (Tsys), does increase with an increasing number of antennas (see Figure 2), including long baseline antennas will reduce the synthesized beam size and thus lower the sky coverage. In Figure 3, we plot the SETI survey speed against the distances of antennas from the array's center, where the survey speed is calculated as the field of view multiplied by the gain to the power of  , as suggested by Equation (36) in Houston et al. (2021), given that the ETI signals we are after are not broadband by definition. We can see that the ngVLA SETI survey speed is best when using antennas within about 1 km from the core. At its most compact configuration D, the VLA has the largest beam size and thus systematically results in better a survey speed according to this calculation.

Figure 2. The sensitivity (y-axis) of ngVLA as compared to the SKA and MeerKAT, adapted from the top panel of Figure 2 in Keane (2018). Three different curves for the ngVLA performance are shown, corresponding to using only 114 dishes from the core, 214 dishes from the MA, and 263 dishes from the full array. Three curves for the SKA1 are shown, corresponding to sub-arrays of diameter 1 km, 20 km and the full array (Braun et al. 2019). The ngVLA demonstrates the best sensitivity at high observing frequencies in all three antenna configurations shown.
Download figure:
Standard image High-resolution image
Figure 3. Survey speed Figure of Merit (FoM) plots comparing ngVLA to the VLA A and D configurations, SKA-Mid, MeerKAT, and ALMA in each of its bands as a function of the antenna distances from the array center. The ALMA Tsys is obtained from Figure 4.7 in the ALMA Cycle 7 Technical Handbook (Remijan et al. 2019), where we assume a precipitable water vapor (PWV) of 6 mm to match the ngVLA data. Aeff has been obtained from ALMA Memo 602 and the antenna configuration from the online CASA simulatora (https://almascience.nrao.edu/tools/casa-simulator). For the ngVLA and the SKA, these parameters can be found in our sensitivity calculatorb (https://github.com/evanocathain/ngVLA/blob/main/Sensitivity/functions.py). We use 64 SETI beams for the VLA and MeerKAT as suggested by Ng (2021) and Czech et al. (2021). For the ngVLA and the SKA, we include a curve with the same number of SETI beams for comparison. We also include a curve for 10 and 100 beams for the ngVLA, as these are potential scenarios as mentioned in Section 2.4. Note that the y-axis range is different in each panel to optimize each specific value range.
Download figure:
Standard image High-resolution image2.3. ngVLA Operational Model
NRAO has released an Envelope Observing Program (EOP) 9 (Wrobel et al. 2020), a notional prediction of how the community might use the ngVLA during a typical year of full science operations. Based on the EOP, we show in Figure 4 the fraction of time ngVLA will spend observing with each of its six receivers. A relatively high fraction of time will be devoted to the higher-frequency receivers, with the 93 GHz receiver being the most frequently used. For comparison, we also studied the historic usage of the VLA between 2015 and 2019 inclusively. This observation log has been obtained through processing of the META data associated with the commensal 340 MHz VLA Low-band Ionospheric and Transient Experiment (VLITE; Clarke et al. 2016). Note that the JVLA only goes up to 50 GHz and the receiver band ranges are not exactly the same between ngVLA and the VLA for a direct comparison. Overall, we observe that the VLA spent more time at the lower-frequency bands between 2015 and 2019 than what is proposed for the ngVLA.
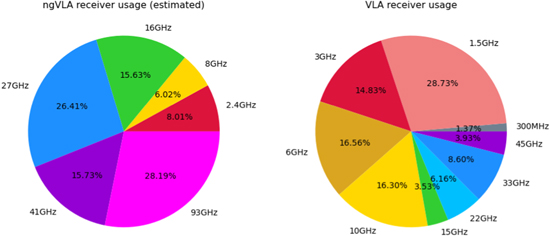
Figure 4. Comparison of (left) estimated ngVLA and (right) historical VLA receiver fractional usage time. We have used similar colors for receivers at comparable observing frequencies.
Download figure:
Standard image High-resolution imageAssuming a commensal SETI observing strategy, Figure 4 gives us an idea of the frequency ranges of ETI transmissions we will be able to probe using the ngVLA. About one third of the time, the ngVLA will be observing at frequencies below 16 GHz, which overlaps with the so-called "terrestrial microwave window" (TMW). The TMW is the spectral region between 1 and 10 GHz identified as an ideal band for SETI by Morrison et al. (1977) due to the relatively low natural noise between the galactic synchrotron background (<1 GHz) and the emission and absorption by water and oxygen in the Earth's atmosphere (>10 GHz).
The remaining two thirds of the time the ngVLA will be observing in high-frequency windows. In Figure 5, we plot the solid angle of the sky coverage versus the observing frequency for notable SETI surveys that were conducted in the past, are ongoing, or are planned for the future. The sky coverage is calculated by multiplying the primary beam size with the number of pointings for a given observing frequency band. For reference, the whole sky represents a total solid angle of 41,253 deg2. For the VLA, we use the exact number of pointings recorded during the five-year time span between 2015–2019. For the ngVLA, we assume the same number of pointings. Due to the large fraction of time the ngVLA will spend at high observing frequencies, SETI with the ngVLA will provide the best sky coverage from about 8 GHz upwards. The ngVLA will also observe in the ∼100 GHz window which has never been studied for ETI signals. In this sense, the ngVLA provides us with an opportunity to probe new, high-frequency ranges where ETI signals could potentially be found. Indeed it has been suggested that ETIs might actually prefer to transmit in higher frequencies due to minimal scattering by interstellar and interplanetary plasma (Benford et al. 2010). Although as pointed out earlier, our Earth's atmosphere does make detection more challenging. Also, higher observing frequencies equate to a smaller synthesized beam size and hence an overall slower survey speed (compare across the six panels in Figure 3), which is another disadvantage when it comes to mapping the largest sky coverage.
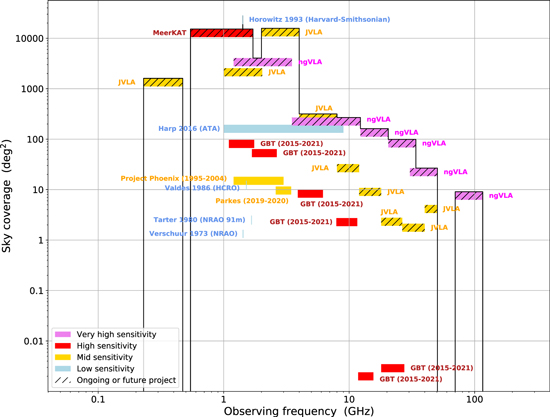
Figure 5. The sky coverage vs. observing frequency for previous, ongoing, and proposed SETI surveys. Each project is color-coded by one of four levels of sensitivity that show how far from Earth we can detect an Arecibo-like (1013 W) transmitter signal , where d* ≤ 25 pc is low sensitivity (light blue), d* ≤ 75 pc is mid sensitivity (yellow), d* ≤ 250 pc is high sensitivity (red), and anything above is very high sensitivity (purple). A SETI project with the ngVLA will span one of the largest sky coverages and observing bandwidths, while providing very high sensitivity capable of detecting an Arecibo-like transmitter beyond 250 pc from Earth.
Download figure:
Standard image High-resolution imageOther notable spectral windows have been proposed for targeted SETI research. For example, the "water hole"—the band contained between the 1.420 GHz hydrogen line and the 1.667 GHz hydroxyl line—could be a quieter window in the radio spectrum and thus desirable for SETI surveys. Many hopeful SETI efforts focused on this bandwidth, anticipating that an extraterrestrial civilization would recognize the significance and universality of water's ions and deliberately use this frequency space to transmit a signal to other intelligent life. This frequency range will be covered by the ngVLA 2.4 GHz receiver, which spans a bandwidth between 1.2 and 3.5 GHz. Note that the 2.4 GHz receiver is only expected to be used about 8% of the time, so it would not provide a significant amount of data in the "water hole" spectrum.
To understand the survey completeness we can achieve with the ngVLA better, another useful operational parameter to consider is the overall up-time of the telescope. While we will not have a concrete number until ngVLA comes online, we can again look into historical data from the VLA to get a handle on what we might be able to expect for the ngVLA. According to Figure 6, the VLA had an averaged up-time of 17.4 hr per day in 2015, which is about 70%. A similar trend is observed in 2016–2019. This is comparable to most other radio observatories and we do not observe any particular weekly or monthly pattern. We also looked into the cumulative pointing durations per unique source with the VLA. From Figure 7, we can see that many of the pointings are quite short and last for only tens of seconds (a hundredth of an hour). These shorter pointings could be associated with calibration or test scans; if we were to exclude these, we might expect typical dwell times to be on the order of a few minutes. The colored lines show the break-down distribution for each different year and overall the pattern is quite similar year to year. Assuming ETI signals are persistent transmissions and do not consist of discrete bursts, a short pointing duration is undesirable to SETI as it translates to a reduction in the signal-to-noise ratio that is proportional to the square root of the integration time, as prescribed by the radiometer equation. For reference, other BL projects such as SETI with the Green Bank, Parkes, or MeerKAT all have a minimum integration time of 5 minutes (Enriquez et al. 2017; Price et al. 2020; Czech et al. 2021). A caveat, however, is that short pointings potentially means higher sky coverage, giving us more targets to monitor.
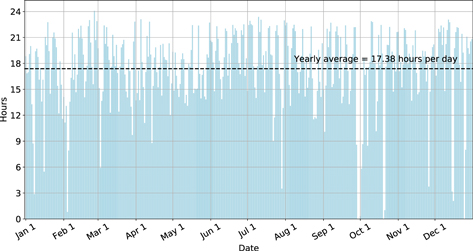
Figure 6. Observation time with the VLA in the year 2015. The yearly average of 17.38 hr per day is indicated by the dashed black line.
Download figure:
Standard image High-resolution image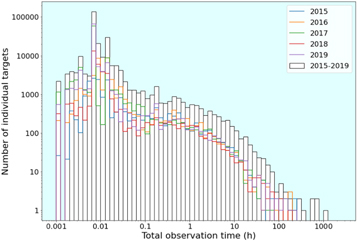
Figure 7. Observation time per individual target for all receivers on the VLA.
Download figure:
Standard image High-resolution image2.4. ngVLA Beamformer
The ngVLA Correlator and Beamformer (CBF) consists of two parts, the Very Coarse Channelizer (VCC) and the Frequency Slice Processors (FSPs). VCC splits the wideband input streams into narrower oversampled signals (sub-bands) called "frequency slices." The coarse channelization at the VCC is computed using a polyphase filterbank and is the same for all observing modes (OMs). Subsequently, the FSPs independently process these frequency slides. The same frequency slice can be processed simultaneously by two different trident compilers (Rupen et al. 2019) in the case of commensal observing with multiple OMs. At the time of writing, the planned ngVLA function OMs include correlation, very long baseline interferometry (VLBI), and pulsar beamforming (Ojeda et al. 2019). Two pulsar beamformer modes have been discussed, including an offline pulsar search OM and a pulsar timing OM. The pulsar search mode involves the use of phase-delay beamforming to form a larger number of beams. The delay is only truly compensated at boresight, while narrowband phase-delay approximations are used to synthesize beams toward other offset directions within 0 5 from the boresight. The beamforming aperture diameter is restricted to about 40 km from the core. Each beam will have a bandwidth of up to 8.8 GHz, which is the width of the widest receiver (Band 2). The ngVLA Reference Observing Program (ROF) explicitly specifies only 10 pulsar search beams, although of the order of 100 beams are required to cover the Galactic Center through hexagonal packing and it is possible that a larger number of beams will be supported in the future.
The pulsar timing beams are voltage beams and are true-delay beam-formed where Jones matrix corrections are applied per antenna. In Carlson & Pleasance (2018), it is stated that when using the "Sparse config," up to four beams can be generated per sub-array. The total beams × bandwidth product is 4 beams/FSP × 50 FSPs × 200 MHz/FS = 40 GHz. This is applicable to the full array with any number of antennas and any aperture size. In principle, we can trade off a smaller bandwidth in order to form more coherent beams. For example, 50 coherent beams can be formed at 0.8 GHz beam−1. Alternatively, the "Dense config" allows for 10 beams/FSP × 50 FSPs × 200 MHz/FS = 100 GHz, which means 50 beams at 2 GHz beam−1 can be formed. However, only a maximum of 144 antennas can be included in this configuration. In addition to these theoretical limits, the current technical requirements of the ngVLA central signal processor commits to a maximum of 10 pulsar timing beams with a maximum bandwidth of 8.8 GHz per beam (Ojeda et al. 2019). The goal of 50 beams is desired for globular clusters, but this is not currently required. A post-beamformer channelizer of up to 4k is possible, resulting in frequency resolution of the order of MHz.
For SETI, ideally we would need a new OM that is similar to the offline pulsar search mode with a much finer post-beamformer channelizer that provides formed beams with Hertz-wide channels. The large number of beams enabled by this enhanced offline pulsar mode is highly desirable for SETI as it increases our survey speed. From Figure 3, it can be seen that having 100 ngVLA SETI beams will provide comparable survey speed to SKA-Mid. The fact that only antennas closest to the core can be incorporated is not an issue for SETI but rather a positive point, as discussed in Section 2.2, as the ngVLA survey speed peaks when using antennas within about 1 km from the array center. As stated in Section 1, Hertz-wide frequency resolution is typically required for SETI. In terms of the number of floating-point operations per second (flops) associated with the upchannelization operation, it scales with the length of the fine-channelization fast Fourier transform, the number of polarizations, coarse-frequency channels, antennas, and the frequency resolution, which in theory will take on the order of several hundred Gflops per computer node based on the architecture of a 64-node computer cluster. Alternatively, SETI might be able to make use of the "Dense config" pulsar timing beams as is. We will however need to include a third-stage channelizer in the downstream SETI engine to channelizer the beams further to Hertz-wide resolution. The downside of piggybacking on the pulsar timing beams is the reduced survey speed. With only 10 beams, SETI on the ngVLA will be significantly slower than the ongoing MeerKAT SETI project which has 64 commensal SETI beams (Czech et al. 2021). SETI would also be interested in analyzing incoherently formed beams which provide (reduced) sensitivity on the entire primary field of view. This might again require a new OM but should be relatively computationally inexpensive to produce.
2.5. Target Selection
No technical memo is available at this stage regarding the predicted source scheduling on the ngVLA. The main SETI strategy on the ngVLA is to maximize the number of stars monitored via 24/7 commensal observing. For example, we can make use of the 32 million star catalog curated by Czech et al. (2021) to form a database, from which we can on-the-fly decide where to steer the SETI beams to point to stars within the primary field of view of the ngVLA. To first order, our priority is to observe stars based on their distances since, for a given transmitter power, closer targets will be more detectable. This target-selection idea is based on the requirement that we have access to dedicated SETI beams. In the case that we piggyback to analyze the pulsar timing beams for example, then we would not have the luxury to choose where the beams are pointed. That is another downside of using the pulsar timing beams for SETI; pulsar timing requires a subset of pulsars be monitored regularly, implying that the beams would be regularly returning to the same field of view instead of covering a large area of sky. We would, however, be able to set very stringent limits on the presence of ETI signals in those specific lines of sight.
Other than covering the widest possible sky, there are regions of the galaxy that could be of greater interest to SETI and obtaining commensal observing time on those pointings would be of high priority. Morrison & Gowanlock (2014) proposed the idea of a "galactic habitable zone" (GHZ), a region around the Galactic Plane about 60° longitude and 30° latitude where they considered particularly attractive for extraterrestrial civilizations. Specifically, the line of sight toward the Galactic Center has the largest integrated stellar density and could be a strategic place to conduct SETI (Gajjar et al. 2021). Commensal time with the ngVLA Galactic Center pulsar search project (KSG4) is thus valuable to SETI. The Earth Transit Zone (ETZ) is another potential SETI Schelling Point (Wright 2020), which describes a region bracketing the ecliptic from which ETI would be able to observe our Earth transiting in front of the Sun (Kaltenegger & Pepper 2020).
2.6. SETI Sensitivity
The ngVLA will complement SKA1-Low and SKA1-Mid as the only facilities with the capability to detect "leakage" transmissions from omnidirectional transmitters with power close to the brightest transmitters on Earth (Siemion et al. 2015; Croft et al. 2018). Here we attempt to quantify further the performance and expected survey sensitivity of SETI with the ngVLA. The Arecibo radio telescope, before it was irreparably damaged in 2021, was the most powerful planetary radar on Earth, capable of transmitting a pseudo-luminosity or an equivalent isotropic radiated power (EIRP) of 1013 W, as quoted by Enriquez et al. (2017). This is typically taken as a reference point of the strength of ETI signal we can expect. Assuming an Arecibo-like transmitter that emits a 1 Hz-wide signal, based on the minimal detectable flux ( ) of a given telescope facility, we can work out the maximum distance (d*) the telescope can detect the hypothetical ETI signal, where
  . In Figure 5, we classify the SETI survey sensitivity into four tiers, depending on how far the search could detect a 1 Hz-wide signal with the EIRP of Arecibo, where d* ≤ 25 pc is low sensitivity (light blue), d* ≤ 75 pc is mid sensitivity (yellow), d* ≤ 250 pc is high sensitivity (red), and anything above is very high sensitivity (purple). This plot demonstrates how more recent and future searches are generally greater in extent and in sensitivity. The ngVLA stands out for its superior sensitivity and its ability to search higher radio frequencies better. Figure 8 is a slightly different visualization which directly compares the sky coverage as a function of minimum detectable flux (top horizontal axis) and the maximum distance (bottom horizontal axis) for the detection of a 1 Hz-wide Arecibo-like signal. ngVLA's most sensitive receiver (8 GHz receiver) would have the ability to detect an ETI signal as far as just over 300 pc away. Considering our own galactic disk is over 30 kpc in diameter, even our most ambitious search cannot yet look beyond our immediate neighborhood for civilizations emitting signals similar to our own.
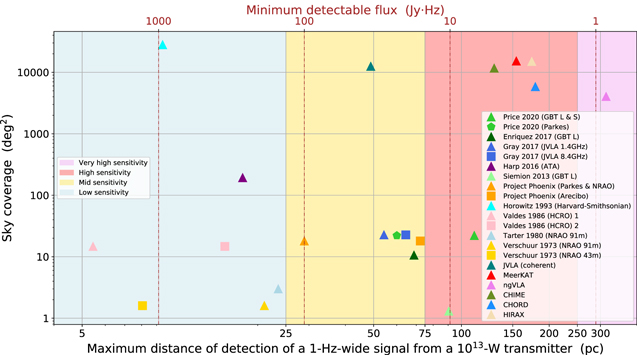
Figure 8. The sky coverage vs. maximum distance of detection of an Arecibo-like transmitter. We obtain the parameters for other SETI projects from Enriquez et al. (2017). We categorize four levels of SETI sensitivity based on the maximum possible detection distance on the bottom x-axis, with ≤25 pc being low sensitivity (light blue), ≤75 pc being mid sensitivity (yellow), ≤250 pc being high sensitivity (red), and anything above being very high sensitivity (purple). The ngVLA is the only SETI project that can detect an Arecibo-like transmitter beyond 250 pc.
Download figure:
Standard image High-resolution imageFurthermore, we follow the recipes of Enriquez et al. (2017) to derive the EIRP of each SETI survey, which is defined as  , where
  is the distance to the farthest star studied by the specific survey and
  is the minimum detectable flux of the telescope. We also calculate the transmitter rate limit,
  , where Nstar is the total number of stars studied by the project and
  is the fractional bandwidth of the receiver used. In the SETI literature, the transmitter rate is often plotted on logarithmic axes against EIRP. Data points toward the bottom of this plot represent surveys with large numbers of stellar targets and large fractional bandwidths; points toward the left represent surveys where sensitivity is higher and the distance to targets is lower. The dashed and dotted–dashed vertical lines represent the EIRP of the Arecibo planetary radar, and total solar insolation, respectively. A transmitter rate of 1 would be an occurrence rate of 1 narrowband sinusoid per star, per GHz, at a center frequency of 1 GHz. Most of the survey parameters used in this plot can be found in Enriquez et al. (2017). For ongoing and future SETI surveys, we do not yet have a finalized
  value. For MeerKAT, a
  of 1 kpc is used (Czech et al. 2021). For JVLA coherent and incoherent searches, we use 1 kpc and 825 pc, respectively (D. Czech, priv. comm.). For LOFAR, we use 1000 ly (V. Gajjar, priv. comm.). And we have assumed 4000 ly for both the ngVLA and the SKA. For these modern surveys, we have conservatively assumed an Nstar of 1 million. From Figure 9, we can see that the ngVLA has one of the lowest EIRP and transmitter rates and is comparable in performance to the SKA. We note that as a number of these parameters are estimations, this plot should only be considered as an order of magnitude comparison. Nonetheless, these modern projects are all below the red unity line of the Continuous Waveform Transmitter Figure of Merit (CWTFM), providing the most stringent limits on low-power radio transmitters around nearby stars.

Figure 9. Transmitter rate vs. EIRP for several SETI projects. The vertical lines indicate characteristic EIRP powers, while the dashed line represents the EIRP of the Arecibo planetary radar and the dotted–dashed line represents the total solar power incident on the Earth's surface, also known as the energy usage of a Kardashev Type I civilization (Kardashev 1964).
Download figure:
Standard image High-resolution image
2.7. Ethernet-based Commensal Observing
Over the last decade, the reduction in cost of commercial off-the-shelf (COTS) computing technology has enabled new operation modes at radio observatories. As powerful CPU/GPU clusters become more affordable, there is an increasing incentive in using data transport protocols such as Ethernet, which easily interface with COTS hardware. Ethernet provides for multiple subscribers using the multicast protocol, allows multiple subscribers to connect to a single raw data stream, in turn providing more opportunity for scientific discoveries. An Ethernet-based architecture is also flexible as expansion of the computing cluster can be relatively easily achieved by adding more switches. This is highly desirable as the telescope can evolve with new research needs and can potentially benefit from the phased procurement of hardware, which is likely to get cheaper over time. The importance of an Ethernet-based telescope capability is highlighted in the Radio, Millimeter, and Submillimeter (RMS) panel report (Appendix M) of Astro2020. The recently completed MeerKAT telescope in South Africa is the first to embrace a multicast Ethernet protocol (Camilo 2018) for the transfer of all real-time data products. This architecture allows processing nodes to subscribe dynamically to different types of data as needed. The scientific benefit of these commensal systems is clear, as the observational data products get used in multiple ways in parallel. For MeerKAT, its success is demonstrated through a number of commensal observing programs, which has led to the detection of FRB 121102 (Caleb et al. 2020) and the first MeerKAT fast transient (Driessen et al. 2020). A similar effort is being commissioned for the VLA telescope through the COSMIC (Commensal Open-Source Multimode Interferometer Cluster) project (Hickish et al. 2019). We strongly advocate for an internal data transport protocol, such as Ethernet, on the ngVLA, which enables a multiple-data-subscriber paradigm, and is easily supported by off-the-shelf data consumers such as standard CPU/GPU servers. This will allow multiple subscribers to carry out multiple diverse research projects simultaneously, maximizing the potential scientific output. With the flexibility of such Ethernet-based architecture, SETI projects could dynamically choose to subscribe to existing preprocessed data products—like pulsar search beams, which provide an easy (and cost-effective) route to add basic SETI capability to ngVLA—or unprocessed ADC samples, which provide full freedom in choosing how to form beams at arbitrary frequency/time resolutions for SETI science. More importantly, the possibility of accessing and storing snippets of raw voltages is particularly interesting to SETI projects, since that would give us the ability to localize the ETI source provided a signal of interest is detected in the SETI beam, as is being deployed on the MeerKAT and the VLA SETI projects. Commensal ngVLA data will no doubt also benefit the searches of other transient objects such as FRBs and pulsars. Without an Ethernet-based commensal observing set up, each of these projects will be competing for time on the ngVLA. High-risk, high-gain projects such as SETI might be turned down in favor of research topics with low-lying fruits.
3. Conclusion
The ngVLA has the potential to be the most effective SETI instrument ever built. It is the only SETI system capable of detecting an Arecibo-like transmitter beyond 300 pc, and will also provide one of the most stringent SETI limits on low-power radio transmitters around nearby stars. In this work, we identify the SETI parameter space probed by different ngVLA configurations and consider the optimal ways of performing commensal SETI on the ngVLA. We find that the best survey speed can be achieved by observing with only the core antennas about 1 km from the array center. Nominally according to the EOP, the ngVLA will spend one third of its time observing in frequency bands compatible to the TMW, although the majority of the time the ngVLA will be observing at higher frequencies that have been underexplored by SETI projects thus far. That means the ngVLA will provide the best SETI sky coverage above 8 GHz, while it will provide relatively little exposure around the "water hole" spectrum at about 1 GHz. To integrate enough signal to noise when trying to detect a Doppler-drifting ETI signal, we advocate for longer dwell times than what the VLA has historically used, ideally of the order of a few minutes at least.
The main SETI strategy on the ngVLA is to maximize the number of stars monitored, therefore a large number of coherently formed beams is highly desirable. For example, forming 64 SETI beams will give the ngVLA comparable survey speed to the SKA-Mid. A new observing mode that is similar to the pulsar search mode but with high-frequency resolution can help us achieve this. We can select stars based on the 32 million catalog curated by Czech et al. (2021), prioritizing for nearby stars. We might be able to use the 10 beams from the pulsar timing mode with an additional, third-stage upchannelization, but the small number of beams would provide only comparable or worse survey speeds than MeerKAT and will limit our targets to those chosen by the pulsar timing projects. SETI would also benefit from an additional observing mode of incoherent beams so that the entire primary field of view can be searched in parallel. Commensal observations at the Galactic Center, the GHZ, and the ETZ are of particular interest as these sky regions are considered prime SETI locations. Finally, we echo the recommendation of Astro2020 and advocate for Ethernet-based commensal observing capability on the ngVLA. Having access to raw voltages means we can localize signals of interest while snippets of data are still in the buffer and will allow more flexible SETI beamforming and visibility computations.
The work was funded by the National Radio Astronomy Observatory as part of the science community studies program for developing the ngVLA. L.R. was supported by the Summer Undergraduate Research Program (SURP) in astronomy & astrophysics at the University of Toronto. Construction and installation of VLITE was supported by NRL Sustainment Restoration and Maintenance funding. We thank Tracy Clarke for sharing the VLITE observation log, and we thank Chenoa Tremblay, Andrew Siemion, Kenneth Houston, Jack Hickish, David MacMahon, and Savin Shynu Varghese for their useful comments and for carefully reading the manuscript.
Appendix: Software
We have developed some software 10 to enable us to obtain metrics such as sensitivity and survey speed easily for different ngVLA sub-arrays for different lines of sight and observing conditions. This code can also be used to compare the ngVLA to the SKA, see, e.g., Braun et al. (2019) and other relevant facilities.
Footnotes
- 7
- 8
- 9
- 10