


Abstract
The near-infrared region offers a compelling window for interstellar communications, energy transfer, and transient detection due to low extinction and low thermal emission from dust. We have conducted a search for near-infrared (950–1650 nm) light pulses having durations less than 50 nanoseconds while observing 1280 astronomical objects which include a wide range of nearby stars, clusters, and galaxies. A field of view of 2 5 × 25 for a duration of at least 300 s was observed for each object pointing. These observations were made using the latest Near-InfraRed Optical SETI instrumentation on the Nickel telescope (1 m) at Lick Observatory. Equipped with two detectors collecting photons coming from the same part of the sky, the instrument is aimed at detecting light pulses coincident between them within nanoseconds, as well as periodic signals. While we report on a few notifications from our system, we believe these events were consistent with the statistical noise of our data. No significant evidence for repeated near-infrared nanosecond pulsed signal was found, given the instrumental limit in sensitivity of 63 ph m−2 ns−1.
Export citation and abstract BibTeX RIS
1. Introduction
High time resolution astrophysics offers the unique opportunity to study extreme environments of the most compact objects in the universe such as neutron stars and stellar-mass black holes, where rotation and accretion can generate pulsed emissions and photometric variability on millisecond timescales (Casella et al. 2010; Shearer et al. 2010). Giant pulses, from the Crab pulsar for example, show bursting behavior on nanosecond timescales at radio wavelengths (Hankins et al. 2003; Knight 2006; Eilek & Hankins 2016). High-energy transients such as fast radio bursts (FRBs; Lorimer et al. 2007) produce bright pulses of radio emissions with millisecond duration (FRB 121102) down to less than a few 100 microseconds for non-repeated FRBs (Petroff et al. 2016). Although no optical emission from these FRBs has yet been detected (Hardy et al. 2017), their mysterious nature motivates searches for counterpart emissions at different wavelengths. Magnetar giant flares could potentially be another source of bright optical pulses powered by strong magnetic fields (Lyutikov & Lorimer 2016). High time resolution optical observations are also routinely performed to detect optical flashes created by the propagation of very high energetic gamma-rays and cosmic rays through the Earth's atmosphere, generating Cerenkov radiation lasting only a few nanoseconds (Park & VERITAS Collaboration 2015; Lypova et al. 2017). These high energy gamma-rays are generally associated with events such as explosions and high-speed collisions related to supernovae, pulsars, black holes, and active galaxies.
Cocconi & Morrison (1959) noticed that two civilizations separated by many light years might use electromagnetic radiation to communicate and they proposed to search for artificial signals, also called technosignatures (Wright et al. 2018), which, if present in our Galaxy, could potentially be a source of detectable fast transients. As envisaged by Cocconi & Morrison (1959, p. 846), "few will deny the profound importance, practical and philosophical, which the detection of interstellar communications would have." Several programs aimed to search for technosignatures using radio (described in Tarter 2001) or optical wavelengths (Horowitz et al. 2001; Werthimer et al. 2001; Reines & Marcy 2002; Howard et al. 2004; Stone et al. 2005; Tellis & Marcy 2017) have been undertaken since the first dedicated search for extraterrestrial intelligence (SETI) observations in 1960 using the 26 m Tatel radio telescope (Drake 1961). However, wide regions of the electromagnetic spectrum, including the infrared regime, remain largely unexplored. Near-infrared wavelengths (1–2.3 μm) have several advantages over other wavelength regimes for transient detection, interstellar communications, and energy transfer. Propagation of light through the interstellar dispersive and absorbing medium (e.g., interstellar dust) gives rise to interstellar extinction, which is significantly lower in the near-infrared than in the visible (Howard 2006; Wright et al. 2014), hence extending the distance at which an emitter could be detected with respect to visible wavelengths. The near-infrared region of the spectrum gives a unique window for transient and SETI observations through the Galactic plane and dusty environments toward the Galactic center. As we move from the near-infrared into mid- (2.3–30 μm) and far-infrared (30–300 μm) regions of the spectrum, background light due to the thermal emission of circumstellar gas and dust at mid-infrared wavelengths, as well as huge and cold interstellar clouds of gas and dust glowing in far-infrared light, make these regions of the spectrum a poor choice for SETI and transient detections. This is even more apt for ground-based observations which are strongly affected at these wavelengths by both high atmospheric absorption and high sky-background emission.
The invention of new laser amplification techniques such as chirped pulse amplification (Strickland & Mourou 1985) and optical parametric chirped pulse amplification (Dubietis et al. 1992) has enabled rapid development of ultra-intense and ultra-short lasers. Current pulsed lasers, e.g., the Japanese Laser for Fast Ignition Experiments (Shiraga et al. 2015) or the Texas Petawatt Laser (Martinez et al. 2012), can produce near-infrared (1.05 μm) pulses with 1–2 petawatts (2 × 10¹⁵ W) peak power for a duration of a few picoseconds (10−12 s). The intense pulses produced by these lasers would outshine the Sun by several orders of magnitude over kiloparsec distances (Howard et al. 2004) if one would be able to beam them into space. Some projects of high-power lasers for photonuclear physics, such as the European Extreme Light Infrastructure, aim to build exawatt class lasers (1018 W) that will deliver extremely bright pulses by producing kilojoules of energy in one femtosecond (10−15 s) or less, with high repetition rates (10–1000 Hz). If such ultra-short and ultra-intense pulsed signals were sent from kiloparsec distances and beamed toward our direction, they would be distinguishable from most known astrophysical sources from our perspective if observed with a high time resolution instrument (Howard et al. 2004; Lubin 2016).
Breakthrough Listen13 has launched an impressive program in the microwave spectrum using the Green Bank Telescope and Parkes Telescope (Enriquez et al. 2017; MacMahon et al. 2018). This program started in parallel with an optical counterpart search using the Automated Planet Finder (APF) at Lick Observatory conducting a sensitive optical targeted search in integrated visible spectra. This program is highly sensitive to continuous wave (CW) laser pulses and potentially high duty cycle pulses (>1 Hz) from individual stars. However, spectroscopic instruments are usually poorly suited for conducting both large field-of-view surveys and an all-time SETI search. Long exposures required for spectroscopy are not adapted to the search of highly intermittent signals and spectrographs do not always push to the desirable near-infrared wavelength regime more favorable to long-distance communications.
The infrared regime was identified early on as an optimal spectral region for interstellar communications (Townes 1983; Hippke 2018), yet it has remained a largely unexplored territory for SETI. Observing very rapid astrophysical phenomena, or transients, on millisecond down to nanosecond timescales requires specialized high-speed detectors and large-aperture telescopes for high-flux levels. The challenge has been the lack of adequate near-infrared fast-response low-noise sensitive detectors. Fast near-infrared detector technology has matured rapidly in the last decade (Linga et al. 2005, 2009, 2010), offering higher quantum efficiencies and lower detector noise.
In this paper, we describe the first high time resolution survey intended to search for sub-μsecond transients and technosignatures at near-infrared wavelengths (950–1650 nm) using the dedicated Near-InfraRed Optical SETI (NIROSETI) instrument (Maire et al. 2014, 2016; Wright et al. 2014). An overview of the campaign is given in Sections 2 and 3. Data analysis techniques are described in Section 4 and survey results are summarized in Section 5.
2. Observational Setup
On 2015 March, our team commissioned the NIROSETI (Maire et al. 2014, 2016; Wright et al. 2014) instrument at Lick Observatory (Mt. Hamilton, California) on the Anna L. Nickel (1 m) telescope. NIROSETI is a specialized fast time response instrument designed to detect near-infrared fast (<50 ns) pulses. NIROSETI operates from 0.95 to 1.65 μm and uses a pair of InGaAs discrete amplification avalanche photodiodes (DAPD; Linga et al. 2005, 2009, 2010). These photon-counting detectors are particularly appropriate for our search since they have a superior noise factor (1.05) with very high gain and high bandwidths compared to other low-light level photodetectors (>1.3 for photomultiplier tubes (PMTs) or conventional Avalanche photodiodes (APDs)). Both DAPDs are run at 2 GHz bandwidth and observe simultaneously on the same field of regard with an individual field of view of 25 × 25. NIROSETI has a built-in optical camera for field acquisition and real-time guiding on-source. Analog signals from each detector are processed by a 2.25 GHz oscilloscope with a sampling rate of 4 GSa/s. It also includes an internal pulsed laser (0.98 μm) that can be placed on the optical axis for performance verification.
An observing night with NIROSETI starts by cooling the detectors to their operational temperatures down to −25°C. Then, a full dark acquisition is performed with detector shutters closed to obtain pulse height statistics generated by dark current in these detectors. This operation is repeated several times during the night to take into account slight changes in operational conditions. Statistics on dark pulse heights will be indeed crucial for distinguishing between an unusual signal and dark noise once observing a celestial object. Optical alignment of the two detectors is also verified each night by pointing the telescope at several directions around the star, following a square 10 × 10 arcsec grid to record in which pointing direction the number of detected photons on each detector is maximal. If these directions are identical for both detectors, the system is said to be properly aligned, and a reference point for the guider camera is defined, otherwise a physical realignment of the detectors is needed and a new on-sky verification is performed until proper alignment is achieved (Maire et al. 2016).
The NIROSETI data pipeline performs real-time data processing that analyzes recorded waveforms from each detector in terms of pulse height distribution (PHD), periodicity, and coincidences between both detectors (see Section 4.1). NIROSETI observations were performed using a total on-sky exposure time of 300 s per object. The length of time spent observing each object was defined as roughly equal to the time it takes for our system to reacquire a new source, including telescope slewing time and alignment procedure. While our instrument would detect signals with pulse periods covering about 10 decades in time (from 30 nanosecond to 300 s), it is also important to maximize the number of observed objects to increase the chance of detecting a true positive. There are a few sources where we altered the exposure time (e.g., galaxies, KIC 8462852) to achieve a longer waveform baseline.
For one source (HIP 114095), NIROSETI conducted a coordinated target of opportunity with the 2.4 m APF telescope at Lick Observatory (Vogt et al. 2014) on the night of 2017 April 22 (UT). The optical APF SETI program is aimed at detecting CW emission lines in high-resolution (R ∼ 100,000–150,000) spectra. A similar optical spectroscopic SETI search and analysis were conducted on archived W. M. Keck Observatory High Resolution Echelle Spectrometer (HIRES) spectra (Tellis & Marcy 2017). These coordinated NIROSETI and APF observations are further described in Section 5.5.
3. Campaign Targets
While the fraction of Sun-like stars hosting Earth-size planets in their habitable zone is expected to be relatively high in our Galaxy (22 ± 4%; Petigura et al. 2013), the limited sensitivities and coverages of current instruments imply that only a small number of habitable exoplanets have yet been discovered. SETI targeted search strategies still need to include stars without known orbiting exoplanets (Wright 2017). The NIROSETI target list is based on the Breakthrough Listen target list (Isaacson et al. 2017) that includes giant and main-sequence stars, as well as nearby galaxies. One of the primary reasons for coordinating NIROSETI observations with the Breakthrough Listen sample was to generate a comprehensive wavelength coverage of prime SETI targets between optical, near-infrared, and radio SETI searches. The Breakthrough Listen sample contains 1709 stars (galaxies not included) selected to give the survey an equal distribution of spectral types. After culling the list with the decl. range of the Nickel telescope (−12° <decl. <67 24) the number of targets observable with NIROSETI is reduced to 1004 objects.
In addition to the Breakthrough Listen targets, we added other targets of interests such as Earth transit zone (ETZ) stars (Heller & Pudritz 2016) which, located on the Ecliptic plane within 42–934 pc from Earth, give from their vantage points the capability to observe the Earth transiting the Sun. We also added stars with known planets that are predicted to be in the habitable zone.14 Milky Way globular clusters (Schmeja et al. 2014) are also of great interest for the high number of stars that can be observed in one exposure. SETI candidates from previous SETI campaigns (Reines & Marcy 2002; Howard et al. 2004; Stone et al. 2005) have been included as well as known optical pulsating sources such as the Crab pulsar (Zampieri et al. 2014), and optically quiet radio sources such as FRB 121102 (Hardy et al. 2017). The total NIROSETI sample list is currently 1330 sources. Table 1 shows the distribution of the NIROSETI target sample and fraction completed, and Figure 1 represents the angular distribution of the 1280 NIROSETI observed objects. We began a comprehensive NIROSETI campaign survey in 2016 January. As of 2018 June 7, we have performed 3071 on-sky acquisitions in 122 nights, with 1280 observed sources.
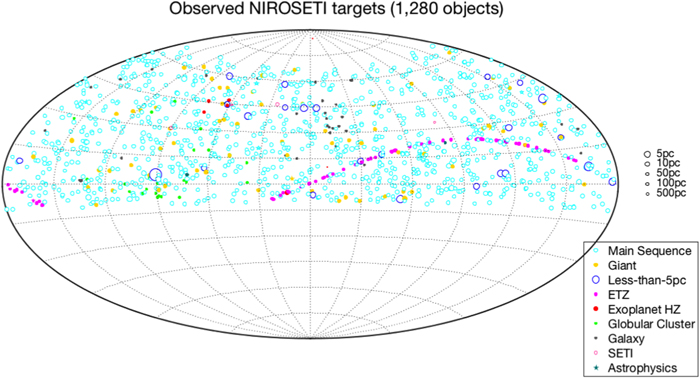
Figure 1. Angular distribution of NIROSETI observed objects, color coded by categories. Most of these stars are part of the main sequence and are located at less than 50 pc. More distant objects have also been observed, such as ETZ stars located on the ecliptic (magenta circles forming an arc on the map), globular clusters, and galaxies, taking advantage of longer distances that near-infrared wavelengths can reach due to lower interstellar extinction with respect to visible wavelengths.
Download figure:
Standard image High-resolution imageTable 1. NIROSETI Campaign Sample
| Object | Type | Distance | Sample | Observed | Number of |
|---|---|---|---|---|---|
| Category | Numbera | Numbera | Acquisitions | ||
| Main-sequence stars | B, A, F, G, K, M | 5–50 pc | 1053 | 1052 | 2021 |
| Giants | F, G, K, M | 9–44 pc | 70 | 70 | 232 |
| Less than 5 pc distant stars | A, F, K, M | <5 pc | 27 | 27 | 73 |
| Stars in the Earth transit zone | F, G, K | 42–934 pc | 64 | 63 | 196 |
| Stars with known exoplanet(s) in the habitable zone | K, M | 12–368 pc | 5 | 5 | 5 |
| Globular clusters | ⋯ | 3.5–20 kpc | 22 | 22 | 88 |
| Galaxies | S(a–c), SO, E, Irr, dwarf | <29 Mpc | 82 | 33 | 88 |
| Otherb | A, F, G | 28 pc–2 kpc | 7 | 7 | 368 |
Notes.
aAs of 2018 June 7. Objects belonging to more than one category are counted only once. bSETI targets of interest (e.g., KIC 8462852), Crab pulsar, FRB 121102.Download table as: ASCIITypeset image
4. Data Processing and Analysis
Searching for nanosecond pulses represents a challenge when one needs to consider data flow and storage, with signals from the two NIROSETI detectors being digitized with a sampling rate of 4 GSa/s. To tackle the issue of managing extremely large amounts of data, acquisitions are divided into two operational modes: a  consisting of recording 25 successive 9.2 μs waveforms simultaneously on each detector to record the entire waveform for pulse analysis and periodicity search. Then, during a 300 s
  , the scope is set to be triggered when a pulse with a large amplitude (>50 mV, i.e., 6.7 photoelectrons; Section 4.2.3 below) is detected on the first detector channel. Each trigger event activates the recording of a 40 ns long detector waveform on each detector (20 ns before and after the trigger event occurred). A full acquisition on a specific target takes about 15 minutes to perform, which includes telescope pointing, data recording, and analysis.
4.1. Data Reduction
4.1.1. Short Waveforms
For each target acquisition, the instrument first starts by recording twenty-five 9.2 μs successive waveforms (0.2 ms total) for detecting anomalies such as high photoelectron (p.e.) events. Pulse detection is performed on each of these 25 waveforms, and the time of arrival and amplitude of each pulse are recorded to generate a PHD. These 25 distributions are summed and normalized to 1 s acquisition. The spectral density estimator is also calculated for periodicity analysis by summing all waveform spectral densities. As previously described in Maire et al. (2016), the periodicity analysis performed on our data set has found no evidence of periodic signal.
A derivative method is used to detect all pulses in recorded waveforms. Each 9.2 μs detector waveform is first smoothed with an averaging 0.75 ns window to filter out small amplitude noise fluctuations (rms ∼ 0.5 mV). The slopes of the waveform voltages are calculated using a derivative with only one point of separation to calculate the slope. Successive positive and negative values indicate the time of occurrence of the detected pulse. The voltage of the pulse is then recorded and kept for statistical analysis.
After each acquisition, the PHD is calculated using an inverse cumulative histogram giving the occurrence rate of pulses above a given threshold. Typical PHDs are represented in Figure 2(a), measured while observing HIP 65640. At very small voltages (<2 mV), the waveform is dominated by scope noise fluctuations which generate small amplitudes peaks that are ignored in the rest of our analysis. Between 2 and 6.5 mV (1 p.e. level), PHDs exhibit a plateau showing that very few pulses have these amplitudes as one could expect from our photon-counting detectors. Beyond 6.5 mV (1 p.e. level), the tail of the PHD decreases almost linearly on a semi-log display. No pulse higher than 30 mV was detected in this specific waveform acquisition, most likely due to the finite time of the acquisition (0.2 ms total). Indeed, it can be shown experimentally (Maire et al. 2014) with 48 hr of continuous dark observations using these detectors that follow the same logarithmic decreasing law as dark PHDs, showing the (rare and decreasing) occurrence of very large pulses in long exposures.
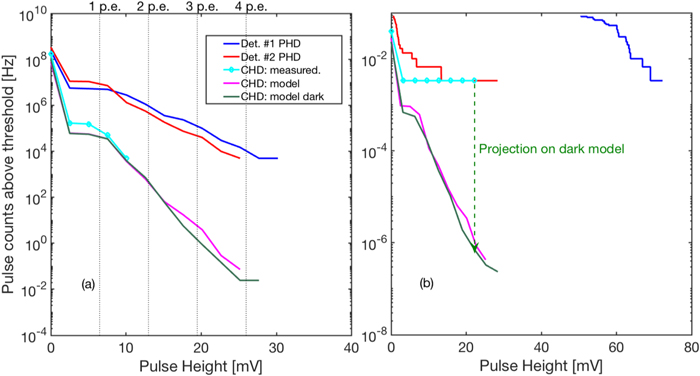
Figure 2. Examples of measured pulse and coincidence height distributions (PHDs and CHDs) obtained during HIP 65640 observations on 2016 March 27 (09:32:58UT). Panel (a) represents distributions measured from an entire 0.2 ms waveform, while panel (b) was obtained from a 301.7 s trigger acquisition. While no significant difference between dark and on-sky CHDs were measured during waveform acquisitions (CHDs in green and cyan, respectively, on panel (a), a significant departure of CHD from dark CHD was measured during trigger acquisitions (panel (b)). This significant CHD departure is due to the detection of a rare coincidence which in this specific case could occur on average once every 1.3 × 10⁶ s if due to dark noise. This occurrence time is obtained by the projection of the highest measured coincidence onto the dark CHD, giving by this means the rate at which this coincidence occurs on average if due to dark noise (0.72 × 10⁻⁶ Hz, i.e., 1.38 × 10⁶ s).
Download figure:
Standard image High-resolution imageFor each detected pulse on one of the two detectors, the data processing software searches whether a pulse event occurred on the other detector at the same time or within a given time window for coincidence detection. A coincidence is registered if the pulses detected on both detectors occurred during the same time interval, defined as the coincidence time τ. Given the median ∼0.45 ns FWHM of a 1 p.e. pulse (Maire et al. 2014), a coincidence time τ of 1 ns was chosen for coincidence detection. The time at which a pulse reaches its maximum amplitude, or height, is used as a reference time for the arrival time of the pulse. If V1(t1), V2(t2) are the heights of the pulses detected with detectors 1 and 2 respectively at time t1 and t2, (with  ), we defined the height Vc of a coincidence event as the smallest pulse height of the two pulses which occurred within the coincidence time, or

Given that dark pulses occurring on detectors 1 and 2 are independent events, the false alarm rate can be predicted with the coincidence height distribution (CHD) deduced from measured PHDs from detectors 1 and 2, respectively h1(V) and h2(V) (Wright et al. 2001), such as

As could be seen on Figure 2(a), a very good prediction of the measured CHD (in cyan) is obtained with this model using h1(V) and h2(V) PHDs measured during the same acquisition (for faint stars) or from a recent dark acquisition. If the observed celestial object is relatively faint (J > 2), the number of photoevents generated by stellar photons becomes smaller than those generated by dark noise, hence distributions are in this case dark-limited and one could predict reasonably well the measured CHD using Equation (2) with dark PHDs as illustrated on Figure 2(a).
4.1.2. High Photoelectrons Events
For the longer 300 s trigger acquisitions, the scope waits for a high p.e. event to occur on detector 1, with a threshold voltage Vt set to 50 mV (corresponding to about 6.7 photoevents, see discussion below). When a trigger event occurs, both channel 1 and 2 waveforms are recorded, starting 20 ns before the triggering event occurred and lasting 20 ns after. The choice of the channel on which the scope is triggered is somewhat arbitrary, since we could also have decided to trigger on detector 2, or for instance on the sum of both waveforms. In the case of trigger acquisitions with the threshold Vt only applied to one channel, the false alarm rate can be predicted with the CHD defined as

where h1trig is the detector 1 PHD in triggering acquisition mode. Once again, this expression gives a predicted coincidence false alarm rate in very good agreement with the measured coincidence distribution for objects relatively faint (J > 1 with our current 1 m telescope and instrument). We chose to illustrate on Figure 2(b) an observation where the model failed to predict the measured CHD. Indeed, this departure from the model is used to detect abnormal high coincidence events during on-sky acquisitions. We used the departure from the model to quantify the rarity of the highest coincidence event measured during acquisitions, assuming this coincidence would have been produced by dark noise.
4.2. Notification Setup
Simultaneous signals obtained from both detectors are analyzed in quasi real-time, waveform analysis is performed, anomalies in the signal are detected, and observers are notified about possible abnormal signals a few seconds after the end of an acquisition. A set of indicators generating notifications allows observers to detect anomalies in the signal in terms of rare pulse events and pulse periodicity. In particular, a high p.e. coincidence will generate an alarm (notification) suggesting to directly re-observe the same target with the hope that this rare coincidence event will be repeated, possibly unveiling a signal of interest coming from a region within the instrument field of view.
4.2.1. False Alarms
False alarms can be generated by spurious signals such as cosmic rays or detector dark noise (Howard et al. 2004), but the probability that such events generate an alarm is kept very low by the use of two detectors in the instrument working in coincidence. Furthermore, dark noise is experimentally characterized by taking dark observations between acquisitions. Thus, the PHD of the dark signal is well known on both detectors in terms of the average number of pulses with given heights. Since these dark pulse events are independent when measured simultaneously by the two detectors, it is possible to deduce the dark CHD from the dark PHDs of the two detectors as seen in Section 4.1.
When observing very bright stars (J ≤ 1), the number of photoevents due to stellar photons becomes higher than those generated by detector dark noise; performance of the instrument is no longer dark-limited. In the case of bright stars, anomalies in measured PHDs and CHDs are not detected anymore by comparisons with dark noise statistics but by a significant departure from the log-normal tail distribution given by fitting the tail of the PHD with a decreasing logarithmic law.
Given the relatively small field-of-view of the instrument (25), the number of pulses generated by the sky background is negligible in comparison to those produced by dark noise. We performed specific sky-background measurements at several elevations, directions, and Moon illuminations to verify that the instrument is dark-noise limited rather than sky-background limited.
4.2.2. Anomaly Metrics
Different metrics are possible to estimate how often a measured coincidence was likely to occur during the time of the observation if it was generated by dark noise events or star photon arrivals.
For NIROSETI detection of a pulsed signal based on coincidence detection, the false alarm rate is by definition given by the CHD, which gives the rate at which a coincidence of a minimal height can occur (Figure 2). For each celestial object acquisition, the highest measured coincidence is used to infer the time it would take on average to produce such a coincidence if it was generated by noise sources. The height of the highest measured coincidence of the acquisition is projected onto the dark PHD measured previously during the night, giving the rate at which such coincidence can occur (an illustration of the projection is made on Figure 2(b)). The inverse of this rate gives the time it takes on average to obtain such a coincidence, referred below as the equivalent-dark coincidence occurrence time td (EDC). For bright star observations, the projection is made onto the predicted coincidence curve obtained from Equations (2) and (3) to take into account the number of coincidences due to stellar photons.
In addition to the EDC metric which captures the rarity of the highest coincidence in each acquisition if this coincidence was due to noise sources (dark noise, star and background light), we also assess how likely the detected highest coincidence could have occurred in k acquisitions (equivalent to statistical trials) using Poisson statistics. Indeed, the average number of dark coincidence per acquisition having a height Vc is given by nc = Cd(Vc) te where te is the exposure time. Since Cd(Vc) = 1/td by definition of EDC, the average number of dark coincidences becomes  . Thus, the average number of such a dark coincidence occurring during k acquisitions is given by
  . In particular, if X is a random variable representing the number of coincidence occurrences, the probability Pk[X ≥ 1] of such a coincidence occurring at least once in k trials (all k acquisitions using the same exposure time) is given by 1 − Pk[X = 0], where Pk[X = 0] is the probability that this event did not occur in k acquisitions. Hence, the probability that the highest coincidence measured in one specific acquisition occurs in k acquisitions is given by

We use this probability to assess how likely it was to obtain the highest measured coincidence of a specific acquisition during a night of observations (k ≈ 20) or during the full survey campaign (k ≈ 2500).
4.2.3. Alarm Threshold
If a pulsed signal was sent from a region inside the instrument field of regard, it will generate a coincidence which would need to be higher than our detection threshold in order to be detected and generate an alarm. We defined our alarm threshold such that the probability of having at least one false alarm per k = 20 acquisitions is 5%, 20 acquisitions being the average number of acquisitions per observing night. When  , the exponential in Equation (4) can be developed as
  . It results that in our setup an alarm is triggered when
  .
.
Given the exposure time te = 0.2 ms of a NIROSETI waveform acquisition, an alarm is triggered when td > 80 ms. This can only be reached if the highest measured coincidence has an amplitude corresponding to at least three photoelectrons. Given the exposure time te = 300 s of a NIROSETI trigger acquisition, an alarm is triggered when td > 120,000 s (1.39 days). This can only be reached if the highest measured coincidence has a voltage corresponding to at least 3 p.e. on detector 2 (and 7 p.e. on detector 1 to be detected).
The number of photoelectrons as a function of the pulse voltage height p(V) = αV can be deduced by making use of the false alarm model (Howard et al. 2004) which predicts the number of photoelectron pile-up in a given interval of time τ to be  , where n is the number of photoelectrons and r is the rate of photoelectrons arrival. From the dark calibrations, we derived a photoelectron–voltage relationship for each detector (α1 = 142 p.e. V−1 and α2 = 166 p.e. V−1), and use the average number of photoelectrons per volt (
 p.e. V−1, i.e., a 1 p.e. event corresponds to a 6.5 mV pulse height) by convenience to quantify pulse heights in terms of photoelectrons.
As a result of the instrument sensitivity and alarm threshold, a laser emitting a nanosecond pulse in our direction will be detected if at least three photoevents per detector are generated simultaneously on each detector, with a 5% probability of a false alarm in 20 acquisitions. Given the 15% photon detection efficiency of our detectors, and 80% transmission of the telescope and instrument, the NIROSETI experiment is sensitive to pulses having at least 63 ph. m−2 ns−1 at the entrance of the telescope (105 ph. m−2 ns−1 for trigger acquisition). Using an interstellar extinction of 0.2 mag kpc−1 in the J band (Howard 2006), the sensitivity of the instrument corresponds to the detection of a pulsed signal that would have been generated by a laser as energetic as the National Ignition Facility (1.8 MJ in 3 ns; Danson et al. 2015) and sent using a 10 m telescope with a 2 mas narrow beam, located at no more than 160 pc. Among the seven highest coincidence events detected during our campaign and described in the following section, four of these events occurred during observations of stars located within the 160 pc distance. Three of them are located at a distance of about 25 pc, decreasing by a factor 41 the energy per pulse required for being detectable by our instrument with respect to an emitter located at 160 pc. However, these distances and required energy should be taken cautiously as highly dependent on the transmitting scheme (e.g., pulse width or size of transmitting telescope).
5. Results
5.1. Campaign Results
We report on Table 2 NIROSETI objects of interest (NOI) that have generated significant notifications during the campaign, but none were repeated on the same object after multiple night re-observations. We have represented on Figure 3 the highest coincidences generated during the campaign sorted by decreasing EDC (HIP 65640 for the highest to G14-32 at bottom). Two alarms were generated during the same night at 18 minute interval while observing G14-32.

Figure 3. Rarest coincidence events observed as of 2018 June 17 for seven sources. The instrument is configured to trigger the recording of pulse waveforms whenever the height of the pulse detected on channel 1 is higher than the threshold value (50 mV, i.e., 7 p.e.). These simultaneous acquisitions of detector waveforms are performed to detect coincidences. These measured coincidences are extremely rare events, unlikely to occur during the 300 s exposure time. The HIP 65640 coincidence (top panel) can be produced on average once every 16.1 days of continuous observations if this event was due to dark noise.
Download figure:
Standard image High-resolution imageTable 2. NIROSETI Campaign Notifications
| Object | Date | Time (start) | Acquisition | Exposure | tda | tda | Pk=20(X ≥ 1)b | Pk=2500(X ≥ 1)c |
|---|---|---|---|---|---|---|---|---|
| Name | y-m-d | h:m:s | Mode | Time (s) | (s) | (days) | (%) | (%) |
| HIP 65640 | 2016 Mar 27 | 09:22:39 | Trigger | 301.7 | 1,388,361.6 | 16.07 | 0.43 | 41.9 |
| HR 7528 | 2017 Jul 18 | 09:31:21 | Trigger | 302.6 | 1,279,955.5 | 14.8 | 0.47 | 44.6 |
| HIP 108028 | 2017 Aug 22 | 05:46:38 | Trigger | 300.7 | 667,794.2 | 7.7 | 0.89 | 67.5 |
| G14-32 | 2017 Apr 21 | 06:15:16 | Trigger | 300.8 | 319,040.6 | 3.69 | 1.8 | 90.5 |
| KIC 8462852 | 2016 Oct 27 | 03:15:05 | Trigger | 900.1 | 634,426.5 | 7.34 | 2.79 | 97.1 |
| HIP 102101 | 2016 Jun 20 | 10:44:52 | Trigger | 300.5 | 133,669.4 | 1.54 | 4.4 | 99.6 |
| G14-32 | 2017 Apr 21 | 06:32:03 | Trigger | 300.4 | 121,141.4 | 1.4 | 4.8 | 99.8 |
Notes.
aEquivalent dark coincidence occurrence time. bProbability that at least one coincidence with the same rarity occurs in 20 acquisitions. cProbability that at least one coincidence with the same rarity occurs in 2500 acquisitions.Download table as: ASCIITypeset image
Probabilities that these highest coincidences occurred in 20 and 2500 acquisitions are calculated from Equation (4) and reported in Table 2. The highest coincidence event obtained during the campaign (HIP 65640) had a relatively high probability of occurrence (>40% in 2500 acquisitions) if due to dark noise.
No bright pulse was detected during the 13 acquisitions of FRB 121102, representing more than 1 hr of observations. This FRB is known to repeat (Spitler et al. 2016), but no visible or near-infrared counterpart of the repeated radio emissions have been detected (Hardy et al. 2017).
5.2. NOI-1: HIP 65640
HIP 65640 is a high proper motion K5 star located at 26.1 pc (Gaia Collaboration et al. 2016) that produced the rarest coincidence of the campaign (Figure 3, top panel). If due to dark noise, this coincidence could occur on average once every 1.4 × 10⁶ s (16.07 days) of continuous observation. The probability that this event could occur in 20 acquisitions is 0.4% if due to dark noise. The combination of the waxing Moon (86.7% illumination) at 55° from the observed star with a high level of humidity outside the dome (90% relative humidity) during observations, could have increased the level of scattered Moon light and starlight absorption, which can generate local fluctuations of sky background on short timescales. We performed 67 other observations of HIP 65640 during 14 nights spread in a period of two years, but no alarm was triggered during these re-observations. Therefore, we can consider this NOI event as a false alarm, possibly generated by scattered Moon light or Cerenkov radiation.
5.3. NOI-2: HIP 102101
HIP 102101 is a variable M-type star located at 24 pc from the Sun whose variability period (14.11 days) is related to the star rotation and its nonuniform surface brightness (Kiraga & Stȩpień 2013). On 2016 January 20, observations of HIP 102101 generated a notification corresponding to an EDT of 133,669 s (37.1 hr) of continuous observation. No periodicity or other high coincidences were found in waveform acquisitions. The combination of the full Moon at 84° from the observed star with the presence of a diffuse halo around the Moon as recorded by the Lick Skycam during observations could explain an increase in Moon light scattered by passing clouds and a substantial increase of sky background. Thirty-one re-observations were performed during the course of the survey, but none have generated a second alarm. Therefore, we can reasonably rule out the possibility that this NOI event could have been generated by a signal coming from space.
5.4. NOI-3: KIC 8462852
Boyajian's star has sparked great astronomical interest in its unusual and aperiodic light curve observed by the Kepler telescope (Boyajian et al. 2016). KIC 8462852 is a F3V star located at a distance of  pc (Hippke & Angerhausen 2016). Flux fluctuations up to 20% dimming over periods of days to 12 weeks were observed, but the process at the origin of this flux drop was highly debated (Wright et al. 2015; Boyajian et al. 2016; Wright 2016). No periodic optical signals within a nanosecond time frame was detected in visible wavelengths (Schuetz et al. 2016). Recent observations suggest that the dimming arises from circumstellar material (Meng et al. 2017). It was observed as a target of interest during the NIROSETI campaign. A total of 7.4 hr of trigger acquisitions were performed on KIC 8462852. These observations generated one NIROSETI notification (EDT of 7.3 days). As can be seen on Figure 3, the coincidence event is preceded by two pulses on detector 2 that, if resulting from photoevents, would indicate a different time arrival of photons, and may be an indication of a false coincidence. The probability of occurrence of this event in 2500 acquisitions is relatively high if due to dark noise (>97%) and no other pulses reaching the NIROSETI sensitivity threshold were detected. Furthermore, inspection of Lick Skycam images, which are saved in NIROSETI reports after each acquisition, shows a broken cloud cover (7/10–9/10 covered) during the acquisition that produced the notification, ruling out with a high level of confidence that this NOI event would have been a transient related to KIC 8462852.
5.5. NOI-4: HD 114095 (G14-32)
G14-32 is a ETZ G-type star (Heller & Pudritz 2016) located at 212 pc from the Sun. Its ETZ location increases the probability that Earth would have been detected by transit from this distant point of view. Two NIROSETI notifications were generated during the same night while observing G14-32, although one notification was just above our notification threshold. We noticed an unusual 45% increase of dark pulses on detector 2 during this specific night of observations, which raised the probability of dark coincidences.
These notifications prompted us to take seven high-resolution optical spectra on 2017 April 22 (UT) with the 2.4 m APF telescope and Levy spectrometer (Vogt et al. 2014) at Lick Observatory to search for CW laser emission. The exposures were 10 minutes long each and were obtained (robotically) with the  entrance slit that projects to 1'' × 3''. Spectra were analyzed for any spectral anomalies from 3600 to 9800 Å. Among the seven measured spectra, one of them exhibited one candidate laser emission line.
Figure 4 (left panel) shows a portion of the reduced high-resolution spectrum of G14-32, in photons per pixel, with each pixel having a wavelength extent of 0.027 Å. It reveals a candidate laser emission line at a wavelength of 8834.25 Å (observatory frame) having a width, FWHM = 0.082 Å, and saturated in intensity. To test whether this signal is a true emission line or a cosmic ray we examined the original raw CCD image.

Figure 4. Left: a candidate laser emission line in a high-resolution optical spectrum of G14-32 at a wavelength of 8834.25 Å (observatory frame). Its intensity is saturated, with over 216 electrons in some of the original CCD pixels (see the right panel) and a width of FWHM = 0.082 Å, consistent with the instrumental profile of the spectrometer. Right: the raw CCD image from the APF–Levy spectrometer showing three spectral orders, including the candidate laser emission (middle order, center) in the star, G14-32 (as shown in the left panel). Eight of the pixels are saturated containing 65,536 electrons, the maximum possible by the electronics of the CCD. The candidate laser line has a width in the spatial direction (up–down, perpendicular to dispersion) of only 3 pixels. In contrast, the stellar spectrum has a greater spatial width of 8 pixels, demonstrating the contemporaneous effect of turbulence in the Earth's atmosphere that blurs all point sources of light (seeing). As the candidate laser emission exhibits smaller spatial smearing, it did not come from beyond the Earth's atmosphere. Instead it is likely caused by a cosmic ray that hit, and generated electrons in, the CCD silicon substrate.
Download figure:
Standard image High-resolution image
Figure 4 (right panel) shows the raw CCD image (before the spectral extraction), showing three spectral orders, with the middle one containing the candidate laser emission feature, visible by eye. The color scale has white for the maximum number of electrons and dark blue for the lowest number. The upper order shows an absorption line located right of center at pixel 3414, for reference. The middle spectral order shows a plausible laser emission line because it is extended by a few pixels in both the dispersion and spatial directions, as demanded by the 2D point-spread function of the spectrometer and seeing. One may assess if this candidate laser line was caused by photons that went through the telescope and spectrometer or by particles (e.g., cosmic rays) that directly pierced the CCD substrate. Row 1826 contains six consecutive pixels that are saturated at 65536 DN.
The candidate laser emission in Figure 4 is extended by only 3 pixels in the spatial direction (up–down). In contrast, the stellar spectra in all three spectral orders are extended by 8 pixels, a width caused by the refraction of light passing through the turbulent Earth's atmosphere. The narrower width of the candidate laser line in the spatial direction shows that it was not caused by light that passed through the Earth's atmosphere. Instead, the candidate is likely due to a cosmic ray, of which many are commonly detected, that hit the CCD substrate, depositing kinetic energy in the CCD substrate and dislodging hundreds of thousands of electrons that are then trapped in the potential wells of the pixels. Therefore, the candidate laser emission did not arise from light beyond the Earth's atmosphere and is instead explained as a common cosmic-ray particle.
5.6. NOI-5: HR 7528
HR 7528 is a high proper motion B-type star located at 50 pc from the Sun. This star is a rapidly rotating star with a projected rotational velocity (vsin i) of 140 km/s−1 generating a relatively high oblateness (van Belle 2012). The coincidence which occurred on 2017 July 18 has an EDT of 14.8 days of continuous observation. Since the probability to obtain at least one dark coincidence of this height in 2500 acquisitions is relatively high (44.6%), this non-repeating event was very likely produced by a spurious signal. We performed 17 re-observations (total time of 85 minutes) of this star without other notifications.
5.7. NOI-6: HIP 108028
HIP 108028 is a high proper motion K-type star located at 24 pc having a bright infrared excess (Meshkat et al. 2017). On 2016 July 18 (UT), observations of HIP 108028 generated a notification corresponding to an EDT of 667,794 s (7.7 days) of continuous observations. Inspection of Lick Skycam images taken during observations shows that a plane and its condensation trail passed within 30' of the instrument's line of sight, which could have generated a false alarm in our system. The fact that the times of arrival of the two pulses are separated by one-half of a nanosecond (Figure 3) suggests that this NOI is most likely a false coincidence. HIP 108028 was re-observed 36 times during the survey but this star did not generate other notification in our system.
6. Conclusion
Based on NIROSETI observations and candidate follow-up, we found no evidence of repeated near-infrared pulsed signals (<50 ns width, 0.9–1.7μm) around 1280 celestial objects, with a sensitivity of 63 ph m−2 ns−1 (105 ph m−2 ns−1 for long trigger acquisitions) at the entrance of the telescope.
Even if this study represents a considerable effort to expand fast transient and technosignature searches in the near-infrared wavelengths, the relatively small NIROSETI field of view (25 × 25 ) means that the chance of looking in the right place at the right time is relatively low. The total sky coverage of this survey of 1280 objects observed with NIROSETI represents a tiny fraction (∼1.5 × 10⁻⁶%) of the sky which would need to be observed in its entirety, all of the time, if one wants to assert conclusions about the meaning of a nondetection. As stated by Cocconi & Morrison (1959, p. 846), "the probability of success is difficult to estimate; but if we never search, the chance of success is zero." We are building a second list of celestial objects to be observed with NIROSETI, which includes stars with infrared excesses and high metallicities (Kunder et al. 2017).
Developing wide-field high time resolution instruments becomes crucial to search for fast transients all-sky all-time. Transit observing strategies have been adopted to perform the first SETI all-sky surveys at visible wavelengths (Horowitz et al. 2001; Howard et al. 2004) with 0.32 square degrees of instantaneous field of view covering the sky in 150 clear nights. Efforts to design and develop high time resolution optical instruments capable of monitoring the entire observable sky during all observable times have been undertaken under the all-sky all-time Panoramic SETI project (Cosens et al. 2018; Maire et al. 2018; Wright et al. 2018), intended to reach an instantaneous field-of-view coverage of 8500 square degrees.
We would like to greatly thank the generosity of the Bloomfield Family Foundation for supporting this research and instrument; their interest and enthusiastic support of SETI research catalyzed these endeavors. We would like to extend our thanks to Rafael Ben-Michael, Chief Technology Officer at Amplification Technologies, for all the helpful discussions regarding their near-infrared detectors. We would also like to thank the entire Lick Observatory staff that supported the successful installation, commissioning of NIROSETI as well as operations with the Nickel 1 m telescope. With special thanks to Lick Observatory and University of California Observatories members: Kostas Chloros, Will Deich, Elinor Gates, Erik Kovacs, Kyle Lancos, Paul Lyman, Camille Martinez, Donnie Redel, Graeme Smith, Shawn Stone, Anthony Watson, and Pavl Zachary. We would like to sincerely thank Laurie Hatch for permission to use her professional photographs of the instrument. We would like to extend our thanks to Gloria and Ken Levy for their generous support of the Lick Observatory Automated Planet Finder Telescope and Levy Spectrometer as well as Google for ongoing support of Lick Observatory. A part of the laboratory work was carried out at the Dunlap Institute for Astronomy & Astrophysics, University of Toronto. The Dunlap Institute is funded through an endowment established by the David Dunlap family and the University of Toronto.
Footnotes
- 13
- 14