


Abstract
We present Very Large Telescope/Spectrograph for INtegral Field Observations in the Near Infrared H- and K-band spectra of potential central stars within the inner 8''-by-8'' regions of 55 MIPSGAL "bubbles" (MBs), sub-arcminute circumstellar shells discovered in the mid-IR survey of the Galactic plane with Spitzer/MIPS. At magnitudes brighter than 15, we detect a total of 230 stars in the K band and 179 stars in the H band. We spectrally identify 145 stars in all but three MBs, with average magnitudes of 13.8 and 12.7 respectively, using spectral libraries and previous studies of near-IR stellar spectra. We also use tabulated intrinsic stellar magnitudes and colors to derive distances and extinction values, and to better constrain the classifications of the stars. We reliably identify the central sources for 21 of the 55 MBs, which we classify as follows: one Wolf–Rayet, three luminous blue variable candidates, four early-type (O to F), and 15 late-type (G to M) stars. The 21 central sources are, on average, one magnitude fainter than these in the most recent study of MBs, and we notice a significant drop in the fraction of massive star candidates. For the 34 remaining MBs in our sample, we are unable to identify the central sources due to confusion, low spectroscopic signal-to-noise ratio, and/or lack of detections in the images near the centers of the bubbles. We discuss how our findings compare with previous studies and support the trend, for the most part, between the shells' morphologies in the mid-IR and central sources spectral types.
Export citation and abstract BibTeX RIS
1. Introduction
The MIPSGAL "bubbles" (MBs) are 428 extended, resolved, disk- and ring-like envelopes that have been discovered from visual inspection of the Spitzer/MIPSGAL 24 μm mosaic images of the Galactic plane (Carey et al. 2009; Mizuno et al. 2010). The MBs are scattered throughout the Galaxy ranging in sizes, fluxes, and morphologies. At the time of their discovery ∼15% of MBs were already identified as planetary nebulae (PNe) or associated with a spectrally identified central source. Most of these known MBs were previously found in the MASH Catalog of PNe (Parker et al. 2006) and in the Catalog of Galactic PNe (Kohoutek 2001). A few others were associated with central sources identified as massive star candidates (e.g., Wolf-Rayet (WR), luminous blue variables (LBVs)).
A significant fraction of some types of evolved, massive, and/or hot stars are yet to be found in the Galaxy (Shara et al. 1999). For instance, about 6000 WR stars are expected to be located within our Galaxy (Shara et al. 1999; van der Hucht 2001), but only ∼500 have been observed (van der Hucht 2006; Mauerhan et al. 2011). Similarly, only a few tens of LBV stars are known or identified as candidates (Clark et al. 2005). Although they represent a small fraction of the stars in our Galaxy, they play an important role in the chemical and mechanical evolution of the interstellar medium (ISM). Their strong winds, radiation, and mass outflows are important contributors to the dynamics in galaxies. Evolved stars are also the main sources of dust formation: low-mass red giants and asymptotic giant branch stars, as well as massive stars exploding into supernovae are believed to be the main contributors of dust and heavy elements in the ISM (e.g., Jones 2005). Given that some of the known MBs are associated with these, observing the remaining MBs would have the strong potential to reveal more of the "missing" massive and evolved stars and have a better understanding of their impact on galaxies.
As of 2014, the year of the most recent paper identifying central sources of MBs, a total of 128 central sources were identified (e.g., Gvaramadze et al. 2009, 2010; Wachter et al. 2010, 2011; Mauerhan et al. 2011; Flagey et al. 2014; Nowak et al. 2014). In this paper, we extend the attempt to identify central sources of all MBs with a sample of 55 MBs using observations from the European Southern Observatory (ESO) Very Large Telescope (VLT) located on Cerro Paranal using the Spectrograph for INtegral Field Observations in the Near Infrared (SINFONI) (Eisenhauer et al. 2003; Bonnet et al. 2004). These 55 MBs represent a significant fraction of the remaining 300 (∼70%) MBs still unclassified. Our aim here is to test the main results observed by Nowak et al. (2014) about the whole sample of 428 MBs: (1) a correlation between the spectral types of the central sources and the MB morphologies, and (2) the fainter the magnitudes of the central sources, the lower the fraction of massive star candidates identified at the centers of the MBs.
The paper is organized as follows. In Section 2 we detail the observations and data reduction. In Section 3 we present our results, starting with the identification of the spectral types using the most prominent spectral features, and comparing our spectra to those in published libraries. We then discuss the natures of the circumstellar shells in Section 4, and address the trends revealed in Nowak et al. (2014). Our conclusions are listed in Section 5.
2. Observations
Data were acquired in service mode during UT 2014 May 23–June 7 using VLT/SINFONI observations. We used two of SINFONI's four gratings providing spectral resolutions  and 4000 in the H and K bands, respectively, with the field of view of 8'' by 8'' (without adaptive optics).
The targets are 55 MBs that have not been previously classified as PNe, whose central sources were unidentified at the time of the Period 93 Call for Proposals (UT 2013 October 01), and appeared to contain at least one potential central source detected in the near-IR images of the Two Micron All-Sky Survey (2MASS, Skrutskie et al. 2006) or the UKIRT Infrared Deep Sky Survey (UKIDSS, Warren et al. 2007). A subsample of eight are shown in their mid-IR colors in Figure 1. Our goal was to observe and identify as many potential central sources as possible to magnitudes as faint as 15 in H band and 14 in K band using an integral field unit (IFU) rather than a slit.

Figure 1. Three-color images (red is MIPS 24 μm, green is IRAC 8 μm, blue is IRAC 4 μm) for a sub-sample of targets. Each image is about 2 5 by 25. The color scale of each band differs in each image so to enhance the local structure.
Download figure:
Standard image High-resolution imageWe used an Object–Sky nodding strategy with at least two repeats on the Object position before nodding to the Sky position, and with at least two visits to both the Object and Sky positions. A spectral cube is obtained by combining all the repeats at each position and for each visit. The number of spectral cubes thus obtained for each MB and in each band is between two and four. To allow for a greater area to be covered for each MB and thus increase the number of observed stars in each MB, we set the jitter parameter6 to 4''.
Standard stars classified as B9V or A0V were automatically observed by the ESO/VLT observers before or after each group of observations on target for telluric correction and photometric calibration.
Coordinates and other relevant information about the targets and the standards are given in Table 1. The depth of the observations is not homogeneous across the sample and is set based on 2MASS/UKIDSS magnitudes of candidate central sources toward each MB.
Table 1. Summary of the VLT/SINFONI Observations
| Target | Official Nomenclature | R.A. | Decl. | NDIT × DIT(s) | Depth | ||
|---|---|---|---|---|---|---|---|
| H band | K band | H band | K band | ||||
| MB3176 | MGE013.7674+00.5113 | 273.3858 | −16.7431 | 4 × 30 | 4 × 30 | 13.9 | 13.2 |
| MB3177 | MGE014.1175+00.0818 | 273.9533 | −16.6418 | 4 × 30 | 4 × 30 | 13.0 | 12.1 |
| MB3188 | MGE016.1870+00.1204 | 274.9381 | −14.8008 | 8 × 60 | 12 × 60 | – | – |
| MB3192 | MGE015.9772+00.2957 | 274.6756 | −14.9031 | 6 × 30 | 6 × 30 | 14.5 | 12.6 |
| MB3198 | MGE017.8635+00.3029 | 275.5857 | −13.2356 | 4 × 30 | 4 × 30 | 15.6 | 14.1 |
| MB3223 | MGE021.1661+00.9359 | 276.5916 | −10.0214 | 6 × 30 | 8 × 30 | 15.6 | 14.5 |
| MB3347 | MGE030.8778+00.6995 | 281.2997 | −1.5089 | 6 × 30 | 8 × 30 | 16.5 | 14.1 |
| MB3736 | MGE027.3837–00.3030 | 280.5935 | −5.0755 | 6 × 30 | 6 × 30 | 14.8 | 12.8 |
| MB3857 | MGE016.0748–00.9831 | 275.8921 | −15.4182 | 6 × 30 | 8 × 30 | 14.5 | 13.7 |
| MB4134 | MGE344.1647+00.2736 | 255.0832 | −41.8452 | 6 × 30 | 8 × 30 | – | – |
| MB4267 | MGE322.7706–00.2827 | 231.4997 | −57.0782 | 6 × 30 | 6 × 30 | 13.4 | 12.8 |
| MB4399 | MGE358.0306–01.9835 | 267.1884 | −31.6483 | 6 × 30 | 6 × 30 | – | 12.6 |
| MB4403 | MGE358.9297–01.9682 | 267.7129 | −30.8690 | 6 × 30 | 6 × 30 | 15.0 | 14.3 |
| MB4438 | MGE358.2247–01.0883 | 266.4100 | −31.0188 | 6 × 30 | 8 × 30 | 15.5 | 14.4 |
| MB4440 | MGE357.8413–01.5068 | 266.5952 | −31.5635 | 4 × 30 | 4 × 30 | 13.9 | 13.7 |
| MB4445 | MGE358.6632–01.3133 | 266.8992 | −30.7599 | 15 × 30 | 24 × 30 | 14.3 | 13.8 |
| MB4446 | MGE000.1495–01.0707 | 267.5423 | −29.3625 | 4 × 30 | 4 × 30 | 13.3 | 12.6 |
| MB4463 | MGE002.0597–01.0640 | 268.6437 | −27.7147 | 8 × 15 | 24 × 15 | 14.2 | 14.0 |
| MB4464 | MGE002.1529–01.0606 | 268.6920 | −27.6313 | 12 × 15 | 20 × 15 | 9.5 | 8.6 |
| MB4471 | MGE003.7722–01.1832 | 269.7235 | −26.2933 | 6 × 30 | 24 × 30 | 13.1 | 12.6 |
| MB4475 | MGE006.6636–01.1963 | 271.3123 | −23.7866 | 6 × 30 | 6 × 30 | 14.7 | 14.1 |
| MB4493 | MGE355.9806–00.5626 | 264.4900 | −32.6479 | 6 × 30 | 6 × 30 | 15.5 | 14.9 |
| MB4500 | MGE358.4431–00.8991 | 266.3549 | −30.7342 | 16 × 30 | 24 × 30 | 15.6 | 15.0 |
| MB4507 | MGE359.7168–00.7866 | 267.0068 | −29.5867 | 6 × 30 | 6 × 30 | 15.7 | 13.8 |
| MB4509 | MGE359.5783–00.8460 | 266.9830 | −29.7354 | 6 × 30 | 8 × 30 | 15.9 | 14.7 |
| MB4515 | MGE001.8560–00.4995 | 267.9772 | −27.6037 | 6 × 30 | 8 × 30 | 15.2 | 14.2 |
| MB4521 | MGE003.8299–00.1383 | 268.7501 | −25.7193 | 4 × 30 | 4 × 30 | 15.2 | 13.7 |
| MB4530 | MGE006.5849–00.0134 | 270.1467 | −23.2720 | 16 × 30 | 8 × 30 | 15.7 | 13.6 |
| MB4552 | MGE356.1446+00.0551 | 263.9774 | −32.1763 | 6 × 30 | 6 × 30 | 14.7 | 13.0 |
| MB4563 | MGE358.0813+00.8516 | 264.4090 | −30.1154 | 6 × 30 | 8 × 30 | 12.6 | 10.8 |
| MB4564 | MGE358.1556+00.7595 | 264.5449 | −30.1017 | 6 × 30 | 8 × 30 | – | – |
| MB4567 | MGE358.8066+00.8874 | 264.8209 | −29.4829 | 6 × 30 | 6 × 30 | 13.5 | 12.1 |
| MB4571 | MGE358.6886+00.1826 | 265.4362 | −29.9571 | 6 × 30 | 6 × 30 | 15.4 | 13.6 |
| MB4572 | MGE358.5500+00.7940 | 264.7543 | −29.7502 | 6 × 30 | 8 × 30 | 14.6 | 13.6 |
| MB4573 | MGE000.4283+00.2293 | 266.4365 | −28.4510 | 6 × 30 | 6 × 30 | 14.9 | 13.7 |
| MB4574 | MGE000.4174+00.7561 | 265.9199 | −28.1853 | 20 × 7 | 20 × 7 | – | – |
| MB4580 | MGE001.5278+00.9172 | 266.4198 | −27.1547 | 6 × 30 | 8 × 30 | 14.4 | 13.8 |
| MB4581 | MGE001.2693+00.7176 | 266.4609 | −27.4796 | 4 × 30 | 4 × 30 | 11.2 | 12.0 |
| MB4583 | MGE001.9964+00.1977 | 267.3840 | −27.1261 | 18 × 30 | 24 × 30 | 13.2 | 14.3 |
| MB4586 | MGE002.6241+00.7862 | 267.1807 | −26.2847 | 18 × 30 | 24 × 30 | 14.2 | 13.6 |
| MB4587 | MGE002.5275+00.7463 | 267.1628 | −26.3877 | 12 × 10 | 12 × 10 | 13.4 | 12.7 |
| MB4589 | MGE005.2640+00.3777 | 269.0558 | −24.2206 | 6 × 30 | 8 × 30 | 14.9 | 14.4 |
| MB4590 | MGE004.7474+00.8117 | 268.3582 | −24.4471 | 6 × 30 | 8 × 30 | 14.5 | 14.3 |
| MB4599 | MGE007.8744+00.7501 | 270.1222 | −21.7737 | 6 × 30 | 6 × 30 | 14.8 | 13.9 |
| MB4607 | MGE008.9408+00.2533 | 271.1513 | −21.0908 | 6 × 30 | 6 × 30 | 14.8 | 14.0 |
| MB4649 | MGE358.8653+01.2863 | 264.4700 | −29.2210 | 6 × 30 | 8 × 30 | 15.2 | 14.5 |
| MB4659 | MGE000.9362+01.3963 | 265.6118 | −27.4077 | 6 × 30 | 8 × 30 | 14.9 | 14.2 |
| MB4668 | MGE003.3093+01.0343 | 267.3366 | −25.5702 | 18 × 30 | 24 × 30 | 15.6 | 14.5 |
| MB4669 | MGE003.2860+01.3815 | 266.9937 | −25.4104 | 6 × 30 | 6 × 30 | 14.5 | 13.9 |
| MB4670 | MGE003.5015+01.3316 | 267.1637 | −25.2518 | 6 × 30 | 6 × 30 | 13.9 | 13.2 |
| MB4675 | MGE002.8529+01.4515 | 266.6787 | −25.7456 | 4 × 30 | 4 × 30 | 13.9 | 13.1 |
| MB4680 | MGE005.1018+01.7971 | 267.6276 | −23.6395 | 6 × 30 | 6 × 30 | 14.7 | 13.8 |
| MB4690 | MGE006.7839+01.1299 | 269.1782 | −22.5288 | 6 × 30 | 24 × 30 | 14.0 | 13.1 |
| MB4718 | MGE000.7879+02.9358 | 264.0597 | −26.7142 | 4 × 30 | 4 × 30 | 13.7 | 13.0 |
| MB4729 | MGE003.8210+02.6723 | 266.0837 | −24.2838 | 6 × 30 | 6 × 30 | 12.1 | 11.4 |
Note. Usual and official names, coordinates, and exposure times used in both the H and K bands for the 55 MBs in our sample. NDIT is the number of DIT (detector integration time) repetitions. The depth columns give the faintest magnitudes of a star that we identified. A "–" means that no star was identified.
Only a portion of this table is shown here to demonstrate its form and content. A machine-readable version of the full table is available.
Download table as: DataTypeset image
2.1. Data Reduction
Each data set went through standard processing using the ESO Recipe Execution (EsoRex7 ) tool, which configured and executed common pipeline library-based recipes. Specifically, we used EsoRex to make dark-field, optical-distortion, flat-field, and jitter corrections. The final products of EsoRex are individual spectral cubes, one for each Object and Sky position, and a master cube that combined all nodding positions and removed the Sky from the Object.
We then used SExtractor (Bertin & Arnouts 1996) on the images obtained by stacking each individual spectral cube into a two-dimensional panchromatic image to identify the stars and measure basic parameters in each data set. A table consisting of the stars' coordinates, integrated counts, and full widths at half maximum (FWHMs) was then generated for each individual spectral cube. The FWHM was needed in order to give us a good estimate of the seeing during each observation.
We then removed from the tables the sources in the Object position that are significantly contaminated by sources in the Sky position. We kept only the sources for which the contamination, in terms of integrated counts, is smaller than 10%. This corresponded to pruning about 8% of the sources detected by SExtractor. The spectrum of each of these stars was extracted within a radius given by its FWHM/2.
If a given star was present in more than one Object spectral cube, i.e., if two positions given by SExtractor were within 0 3 of each other, we averaged the extracted spectra. In some cases, there was a difference in flux, though not in spectral shape, between each observation of a star in a given band due to variations in the weather conditions. This could also, in part, explain the slight mismatch of the continuum observed in some cases between the H and K bands, which were observed independently. After subtracting the Sky cubes from the Object cubes, residual sky lines were still detected. To remove these residual lines, we measured the median value of each Sky-subtracted Object spectral cube. We did this at each wavelength, away from the edges of the field of view, and away from any detected stars. We then subtracted it from each spectrum extracted within that cube.
For each extracted spectrum, we then performed a telluric correction and photometric calibration following the method detailed by Vacca et al. (2003). For each star, we chose the standard star that was observed closest in time and with a very similar airmass (AM) to that of our science target (i.e.,  ). Since each standard was classified as B9V or A0V, we were able to use a Vega model8
to build the telluric correction. For each standard, we scaled both the lines and continuum components of the Vega model. To scale the lines, we used the equivalent widths of the Brackett lines at 2.166, 1.737, 1.681, 1.641, and 1.556 μm, and applied a constant scaling factor to the lines component of the Vega model. After scaling the Vega spectrum to the standard magnitude from SIMBAD,9
we corrected for any shift in wavelength between the standard and Vega, by minimizing the residuals in the resulting telluric-corrected spectrum over a specific wavelength range. When applying the telluric correction to the science spectrum, we also corrected for any shift in wavelength between the science and the standard spectrum.
). Since each standard was classified as B9V or A0V, we were able to use a Vega model8
to build the telluric correction. For each standard, we scaled both the lines and continuum components of the Vega model. To scale the lines, we used the equivalent widths of the Brackett lines at 2.166, 1.737, 1.681, 1.641, and 1.556 μm, and applied a constant scaling factor to the lines component of the Vega model. After scaling the Vega spectrum to the standard magnitude from SIMBAD,9
we corrected for any shift in wavelength between the standard and Vega, by minimizing the residuals in the resulting telluric-corrected spectrum over a specific wavelength range. When applying the telluric correction to the science spectrum, we also corrected for any shift in wavelength between the science and the standard spectrum.
After the photometric calibration, there was a discrepancy between the magnitudes measured from the SINFONI spectra and those tabulated in 2MASS and UKIDSS. On average, our measurements were brighter by about 0.3 magnitude in both the H and K bands. Since we were cross-matching on a small (8'' by 8'') field of view, and we found a non-negligible offset (∼1'') in the astrometry of the SINFONI data due to the inaccuracy in the VLT's pointing, we cannot be completely certain of every 2MASS or UKIDSS match. Therefore, we used the magnitudes measured in the SINFONI data, after subtracting the 0.3 mag discrepancy. This shift corresponds to less than 15% of the uncertainty in distance for each.
In all spectral cubes, there were some bad pixels due to a blind spot in the detector that ran through the center of the field at wavelengths from 1.602 to 1.608 μm in the H band and from 2.140 to 2.148 μm in the K band. All standards were taken at the center of the field which, in turn, affected all the telluric-corrected and photometric-corrected science spectra. The frames corresponding to these wavelengths were removed from the extraction. This can be seen in all spectra as the two gaps in the continuum in the aforementioned wavelength intervals.
Within the 55 MBs in this program a total of 179 stars were detected with magnitudes brighter than 15 in the H band, and 230 stars were detected with a magnitude brighter than 15 in the K band. We combined the spectra of the H and K bands if their positions were within 03 of each other. We retained a total of 145 individual stars (i.e., about three per MB on average), whose spectra all exhibited spectral features that can be used for identification.
3. Results
The faintest magnitudes for the 145 stars that we spectrally identify are 16.5 and 15.0 in the H and K bands, respectively. Out of those 145 stars, 125 have spectra in both the H and K bands and 19 have spectra in the K band only. The 145 stars are categorized into three groups: (1) four stars with spectra dominated by emission lines, (2) 16 early-type stars (O–G) with spectra dominated by the hydrogen Brackett series absorption, and (3) 125 late-type stars (G–M) with spectra exhibiting CO bandhead absorption features at 2.29 μm and beyond. The spectra are shown in Figures 2–4.

Figure 2.
Near-IR spectra (H band on top, K band at the bottom) of some of the late-type stars. Spectra are normalized to their average continuum values. The most prominent lines are indicated by vertical dashed lines of different colors for different species. All spectra of the late-type stars can be found in the extended figure. (An extended version of this figure is available.)
Download figure:
Standard image High-resolution image
Figure 3. Near-IR spectra (H band on top, K band at the bottom) of some of the early-type stars. Spectra are normalized to their average continuum values. The most prominent lines are indicated by vertical dashed lines of different colors for different species.
Download figure:
Standard image High-resolution image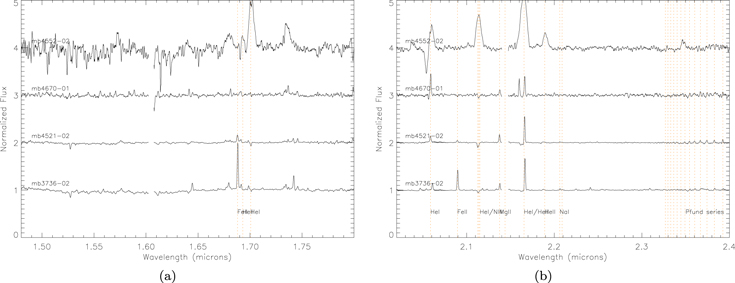
Figure 4. Near-IR spectra (left: H band; right: K band) of the emission-line stars. Spectra are normalized to their average continuum values. The most prominent lines are indicated by vertical dashed lines of different colors for different species.
Download figure:
Standard image High-resolution image
In this section, we present identifications using the SINFONI data. We name each star using the name of the MB in lower case (e.g., mb3736) and an incremental integer that starts at one. For instance, the six stars that we extract toward MB3736 are named mb3736-01 to mb3736-06.
3.1. Late-type Stars: G, K, and M Giants
A total of 125 stars in our sample have spectra exhibiting the CO ( bandheads) absorption features in the K band at 2.29 μm and beyond (see Figure 2), which identify them as late-type giants or supergiants. Other metal-absorption features such as Mg i at 1.71 μm, Na i at 2.21 μm, and Ca i at 2.26 μm can be seen although they are significantly weaker and not primarily used in classifying late-type stars. The H-band spectra are rich in metal-line-absorption, and in about one-third of the cases the CO (
 bandheads) and Mg i absorption features are significantly above the noise.
Figer et al. (2006) and Davies et al. (2007) show that there is an anticorrelation between the equivalent widths of the CO ( bandheads) feature at 2.29 μm (
 ) and the temperatures of the stars. We measure the equivalent widths of the CO feature as Figer et al. (2006) and Davies et al. (2007) suggest and use their techniques to infer the spectral types of the stars. Since their results show a degeneracy between giants and supergiants, we have to consider both luminosity classes. For most stars, the classifications determined using either the Figer et al. or Davies et al. methods agree within a few sub-types, with the former leading to slightly later types.
Once we have a giant and supergiant classification for each star, we test their validities by deriving the distances and the extinctions along the line of sight using intrinsic colors of late giants and supergiants (Cox 2000), the interstellar extinction curve from Cardelli et al. (1989), and the H and K magnitudes derived from our observations. The results for a subsample of 10 stars are listed in Table 2. In most cases, those distances and extinction values allow us to rule out either the giant or supergiant interpretation. On average, we expect distances of 10 kpc or less and about 2 mag kpc−1 of visual extinction using  and an average interstellar gas density of 1 cm
 along the lines of sight (also see Whittet 2003). The cases where the extinction is between 0.5 and 5.0 mag kpc−1 are indicated in bold face in the tables. This range is used to account for the uncertainties in the colors. This constraint on the extinction leads to a few instances where a given spectral type lead to a star being slightly beyond 10 kpc. While unlikely, we decide to keep them in bold face in the tables.
Table 2. Late-type Star Results
| Object |

|
Supergianta | Supergiantb | Gianta | Giantb | |||||||||
|---|---|---|---|---|---|---|---|---|---|---|---|---|---|---|
| a | b | Type | d | Av | Type | d | Av | Type | d | Av | Type | d | Av | |
| mb3176-03 | 10.6 | 23.1 | G6–G7 | 122.1 | 3.9 | K0–K1 | 131.4 | 3.8 | K1–K2 | 7.7 | 3.9 | K3–K4 | 12.0 | 3.7 |
| mb3177-02 | 8.7 | 23.3 | G5–G6 | 72.6 | 4.5 | K0–K1 | 79.4 | 4.4 | G9–K0 | 3.7 | 4.5 | K3–K4 | 7.2 | 4.3 |
| mb3192-01 | 18.4 | 34.3 | K2–K3 | 90.5 | 10.3 | K3–K4 | 108.2 | 10.4 | M2–M3 | 18.4 | 9.8 | M3–M4 | 21.5 | 9.7 |
| mb3192-03 | 13.8 | 24.8 | G8–G9 | 46.1 | 8.3 | K0–K1 | 48.3 | 8.2 | K3–K4 | 4.4 | 8.1 | K4–K5 | 5.7 | 8.0 |
| mb3198-02 | 15.6 | 27.1 | K0–K1 | 169.5 | 7.9 | K1–K2 | 177.0 | 7.9 | K5–M0 | 25.4 | 7.6 | K5–M0 | 25.4 | 7.6 |
| mb3223-02 | 11.7 | 31.4 | G7–G8 | 139.9 | 3.9 | K2–K3 | 177.6 | 3.7 | K2–K3 | 10.7 | 3.7 | M1–M2 | 31.2 | 3.2 |
| mb3223-03 | 14.1 | 32.9 | G9–K0 | 224.8 | 5.4 | K2–K3 | 277.4 | 5.4 | K4–K5 | 27.4 | 5.2 | M2–M3 | 56.4 | 4.8 |
| mb3347-01 | 11.3 | 24.4 | G6–G7 | 122.1 | 13.1 | K0–K1 | 131.5 | 13.0 | K1–K2 | 7.7 | 13.1 | K4–K5 | 15.5 | 12.8 |
| mb3857-01 | 16.6 | 28.5 | K0–K1 | 175.6 | 3.7 | K1–K2 | 183.4 | 3.7 | M0–M1 | 31.8 | 3.3 | M0–M1 | 31.8 | 3.3 |
| mb3857-02 | 12.1 | 26.6 | G7–G8 | 37.1 | 5.3 | K1–K2 | 41.1 | 5.1 | K2–K3 | 2.8 | 5.1 | K5–M0 | 5.9 | 4.9 |
Notes. In bold is our suggested classification, along with the distance (in kpc) and visual extinction (in mag) derived for that type.  is measured in Å. The "–" under classification indicates that the equivalent width measured falls outside the range for which either method could derive a classification. The "–" under distance or extinction indicates that the value could not be computed.
Only a portion of this table is shown here to demonstrate its form and content. A machine-readable version of the full table is available.
Download table as: DataTypeset image
For 19 late-type stars, the H-band spectra are not extracted from the SINFONI data because the signal is too weak, but both H and K magnitudes are needed to get distances and extinction. To overcome this issue, we look for detections in the UKIDSS data and use their H and K magnitudes for these stars. Out of those 19 stars, six are not found in the UKIDSS data (see Section 2); thus we cannot confirm the spectral types derived from the methods of Figer et al. (2006) and Davies et al. (2007).
We find distance and extinction values that are in the range of our expectations for 46 late-type giants. For these stars, we find that using the Davies et al. (2007) method, 32% are G stars, 54% are K stars, and 13% are M stars. Similarly, using the Figer et al. (2006) method, 17% are G stars, 67% are K stars, and 17% are M stars. The differences are usually limited to a few sub-types. We are unable to determine spectral types for the remaining late-type stars. Some are not assigned a spectral type, mainly due to the equivalent width of the CO bandhead either being too small or too large, causing them to fall out of the range that either Figer et al. (2006) or Davies et al. (2007) derived. The remainder have CO equivalent widths in the range found by Figer et al. and Davies et al., but the derived distances and extinction values for both giants and supergiants do not fit within the limits we define.
We examine in more detail the late-type stars that are candidate central sources in Section 4.
3.2. Early-type Stars: O to F Stars
A total of 16 stars in our sample have spectra exhibiting hydrogen and/or helium transitions in absorption, which are characteristics of early-type (i.e., O to F) stars. Spectral classification is done by measuring line widths and strengths and then comparing them to those of early-type stars published by Meyer et al. (1998). We compute the distance and extinction for each star using the intrinsic colors of early giants and supergiants from Pickles (1998) and Martins & Plez (2006), focusing on five spectral types: O5, B1, A0, F0, and G0. Similarly to the late-type stars, this allows us to rule out certain spectral types. A summary of the results is shown in Tables 3 and 4.
Table 3. Early-type Star Results, Assuming Giants
| Target | Meyer et al. | Colors-based best-match | |||||||||
|---|---|---|---|---|---|---|---|---|---|---|---|
| Best | O5III | B1III | A0III | F0III | G0III | ||||||
| Match | d | AV | d | AV | d | AV | d | AV | d | AV | |
| mb3736-04 | O/BIII | 26.0 | 11.9 | 7.3 | 13.1 | 1.6 | 12.6 | 1.3 | 12.5 | 1.3 | 12.4 |
| mb3736-01 | O/BIII | 40.8 | 4.7 | 11.5 | 5.9 | 2.6 | 5.4 | 2.1 | 5.3 | 2.1 | 5.2 |
| mb3198-01 | BI | 10.5 | 5.9 | 2.9 | 7.1 | 0.7 | 6.6 | 0.5 | 6.5 | 0.5 | 6.4 |
| mb3177-01 | BI | 8.7 | 8.6 | 2.4 | 9.8 | 0.5 | 9.3 | 0.4 | 9.3 | 0.4 | 9.1 |
| mb4493-01 | A/FIII | 59.9 | 2.4 | 16.8 | 3.6 | 3.8 | 3.1 | 3.1 | 3.0 | 3.1 | 2.9 |
| mb4475-01 | A/FIII | 77.8 | 3.2 | 21.9 | 4.3 | 4.9 | 3.9 | 4.0 | 3.8 | 4.0 | 3.6 |
| mb3176-02 | A/FIII | 38.6 | 5.7 | 10.9 | 6.9 | 2.4 | 6.4 | 2.0 | 6.4 | 2.0 | 6.2 |
| mb4580-01 | A/FIII | 71.0 | 2.8 | 20.0 | 4.0 | 4.4 | 3.5 | 3.6 | 3.5 | 3.7 | 3.3 |
| mb4515-05 | A/FI/III | 74.6 | 4.6 | 21.0 | 5.8 | 4.7 | 5.3 | 3.8 | 5.2 | 3.9 | 5.1 |
| mb4669-01 | A/FI/III | 74.7 | 2.7 | 21.0 | 3.9 | 4.7 | 3.4 | 3.8 | 3.4 | 3.9 | 3.2 |
| mb4515-01 | A/FI | 54.6 | 4.3 | 15.3 | 5.4 | 3.4 | 5.0 | 2.8 | 4.9 | 2.8 | 4.7 |
| mb4589-01 | A/FI | 94.6 | 2.3 | 26.6 | 3.5 | 5.9 | 3.0 | 4.9 | 3.0 | 4.9 | 2.8 |
| mb4500-05 | A/FI | 122.9 | 2.8 | 34.6 | 4.0 | 7.7 | 3.5 | 6.3 | 3.5 | 6.4 | 3.3 |
| mb4607-03 | A/FI | 74.5 | 0.5 | 21.0 | 1.7 | 4.7 | 1.2 | 3.8 | 1.2 | 3.9 | 1.0 |
| mb4463-01 | GI/III | 82.9 | 0.9 | 23.3 | 2.0 | 5.2 | 1.6 | 4.3 | 1.5 | 4.3 | 1.3 |
| mb4590-01 | GI/III | 102.1 | −0.3 | 28.7 | 0.8 | 6.4 | 0.4 | 5.2 | 0.3 | 5.3 | 0.1 |
Note. Distances (in kpc) and visual extinctions (in mag) derived from the measured magnitudes and giants' intrinsic colors in the H and K bands. The spectral type derived from comparison with Meyer et al. (1998) is indicated in the first column. Values in bold are the most plausible.
Download table as: ASCIITypeset image
The absorption of He i at 1.70 μm is the dividing factor between O/B stars and A/F stars. The strengthening of the He i absorption features at 1.70 and 2.11 μm with the weakening of the H absorption features indicates a higher luminosity class. Among the early-type stars, only mb3736-04, mb3736-01, mb3198-01, and mb3177-01 show He i absorption. For mb3736-04 and mb3736-01, the absence or very weak presence of H absorption features, combined with line strengths and widths of helium absorption, seems to indicate a spectral type of O/B III (e.g., HR1899/HR1552 Meyer et al. 1998). The distance and extinction values derived for mb3736-04 are plausible for B III and B I. For mb3736-01, the inferred distance and extinction values agree with a B–G III spectral type. For mb3198-01 and mb3177-01, we find that a spectral type of B5 I (e.g., HR2827 Meyer et al. 1998) is the most likely from visual comparison of the spectra. The derived distance and extinction values agree with several spectral types as indicated in bold in Tables 3 and 4, though an O/B I/III type seems the most likely for both stars.
Table 4. Early-type Star Results, Assuming Supergiants
| Target | Meyer et al. | Colors-based best-match | |||||||||
|---|---|---|---|---|---|---|---|---|---|---|---|
| Best | O5I | B1I | A0I | F0I | G0I | ||||||
| Match | d | AV | d | AV | d | AV | d | AV | d | AV | |
| mb3736-04 | O/BIII | 32.4 | 11.9 | 24.9 | 12.9 | 34.1 | 12.7 | 45.6 | 12.4 | 66.6 | 12.0 |
| mb3736-01 | O/BIII | 50.9 | 4.7 | 39.1 | 5.7 | 53.6 | 5.5 | 71.6 | 5.2 | 104.7 | 4.8 |
| mb3198-01 | BI | 13.1 | 5.9 | 10.0 | 6.9 | 13.7 | 6.7 | 18.4 | 6.4 | 26.9 | 6.0 |
| mb3177-01 | BI | 10.8 | 8.6 | 8.3 | 9.7 | 11.4 | 9.4 | 15.2 | 9.1 | 22.2 | 8.7 |
| mb4493-01 | A/FIII | 74.7 | 2.4 | 57.4 | 3.4 | 78.5 | 3.2 | 105.0 | 2.9 | 153.4 | 2.5 |
| mb4475-01 | A/FIII | 97.0 | 3.2 | 74.6 | 4.2 | 102.1 | 3.9 | 136.5 | 3.6 | 199.4 | 3.2 |
| mb3176-02 | A/FIII | 48.1 | 5.7 | 37.0 | 6.8 | 50.6 | 6.5 | 67.7 | 6.2 | 98.9 | 5.8 |
| mb4580-01 | A/FIII | 88.5 | 2.8 | 68.0 | 3.9 | 93.1 | 3.6 | 124.5 | 3.3 | 181.9 | 2.9 |
| mb4515-05 | A/FI/III | 93.0 | 4.6 | 71.5 | 5.6 | 97.8 | 5.3 | 130.8 | 5.1 | 191.2 | 4.7 |
| mb4669-01 | A/FI/III | 93.2 | 2.7 | 71.6 | 3.8 | 98.0 | 3.5 | 131.0 | 3.2 | 191.5 | 2.8 |
| mb4515-01 | A/FI | 68.0 | 4.3 | 52.3 | 5.3 | 71.6 | 5.0 | 95.7 | 4.7 | 139.8 | 4.3 |
| mb4589-01 | A/FI | 118.1 | 2.3 | 90.7 | 3.4 | 124.1 | 3.1 | 166.0 | 2.8 | 242.6 | 2.4 |
| mb4500-05 | A/FI | 153.3 | 2.8 | 117.8 | 3.9 | 161.2 | 3.6 | 215.5 | 3.3 | 314.9 | 2.9 |
| mb4607-03 | A/FI | 92.9 | 0.5 | 71.4 | 1.6 | 97.7 | 1.3 | 130.7 | 1.0 | 191.0 | 0.6 |
| mb4463-01 | GI/III | 103.4 | 0.9 | 79.4 | 1.9 | 108.7 | 1.6 | 145.4 | 1.3 | 212.4 | 0.9 |
| mb4590-01 | GI/III | 127.3 | −0.3 | 97.8 | 0.7 | 133.9 | 0.4 | 179.0 | 0.1 | 261.6 | −0.3 |
Note. Distances (in kpc) and visual extinctions (in mag) derived from the measured magnitudes and supergiants' intrinsic colors in the H and K bands. The spectral type derived from comparison with Meyer et al. (1998) is indicated in the first column. Values in bold are the most plausible.
Download table as: ASCIITypeset image
The remaining 12 stars show no He i absorption in their spectra. The distinguishing factor when determining whether the star is a giant or supergiant is usually the widths of the absorption features. For mb4493-01, mb4475-01, and mb4580-01, very broad absorption features of the Brackett series are seen, with estimated widths of 10 Å or greater. These widths better match those of A/F III stars (e.g., HR5291/HR21 Meyer et al. 1998). The most likely combinations of distances and extinction values are found for A/F/G III stars. The spectrum of mb3176-02 shows the same features as those of the previous three stars, but the distance and extinction values could also match a B III type. Since the spectrum shows no He i absorption, we can rule out O and B types, and lean toward an A III type.
For mb4515-05, we were unable to acquire an H-band spectrum with sufficient signal-to-noise ratio (S/N) for classification. It is difficult to determine a spectral class based solely on the K-band spectrum since only one of the Brackett series absorption occurs in this band (Brγ at 2.166 μm). The measured width of the Brγ line falls within a range that corresponds to either a giant or supergiant. We do not detect any He i absorption in the K band so we rule out O and B spectral types. For this star only, we used the UKIDSS H and K magnitudes of 14.75 and 13.85, respectively, instead of those derived from our SINFONI data, to infer distances and extinctions, which suggest an A–G III type.
For mb4669-01, mb4515-01, mb4589-01, mb4607-03, and mb4500-05, the H absorption lines are noticeably narrower, with widths of 7 Å or less. These narrow lines are preferentially found in the spectra of A/F supergiants (e.g., HR3975/HR1865 Meyer et al. 1998). However, in every case, the distances and extinctions derived with such classifications are not plausible, as we find distances of 60 kpc or more with less than 10 mag of visual extinction. For all these stars except mb4607-03, more likely classifications are A/F giants, though the extinctions toward some of these stars seem weaker than expected.
The last two stars, mb4463-01 and mb4590-01, have weak absorption lines and their spectra have low S/Ns. By comparing lines widths and strengths to published spectra, we infer that the most probable classifications would be G I/III (e.g., HR8232/HR4883 Meyer et al. 1998). For both mb4463-01 and mb4590-01, no classification leads to reasonable values of extinction. The possibility of both of these stars being of earlier spectral type (e.g., A I/III) would slightly disagree with the classification inferred from Meyer et al. (1998) due to a noticeable drop in strengths of the H absorption lines compared to the rest of the stars in this group. However we cannot rule out that possibility. We also note that no CO absorption features are detected at 2.29 μm and beyond in the spectra of these two stars, which rules out later spectral types.
3.3. Emission-line Stars
Four stars exhibit emission lines in their spectra: mb3736-02, mb4521-02, mb4670-01, and mb4552-02. These are all new candidate massive stars.
Only one, mb4552-02, exhibits strong, broad emission lines which are an indication of intense stellar winds common in WR stars. In this case, emission is dominated by helium and nitrogen lines, leading to a WN classification. We derived the sub-type based on line equivalent width ratios used as classification diagnostics by Crowther et al. (2006). Specifically, we measure the equivalent width ratio between the He ii (2.19 μm) and the He ii+Brγ (2.17 μm) obtaining a value of 0.19. We also measure the equivalent width of He i (1.70 μm) and He i+N iii (2.11 μm) determining values of 51 Å and 48 Å, respectively. These values, in most cases, are closest in agreement with the sub-type WN8o, where the "o" signifies no hydrogen. At 2.058 μm, the spectrum of mb4552-02 exhibits a strong P Cygni profile. We measure the widths of the emission lines and, taking into account the resolution of the instrument, derive a stellar wind value of  , which agrees well with the typical velocities of
  for WN8 stars (Hamann et al. 2006; Crowther 2007). Using absolute K magnitudes of typical WR stars from Crowther et al. (2006) along with the apparent K magnitude measured from our data, we calculate a distance of 12.6 kpc. The distance is greater than our nominal limits; however, we are able to see through the Galactic plane in some directions. That distance leads to a physical shell size of 1.28 pc which is typical for WR stars. Low-mass WR stars (denoted [WR]) exhibit spectral features similar to those of regular WR stars, though they are much fainter (
 , Leuenhagen et al. 1996; Parker & Morgan 2003). If that is the correct interpretation, MB4552 would be significantly closer, at about 3 kpc from the Sun.
The remaining three stars, mb3736-02, mb4521-02, and mb4670-01, exhibit narrow emission lines caused by typical stellar wind velocities of  . There is no classification scheme based on the equivalent width measurement of features for these spectra. We use previously published work to identify these as Be/B[e]/LBV candidates. Observations of Be and B[e] stars and LBVs by Wachter et al. (2010, 2011), and Morris et al. (1996) have indeed shown that those types of stars are extremely similar in terms of their near-IR spectra (e.g., metal lines), although they are very different in nature. For mb3736-02 and mb4521-02, we notice the Pfund emission series at 2.3 μm and longer. Unfortunately, due to the bad pixels that we have removed, we only detect one line in the Mg doublet at 2.138 and 2.144 μm; however, we assume that the Mg ii emission at 2.138 μm is real. In both cases, the most prominent emission line at 1.712 μm is most likely Fe ii with other nearby features being He i. Both stars show relatively similar line strengths throughout, except that the Fe ii emission lines in mb3736-02 are much more prominent. This suggests that the latter is in its quiescent state or visual minimum (see e.g., Wachter et al. 2010). For mb4670-01, we notice an absence of Fe ii emission lines. As with the previous two stars/spectra, we notice the Mg ii line. The Pfund series is slightly harder to see as the strengths of the lines do not surpass the noise by much. We notice a P Cygni profile at 2.058 μm, which is not uncommon in LBVs as they have noticeable stellar winds, though not as strong as those in WR stars.
4. Discussion
In this section we summarize our identifications of candidates for the central source in each MB (also see Table 6). We then discuss our results in the context of previously published studies of MBs.
4.1. Identifying the Central Sources
It is possible that some stars at the origins of the shells are no longer near the centers of their nebulae, especially if they were in binary systems. However, given the high degree of spherical symmetry of the MBs we assume hereafter that, even if a binary system was at the origin of a shell, at least one member of the system is still located at its center and responsible for its brightness. To determine the most likely candidate central source, we determine what star lies at or near the geometric center of the 24 μm circumstellar envelope. We do this by comparing the VLT/SINFONI stacked spectral cubes, the UKIDSS or 2MASS images, and the 24 μm Spitzer/MIPS images of each MB. The position of each geometric center is estimated using DS9 tools and the 24 μm image. We then use the UKIDSS or 2MASS images to identify the closest star to that position. We finally use the pattern of stars around that candidate to identify it in the VLT/SINFONI data. Based on this comparison, we place the central source candidate(s) for each MB into one of five different categories (see Table 6).
The 21 MBs at the centers of which we identify single clear candidates are placed in "Category A—Very likely." For six other MBs, we find stars that lie within close proximity (∼1''), but not exactly at the centers of the MBs. Those MBs define the "Category B—Possible." The six MBs in "Category C—Confusion," have multiple stars near their centers. We detect at least one star near the centers of 14 MBs in either VLT/SINFONI or UKIDSS data but are unable to identify their spectral types. Those MBs define the "Category D—Spectral type unknown." The last category, "Category E—No star detected near the center," contains the remaining eight MBs that showed no stars within 1'' of their centers in both the UKIDSS images and our VLT/SINFONI observations. In Table 6 we also indicate the distances inferred to the selected central sources and use them to derive the physical sizes of the mid-IR shells. We discuss those in the subsequent paragraphs.
A recent study by Ingallinera et al. (2015) aimed to characterize the natures of MBs using radio observations from 169 unclassified MBs. Eleven MBs are in common between our samples; however, for seven of them, the authors were unable to calculate the spectral index and did not resolve them, which left only four to produce useful information. Ingallinera et al. (2015) showed that the nature derived from radio observations for MB3736 and MB4552 is consistent with the nature of the central sources we identified in Table 6. The other two, MB4589 and MB4607, do not agree with any of the possible central sources that we listed. Ingallinera et al. (2015) showed that both MBs have a typical radio morphology of PNe, therefore, it is not possible that the stars we suggested as possible central sources are responsible for the circumstellar envelopes. Since they observed a radio shell, a hot ionizing star (i.e., no later than a B3) would be needed at their centers. It could be that we are observing binary systems with a hot, small, ionizing star and a cool giant, but the high degree of symmetry in the MBs makes this hypothesis weak. Also, if these MBs are PNe, their shells could be ionized by [WR] stars or white dwarfs, both which would be too faint to detect in our observations. Considering that MB4589 and MB4607 are not in "Category A," this does not affect our overall results.
4.2. Comparison to Previous Studies
The distribution of types of central sources that we confidently identify differs significantly from those of previous studies. Wachter et al. (2010, 2011) observed a total of 71 stars at the center of 62 MIPSGAL bubbles and determined the central sources for 42 of those MBs. Flagey et al. (2014) observed 14 MBs and determined or confirmed the central source spectral types of all of them. Categorizations and percentages of LBV, WR, and O/B/A (super)giant candidates for all studies are shown in Table 5. We find a much lower fraction of O/B/A (super)giants, LBV, and WR candidates among the central sources that we identify. The fractions of LBV, WR and O/B/A (super)giants candidates derived here are only those in category A. If no additional LBV, WR, or O/B/A stars are found in the remaining 34 MBs, the fractions would be even lower. Hereafter we discuss why there is such a drop in these detections.
Table 5. Comparison of Central Sources to Previous Studies
| Study | Late-type | Early-type | LBV/WR Candidates | Fraction of (super) Giants |
|---|---|---|---|---|
| VLT/SINFONI | 13 | 4 | 4 | 19%a, 35%b |
| Flagey et al. (2014) | 5 | 3 | 6 | 43%a, 64%b |
| Wachter et al. (2010, 2011) | 3 | 6 | 33 | 79%a , 93%b |
Notes. Table contains only confirmed central sources from each study.
aDenotes fraction of LBV/WR candidates. bDenotes fraction of LBV/WR candidates and O/B/A (super)giants.Download table as: ASCIITypeset image
Table 6. Central Objects of MIPSGAL Bubbles
| Target | Star | Spectral Type | Distance | Radius | Comments | |
|---|---|---|---|---|---|---|
| (kpc) | ('') | (pc) | ||||
| Category A—Very likely | ||||||
| MB3177 | 01 | B I | 8.3 | 16 | 0.64 | – |
| MB3198 | 01 | O/B I | 10.0 | 16 | 0.78 | – |
| MB3736 | 02 | LBV can. | – | 44 | – | Radio morphology suggests a LBV candidate (Ingallinera et al. 2015) |
| MB4267 | 02 | G8/G9 III | 5.2 | 16 | 0.40 | – |
| MB4403 | 03 | K0/K1 III | 6.6 | 16 | 0.51 | Stars 06 and 04 close |
| MB4475 | 04 | K0/K1 III | 5.2 | 20 | 0.50 | – |
| MB4515 | 02 | K3/K4 III | 16.8a | 15 | 1.22 | – |
| MB4521 | 02 | LBV can. | – | 31 | – | – |
| MB4530 | 02 | G8/G9 III | 4.7 | 11 | 0.25 | – |
| MB4552 | 02 | WN8o | 12.6 | 21 | 1.28 | Radio morphology is typical of WR (Ingallinera et al. 2015) |
| MB4567 | 02 | K1/K2 III | 6.3 | 19 | 0.58 | – |
| MB4572 | 01 | K0/K1 III | 6.5 | 19 | 0.60 | – |
| MB4580 | 01 | A/F III | 4.4 | 19 | 0.41 | – |
| MB4581 | 01 | M3/M4 III | 9.0a | 18 | 0.79 | – |
| MB4587 | 01 | K1/K2 III | 6.6a | 16 | 0.51 | – |
| MB4599 | 03 | M0/M1 III | 10.8a | 19 | 0.99 | Slightly off center |
| MB4659 | 01 | K2/K3 III | 8.5a | 18 | 0.74 | – |
| MB4669 | 01 | A/F III | 4.7 | 18 | 0.41 | – |
| MB4670 | 01 | LBV can. | – | 13 | – | – |
| MB4718 | 02 | K5/M0 III | 5.9a | 20 | 0.57 | – |
| MB4729 | 01 | G7/G8 III | 2.6 | 19 | 0.24 | – |
| Category B—Possible | ||||||
| MB3223 | 02 | K2/K3 III | 10.7a | 18 | 0.93 | Lies in close proximity to center |
| MB3857 | 01 | M0/M1 III | 31.8a | 25 | 3.85 | – |
| MB4571 | 01 | K3/K4 III | 11.6 | 13 | 0.73 | Lies in close proximity to center |
| MB4573 | 01 | M2/M3 III | 22.5a | 11 | 1.20 | Lies in close proximity to center |
| MB4607 | 01 | K5/M0 III | 12.8a | 19 | 1.18 | Radio morphology suggests a PN candidate (Ingallinera et al. 2015) |
| MB4680 | 01 | M1/M2 III | 25.3a | 20 | 2.45 | Slightly off center |
| Category C—Confusion | ||||||
| MB4399 | 02, 03 | – | – | 16 | – | Both equidistant to center, no H band spectra |
| MB4440 | 02 | – | – | 20 | – | Multiple SINFONI candidates close, no H band spectra |
| MB4446 | 03 | M5/M6 III | 18.7a | 18 | 1.63 | Multiple SINFONI candidates close |
| MB4493 | 06 | G4/G5 III | 4.3 | 19 | 0.40 | Multiple SINFONI candidates close |
| MB4564 | – | – | – | 20 | – | Multiple SINFONI candidates close |
| MB4649 | 02, 07, 08 | – | – | 18 | – | Low S/N, unable to determine spectral type |
| Category D—Spectral type unknown | ||||||
| MB3188 | – | – | – | 15 | – | Faint source in UKIDSS images |
| MB4134 | 01 | – | – | 23 | – | Low S/N, unable to determine spectral type |
| MB4445 | – | – | – | 13 | – | Faint source in UKIDSS images |
| MB4463 | – | – | – | 31 | – | Faint sources in VLT/SINFONI images |
| MB4464 | – | – | – | 18 | – | Faint source in UKIDSS images |
| MB4471 | 03 | – | – | 25 | – | Low S/N, unable to determine spectral type |
| MB4507 | – | – | – | 18 | – | Faint sources in VLT/SINFONI images |
| MB4509 | – | – | – | 18 | – | Faint source in VLT/SINFONI images |
| MB4563 | 01 | – | – | 18 | – | Low S/N, unable to determine spectral type |
| MB4574 | – | – | – | 16 | – | Faint source in VLT/SINFONI images |
| MB4583 | – | – | – | 11 | – | Faint source in VLT/SINFONI images |
| MB4586 | 05 | – | – | 14 | – | Low S/N, unable to determine spectral type |
| MB4675 | – | – | – | 18 | – | Faint source in VLT/SINFONI images |
| MB4690 | – | – | – | 14 | – | Faint source in VLT/SINFONI images |
| Category E—No star detected near the center | ||||||
| MB3176 | 03 | K1/K2 III | 7.7 | 21 | 0.78 | |
| MB3192 | 01,03 | M2/M3 III, K3/K4 IIII | 18.4, 4.4 | 20 | 1.78, 0.43 | Both equidistant to center |
| MB3347 | 01 | K1/K2 III | 7.7 | 19 | 0.71 | |
| MB4438 | 03 | – | – | 15 | – | Low S/N, unable to determine spectral type |
| MB4500 | 05 | A/F III | 6.3 | 15 | 0.46 | |
| MB4589 | 02,03 | K3/K4 III, M1/M2 III | 22.2a, 18.4a | 19 | 2.04, 1.70 | Radio morphology suggests a PN candidate (Ingallinera et al. 2015) |
| MB4590 | 03 | K2/K3 III | 18.3a | 13 | 1.15 | |
| MB4668 | 02 | K0/K1 III | 12.1a | 14 | 0.82 | |
Notes. A "–" in any of the columns states that the source or value was unable to be determined from the data we had.
aExtinction-to-distance ratio significantly out of the expected range.Unlike the MBs that were observed by, e.g., Wachter et al. (2010, 2011), and Flagey et al. (2014), most MBs in this paper do not show a clear candidate central source in the mid-IR images. Additionally, our targets have a mean K magnitude of 12.2 ± 1.5, at least one magnitude fainter than the aforementioned studies: 9.0 ± 2.5 (Wachter et al. 2010, 2011) and 11.2 ± 2.3 (Flagey et al. 2014). Since we observe deeper in the Galactic plane, we also expect more confusion and more difficulty in clearly identifying the central sources. This is shown in Table 6 by the six MBs in "Category C" for which there are multiple stars near the center of the MB and the 14 MBs in "Category D" for which we were able to detect central sources, but could not identify their spectral types. Observing fainter targets will lead to a lower probability of the sources being massive stars as these tend to be intrinsically brighter sources. Our goal is to observe sources with apparent K magnitudes as faint as ∼14 which corresponds to a typical WR star ( Crowther et al. 2006) at ∼15 kpc from the Sun, assuming an average visual extinction of 2 mag kpc−1 along the line of sight and
  . Therefore, if there are any other WR stars among the 55 MBs, which we can reasonably assume to lie within 15 kpc of the Sun, we should have been able to obtain their spectra with sufficient S/Ns to classify them. Since we do not find any other WR stars, we can claim that we have detected all of them, unless they are peculiar (e.g., hidden behind a high extinction cloud). This only applies to WR stars and other very bright stars but not to fainter or variable massive stars (e.g., LBV candidates).
Most of what we know about the physical sizes of circumstellar shells around giants and supergiants is from the Infrared Astronomical Satellite 60 μm surveys (Stencel et al. 1989; Young et al. 1993). Stencel et al. (1989) surveyed 111 supergiant stars and found nearly 25% showed evidence for having circumstellar shells. The majority of the radii fell between 0.1 and 1.5 pc with some as large as 4 pc. Similarly, the latter authors surveyed 512 red giant stars and found that 76 of these have circumstellar shells. The average radius is 0.74 pc with a few cases of radii greater than 2 pc.
The physical sizes that we derive for the shells around the giant and supergiant candidates (see Table 6), based on the distances inferred in Section 3, agree well with the typical sizes from both Stencel et al. (1989) and Young et al. (1993). The largest shell size is that derived for MB4552 and its WN8o central star (1.28 pc), which is not uncommon for WR stars. We are unable to estimate the physical sizes for the shells surrounding the three LBV candidates as we are unable to determine their distances due to the large uncertainties in intrinsic colors and absolute magnitudes of these rare stars. We classify two M III stars (mb3857-01 and mb4680-01) as "Category B" despite their clear and close proximities to the centers ("Category A"), because their distances (32 kpc and 25 kpc, respectively) would indicate circumstellar envelopes larger than 1.4 pc, which is unlikely.
4.3. Morphologies and Trends
Nowak et al. (2014) did a morphological analysis of the 428 MBs from the Mizuno et al. (2010) catalog. The MB morphologies were separated into six types (e.g., rings, disks) which are listed in Table 12 of Nowak et al. (2014). At the time they found that the central sources of 300 MBs were still unidentified (see their Table 13). Based on the morphological analysis of the 128 identified MBs, Nowak et al. predicted that the remaining 300 MBs would include only a few massive star candidates, while the large majority would be classified as PNe. They also predicted that the few massive star candidates would have ring-like MBs surrounding them while the PNe would be disk-like.
Our results confirm the trend of discovering a lower fraction of LBV and WR candidates. The morphological trend is also mostly confirmed, especially after taking a closer look at the 24 μm images of the shells. The 21 MBs for which we identify a central star are as follows: two MBs are of morphology type 1 (rings with central sources detected at 24 μm), six of morphology type 2 (rings without central sources detected at 24 μm), 12 of morphology type 3 (disks), and one of morphology type 4 (two-lobed).
The six MBs with massive star candidates as central sources were divided among the first three categories from the originally published classifications (Mizuno et al. 2010): MB3736 in morphology type 1, MB3198 in morphology type 2, and MB4521, MB4552, MB3177, and MB4670 in morphology type 3. However, we reclassify some of the disk-like shells, which definitely do not appear uniform at 24 μm: MB4521 shows a two-lobed morphology (morphology type 4), while MB4552 and MB4670 both show a ring-like structure with no central source detected at 24 μm (morphology type 2). The two MBs with early-type stars as central sources, MB4580 and MB4669, fall into morphology types 2 and 3, respectively. The remaining thirteen MBs with late-type stars as central sources are divided among the first four categories: one in morphology type 1, four in type 2, seven in type 3, and one in type 4. We also reclassify in morphology type 2, three MBs that were originally placed into morphology type 3.
We summarize this morphological analysis in Table 7, adding our newly identified central stars to those previously listed in Nowak et al. (2014). We confirm the expected trends in all spectral types except that of late-type stars (G to M). Previously, there was an even, though not statistically significant, distribution between morphology types 1 and 3. Including our results, we see that the majority now lie in morphology type 2. We also significantly increase the number of MBs identified with late-type stars.
Table 7. Comparison of Morphologies of MIPSGAL Bubbles
| Type | 1 | 2 | 3 | 4 | 5 | 6 | Total |
|---|---|---|---|---|---|---|---|
| Be/B[e]/LBV | 26 + 1 | 2 + 1 | 1 | 1 + 1 | ⋯ | ⋯ | 30 + 3 |
| WR | 7 | 4 + 1 | 1 | 1 | ⋯ | ⋯ | 13 + 1 |
| Oe/WN | 2 | ⋯ | ⋯ | ⋯ | ⋯ | ⋯ | 2 |
| O/B I/III | 6 + 1 | 3 + 1 | ⋯ | ⋯ | ⋯ | 1 | 10 + 2 |
| B–G I/III | 1 | 1 + 1 | 0 + 1 | ⋯ | ⋯ | 1 | 3 + 2 |
| G–M I/III | 3 + 1 | 1 + 7 | 3 + 4 | 0 + 1 | ⋯ | ⋯ | 7 + 13 |
Note. Morphology types are from Mizuno et al. (2010). Original values are from Nowak et al. (2014). Added values are from this paper.
Download table as: ASCIITypeset image
Our results reveal a trend in the luminosity distribution of giant stars that are the central source for MBs. With the currently identified MB sources, it is somewhat of a surprise that 15 of our 21 stars in "Category A" are giant stars while previous studies, e.g., Wachter et al. (2010), found 12 supergiant stars and only one giant star in their sample. Although one would expect supergiant stars to dominate, because of their larger mass losses and higher luminosities, it is not uncommon for giant stars to have circumstellar shells (Young et al. 1993). We may also be probing another fainter population of the MBs where giant stars are more common. However, note that our distinction between giant and supergiant stars is solely based on the distance and extinction values based from H- and K-band magnitudes and intrinsic colors.
4.4. Uncertain or No Central Source Identifications
We were unable to confidently identify central sources in the remaining 34 MBs for different reasons. Out of these 34 MBs, 12 have either a star that lies ∼1'' from their center or multiple stars within similar distances of their center (Categories B and C in Table 6). We indicate our best guess for the central sources of each of these 12 MBs, though we cannot rule out that another star, detected or not in the VLT/SINFONI or UKIDSS data, is the source of the 24 μm shell. Those stars that we spectrally identify are all G to M giants.
The other 22 MBs are the most challenging. For 14 of them, we find potential central stars in the VLT/SINFONI or UKIDSS data, but they are too faint to be spectrally identified ("Category D"). In Table 6 we give the identification number of that star when available. As given by the UKIDSS archives, the average H and K magnitudes of the central sources in this category are 15.4 ± 0.9 and 14.7 ± 0.7, respectively. The eight MBs in "Category E" have no stars detected within at least 1'' of their centers. Although we list the stars that are closest to their centers, there is a significant possibility that these are not the central sources. Because the UKIDSS images also do not show stars at the centers of these MBs, we expect the central sources to be intrinsically much fainter than those identified in this paper (e.g., they could be white dwarfs). The current observations would not detect white dwarfs (assuming MK = 7) even at 1 kpc as their apparent K magnitudes would be 17. The stars that lie near the centers of these eight MBs and that we spectrally identify are all M/K giants, except for one A/F giant. For the MBs in both "Category D" and "Category E," deeper observations would be required to identify white dwarf central sources.
4.5. Future Work
With VLT/SINFONI, we may have reached the limits of ground-based near-IR spectroscopic observations for the study of large samples of central sources in the MBs. Deeper ground-based observations will greatly benefit from the next generation of telescopes (e.g., E-ELT, TMT). HARMONI on the E-ELT will be a near-IR/optical IFU with a 6'' × 9'' field of view, resolving powers from 500 to 20,000, and sensitivity to ∼25th magnitude. The James Webb Space Telescope, scheduled for launch in 2018 October, will perhaps be the best step forward: the Near-Infrared Spectrograph (NIRSpec) will provide a 3'' × 3'' IFU with resolving powers from 100 to 2700, while the Mid-Infrared Instrument will provide direct imaging and spectroscopy that will help better constrain the physical conditions in the mid-IR shells with significant improvement compared to the studies done by Flagey et al. (2011) and Nowak et al. (2014).
5. Conclusion
We have presented VLT/SINFONI H- and K-band spectra of potential central stars for 55 MBs, previously discovered in the Spitzer/MIPS 24 μm images of the Galactic plane. We have determined the natures of 21 MBs by roughly identifying the spectral types of their central sources.
- 1.One WR and three LBV candidates, whose spectra are dominated by emission lines. The WR is identified as a WN8o and is the central source for MB4552, reclassified in this paper as a ring. The three LBV candidates exhibit the typical emission lines (H, He, and metal lines) that are found in Be/B[e]/LBV stars in previous studies (Morris et al. 1996; Wachter et al. 2010, 2011). The three LBVs are central sources for MB3736, a ring with the central source detected at 24 μm, MB4521, a two-lobed envelope, and MB4670, a ring with the central source not detected at 24 μm.
- 2.Four early-type stars, whose spectra are dominated by hydrogen and/or helium transitions in absorption. We have likely identified two supergiants, a B I and an O/B I, and two giants, both A/F III. The supergiants are the central sources for MB3177, a disk, and MB3198, a ring with the central source not detected at 24 μm. The giants are the central sources for MB4580 and MB4669, both rings with the central source not detected at 24 μm.
- 3.Thirteen late-type stars, whose spectra are dominated by CO absorption features in the K band. Thanks to distances and extinction estimates, we rule out the supergiant hypothesis for all 13 stars. The late-type stars are the central sources for one ring with the central source detected at 24 μm, seven rings with the central source not detected at 24 μm, four disks, and one two-lobed MB.
We were unable to confidently identify the remaining 34 MBs and separated them into four categories:
- 1.Category B—Possible. Six MBs each have one star detected in close proximity to the center of the MB. We cannot be completely certain that these four stars, all K/M giants, are the central source for the MB.
- 2.Category C—Confusion. Six MBs have at least two stars detected in close proximity to their centers. Many of these stars are too faint to be extracted with sufficient S/Ns for classification.
- 3.Category D—Spectral type unknown. Fourteen MBs have single stars detected exactly at their centers but the stars could not be classified due to low S/N spectra. It is likely that these are the central sources for the MBs.
- 4.Category E—No star detected near the center. Eight MBs have no stars detected within 1'' of their centers.
We have confirmed, for the most part, the previous trends according to which (1) the fractions of LBV, WR, and O/B stars are significantly decreasing with increasing K-band apparent magnitudes of the stars and (2) the spectral types of the central sources are correlated to the shell morphologies.
Most of the remaining 279 MBs with as-yet unknown central sources will have similar or higher near-IR magnitudes than those in this paper ( ). Because of the increasing confusion and extinction within
  latitude of the Galactic plane, further observations to identify the spectral types of the central sources in these MBs will require the use of next-generation telescopes (e.g., HARMONI on E-ELT, NIRSpec on the James Webb Space Telescope).
We thank K. Cooksey for careful reading of the manuscript and providing valuable feedback. We also thank the anonymous referee for constructive comments that helped improve the paper. This work was supported in part by the Canada–France–Hawaii Telescope Corporation, and is based on observations collected at the European Organisation for Astronomical Research in the Southern Hemisphere under ESO programme 093.D-0414. This publication makes use of data products from the Two Micron All Sky Survey, which is a joint project of the University of Massachusetts and the Infrared Processing and Analysis Center/California Institute of Technology, funded by the National Aeronautics and Space Administration and the National Science Foundation. This work is based in part on observations made with the Spitzer Space Telescope, which is operated by the Jet Propulsion Laboratory, California Institute of Technology under a contract with NASA.
Footnotes
- 6
More information can be found in SINFONI's manual at http://www.eso.org/sci/facilities/paranal/instruments/sinfoni/doc.html.
- 7
Details about EsoRex can be found at http://www.eso.org/sci/software/cpl/esorex.html.
- 8
The model can be found at http://kurucz.harvard.edu/stars.html.
- 9
The SIMBAD Astronomical Database can be found at http://simbad.u-strasbg.fr/simbad/.