


ABSTRACT
We describe a double-arc-like X-ray structure lying ∼15''–30'' (∼0.8–1.7 kpc) south of the NGC 5195 nucleus, visible in the merged exposures of long Chandra pointings of M51. The curvature and orientation of the arcs argues for a nuclear origin. The arcs are radially separated by ∼15'' (∼1 kpc), but are rotated relative to each other by ∼30°. From an archival image, we find a slender Hα-emitting region just outside the outer edge of the outer X-ray arc, suggesting that the X-ray-emitting gas plowed up and displaced the Hα-emitting material from the galaxy core. Star formation may have commenced in that arc. Hα emission is present at the inner arc, but appears more complex in structure. In contrast to an explosion expected to be azimuthally symmetric, the X-ray arcs suggest a focused outflow. We interpret the arcs as episodic outbursts from the central super-massive black hole (SMBH). We conclude that NGC 5195 represents the nearest galaxy exhibiting on-going, large-scale outflows of gas, in particular, two episodes of a focused outburst of the SMBH. The arcs represent a clear demonstration of feedback.
Export citation and abstract BibTeX RIS
1. INTRODUCTION
Through both observations and simulations, significant progress has been made in understanding the role of supermassive black holes in galaxy evolution. It is now widely accepted that at high redshifts, galaxies undergo an active period of gas cooling, star formation, and rapid black hole growth through radiatively efficient accretion. This quasar phase is generally followed by radiatively inefficient accretion of material onto the super-massive black hole (SMBH), with the energy from the SMBH primarily released mechanically through radio-emitting jets that can inflate bubbles in the hot atmospheres that surround massive elliptical galaxies (Churazov et al. 2005; for recent reviews, see Fabian 2012, hereafter F12; or King & Pounds 2015, hereafter KP2015). While many examples of active galactic nucleus (AGN) outbursts from SMBHs in massive elliptical galaxies have been found from Chandra and XMM-Newton observations, in this paper we present the first evidence for episodic outbursts from the central black hole in the nearby (8 Mpc), relatively low-mass early-type galaxy NGC 5195. NGC 5195 (M51B), along with the grand-design spiral NGC 5194 (M51A), form the Messier 51 interacting system.
Much of the attention given to M51 focuses on the spiral NGC 5194. The less-photogenic companion NGC 5195 is variously typed as an SB0-1, Irregular, or LINER (e.g., NED.ipac.caltech.edu, de Vaucouleurs et al. 1991). The nucleus of NGC 5195 is detected in every wavelength from X-rays to radio. NGC 5195 tends to receive less attention because of the significant dust component that is sufficiently dense to virtually hide the nature of the galaxy (Van Dyk 1987).
Here we describe an X-ray-bright, double-arc extended structure lying ∼15''–30'' south of the nucleus of NGC 5195 that is visible in deep Chandra observations of M51 (PI K. Kuntz). We interpret the double-arc structure to originate from episodic outflows which have "snow-plowed" Hα-emitting material, from the galaxy's core. Given the cosmologically recent interaction of NGC 5195 and NGC 5194, estimated to have occurred 50–100 Myr ago (Salo & Laurikainen 2000), the structure immediately suggests a reaction to the forced feeding of the SMBH in NGC 5195.
Estimates of the distance to M51 range from 7.9 Mpc, derived from the expanding photospheres method for core-collapse supernovae (Bose & Kumar 2014), to 8.4 Mpc, based on the planetary nebula luminosity function (Feldmeier et al. 1997). We adopt a distance to M51 of 8 Mpc.
2. DATA AND ANALYSIS
2.1. Data Preparation
The Chandra Advanced CCD Imaging Spectrometer (ACIS) observations of M51 used in this study were obtained from the Chandra archive and are listed in Table 1. Seven long pointings were obtained in Faint mode and total ∼760.2 ks. Three observations, totaling 84 ks, were obtained in Very Faint mode and are discussed in Section 2.2 below. We do not analyze two observations: a short 2 ks observation obtained in Faint mode (ObsID 414) and a ∼10 ks observation (ObsID 12562) obtained in Very Faint mode in which NGC 5195 falls in the gap between the ACIS-I and ACIS-S CCDs. These observations are not included in our analysis as they add little or no signal.
Table 1. List of M51 Observations
| ObsID | Observation | Observed |
|---|---|---|
| Date | ExpT (ks) | |
| Faint Mode | ||
| 354 | 2000 Jun 20 | 14.9 |
| 13812 | 2012 Sep 12 | 157.5 |
| 13813 | 2012 Sep 9 | 179.2 |
| 13814 | 2012 Sep 20 | 189.8 |
| 13815 | 2012 Sep 23 | 67.2 |
| 13816 | 2012 Sep 26 | 73.1 |
| 15496 | 2012 Sep 19 | 40.9 |
| 15553 | 2012 Oct 10 | 37.6 |
| Very Faint Mode | ||
| 1622 | 2001 Jun 23 | 26.8 |
| 3932 | 2003 Aug 7 | 47.9 |
| 12668 | 2011 July 3 | 9.9 |
Note. See Section 2.1 for a discussion of the ObsIDs used.
Download table as: ASCIITypeset image
Data preparations were all carried out using the Chandra Interactive Analysis of Observations (CIAO) software package and followed the recommended processing. Each ObsID was examined for times of high particle background. Although no such periods were found, short time intervals were trimmed at the start and end to eliminate possible residuals; the trimmed times sum to <0.1% of the total exposure. Gain calibrations were checked and found to match. The data were energy-filtered to include only events between 0.4 and 8 keV. Given the multiple pointings, the absolute positions of a given ObsID may differ slightly from the others. Consequently, we arbitrarily adopted ObsID 13814 (the longest exposure) as our reference. The CIAO task merge_obs was used to place all frames into a common reference, construct exposure maps for each observation, and merge the exposure maps and event files to build a flux image.
Point sources above a flux of ≈5 × 10⁻¹⁶ erg s−1 cm−2 (corresponding luminosity at the distance of M51 is ≈4 × 1036 erg s−1) were filtered out from all subsequent analyses. This limit means that the seven bright sources seen in the field are all filtered from the data. Five of the sources are too distant to have any impact on the spectra or profiles of the arcs. A sixth source lies too far west of the western edge of the inner arc to have any impact—the source is ∼15'' W of the edge while the 90% encircled energy radius at its position is ∼4''. The seventh point source sits just south of the nucleus on the east edge of the inner arc. Again, the 90% encircled energy radius of ≈4 arcsec, while contaminating some of the arc emission, remains small relative to the total size of the inner arc. Consequently, the western half of the arc is uncontaminated by point source emission.
2.2. X-Ray Imaging
The overall field is shown in Figure 1(a). The nuclei of NGC 5194 and NGC 5195 are labeled "A" and "B," respectively. NGC 5194 is nearly centered in the field, so the majority of the galaxy is covered by the image. Also visible is the X-ray emission from a prominent spiral arm lying between the nuclei (discussed in Vega et al. 2016).
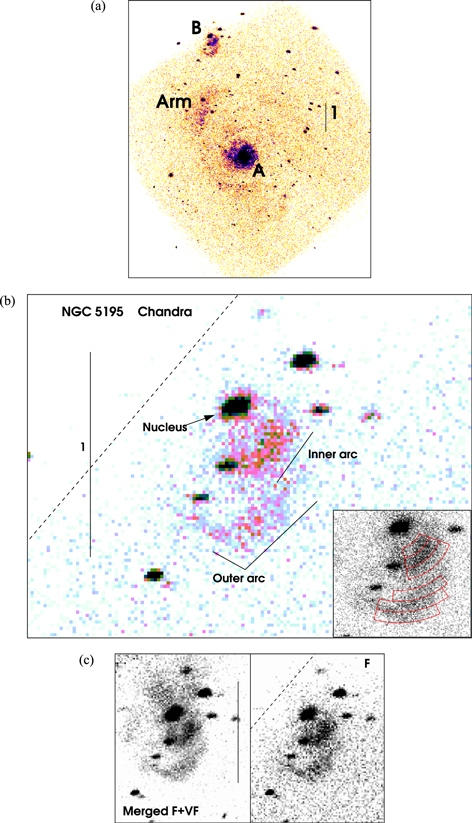
Figure 1. (a) Chandra images of NGC 5195 from the merged long observations of M51 (PI K. Kuntz). North is up and east is left for all frames; the scale bar on the right side of the figure is 1 arcmin in length. The nuclei of NGC 5194 (A) and NGC 5195 (B) are labeled, as is an X-ray-emitting spiral arm lying midway between the nuclei (Vega et al. 2016). The image shows events between 0.4 and 8 keV, binned by a factor of two, exposure-corrected but without background subtraction. (b) an expanded view of (a) with the two arcs south of the nucleus, as well as the nucleus, indicated. The image is un-binned but zoomed by a factor of two. The other dark objects are X-ray point sources either near the nucleus or in the background. The dashed line indicates the approximate edge of the CCD. The black-and-white inset shows four (red arcs) of the twenty regions used to determine the radial profile. (c) Comparison of the summed ∼700 ks Faint mode data (right) with the ∼790 ks merged Faint + Very Faint mode data (left). North is up, east is left. Absent the longer exposure, the Very Faint mode data would be difficult to interpret. However, in the context of the long Faint mode exposures, the faint emission north of the nucleus in this image may suggest symmetric expulsion of matter. The dashed line in the right image indicates the approximate edge of the CCD.
Download figure:
Standard image High-resolution imageThe nucleus of NGC 5195 lies just inside the ACIS field of the merged F-mode exposures (Figure 1). In all subsequent discussion, the two X-ray arcs are labeled as "inner," to describe the one closest to the nucleus of NGC 5195, and "outer." Point sources at the east end of both the inner and outer arcs are removed from the analysis of the spectrum and flux of the respective arc as mentioned previously.
The arcs are separated from the nucleus by ∼780 (∼15'') and 1700 pc (∼30''), respectively (Table 2). The two arcs have broadly comparable curvature: the inner arc spans ∼50°–60° (position angles ∼180°–240° measured eastward from north), while the outer arc spans ∼40°–50° (position angles ∼160°–210°). The curvatures are consistent with an origin at or near the SMBH. The outer arc is approximately centered on a line joining the nuclei of NGC 5195 and NGC 5194, but the inner arc is centered on a line rotated ∼30° counter-clockwise from the NGC 5194/5195 line. Note also that the inner arc is brighter than the outer arc by about a factor of two (Section 2.4.3), consistent with expanding gas. The curvature, coupled with the inner versus outer brightnesses, suggests a nuclear outburst or similar expulsion of matter with the emission becoming fainter as the gas expands. The presence of the two arcs suggests two episodes of SMBH-driven outflows. We discuss other possibilities to explain this structure later in this section.
Table 2. Approximate Spatial Descriptions of the Arcs
| Description | X-Ray | Hα | ||
|---|---|---|---|---|
| Inner Arc | Outer Arc | Inner Arc | Outer Arc | |
| Mid-arc R.A., Decl. (J2000) | ||||
| 13:29:00, 47:15:00 + | 58.5, 43 | 59, 22 | 58.5, 43 | 59.7, 13.5 |
| Overall length-arcsec | 20 | 28 | 22 | 43 |
| Overall length-parsecs | 775 | 1080 | 850 | 1670 |
| Width-arcsec | 9 | 9 | 9 | 6 |
| Width-parsecs | 350 | 350 | 350 | 230 |
| From nucleus: | ||||
| Outermost point-arcsec | 20 | 44 | 29 | 48 |
| Outermost point-parsecs | 780 | 1700 | 1120 | 1700 |
| Innermost point-arcsec | 13 | 31 | 15 | 41 |
| Innermost point-parsecs | 500 | 1200 | 580 | 1590 |
Note. Arc positions are defined by rectangles enclosing >80% of the emission. Position of nucleus adopted as (J2000) 13:29:59.577, 47:15:58.39 (NASA Extragalactic Database). One arcsecond at M51 ∼38.8 pc. All values in parsecs should be multiplied by d8.
Download table as: ASCIITypeset image
While we can measure the length and width of each arc, the thickness thick is unknown. We adopt a thickness of 100 thick100 pc at the front edge of the outer arc—a specific thickness at the outer edge leads to a constant opening angle. If the arcs were a very broad angular hemispheric "fan," significant X-ray emission would exist between the arc and the nucleus, but we do not detect such emission. Instead, we detect emission that is length- and width-restricted. The width restriction implies an episode; the length restriction implies an angular constriction in a flow with unknown depth or thickness. An explosion is expected to be azimuthally symmetric, but the arcs to the south are not, appearing instead to be two episodes of a "focused" outflow.
The 85 ks ACIS VF mode data are shown in Figure 1(c). The data provide a glimpse north of the NGC 5195 nucleus; a "glimpse" because the signal-to-noise in the ACIS VF observation is low. X-ray structure exists to the north, however, it does not appear to be arc-like, but instead V- or fan-shaped with the point of the V toward the SMBH. If the density to the north decreases sufficiently quickly, a bubble expanding northward could open, possibly leading to a V- or fan-shaped structure.
Are there alternative explanations at this point? One could interpret the structure as weak point source(s) plus diffuse emission. However, this structure is not consistent with blended point sources, even for the Chandra point-spread function (PSF) ∼4' off-axis. We note, however, that our PSF analysis applies only to sources above ≈100 counts, as fainter ones are inseparable from the diffuse emission at this off-axis angle. A definitive analysis requires an on-axis observation. Another possibility is induced star formation within the arcs; we discuss this interpretation in Section 2.5 after presenting observations in other wavelengths.
A similarly shaped, fan-like structure also appears to the north in a continuum-subtracted Hα image of NGC 5195 presented in Kaisin & Karachentsev (2008) and the Hα image from Hoopes et al. (2001). We discuss the Hα image in Section 2.5.
2.3. Surface Brightness Profiles of the X-Ray Arcs
Figure 2 displays the surface brightness profiles across both X-ray arcs. Each profile was built by extracting counts using an azimuthally constrained annular region similar to that shown in Figure 1(b), but with a larger number of annuli.

Figure 2. Radial profiles of both arcs. The counts were extracted in angular annuli using a region similar to that shown in Figure 1(b) but using 20 annuli. The radius is the mid-point of an annulus and is defined as the radial distance from the nucleus. The position of the nucleus is adopted as defined in Table 2. The data were at full resolution, so each pixel is 0 5 × 05. The inner arc partially overlaps the outer arc near position angle ∼180°; the background region for the inner arc is consequently shorter in azimuth than the region for the outer arc.
Download figure:
Standard image High-resolution imageThe profiles were extracted by matching angular annuli to the shape of the outer edge, then dividing the region interior to that edge into 20 segments identically shaped. Leaving aside the detector background, there are two source backgrounds to consider: the real cosmic background well-away from M51, and the diffuse background of NGC 5195. The counts in radial bins lying outside the outer edges of the arcs represent the galaxy background. The inner arc borders closely on the outer arc. Consequently the background radial bin of the inner arc is shorter to avoid overlap with the outer arc. Finally, the cosmic background was adopted as a large region WSW of NGC 5195 and sufficiently separated (∼2.5 arcmin) to avoid any contamination from point sources or diffuse emission from the galaxy.
The surface brightness profiles are similar in shape: relatively flat as a function of radius out to the outside edge, then dropping quickly to the level of the ISM. That behavior describes a shock. The large off-axis angle means the PSF is broad at this location (50% encircled energy width of the PSF ∼2–2.5 arcsec; Chandra Proposers Guide). Consequently, the arcs are blurred; to ascertain their shape more accurately will require an on-axis observation.
2.4. Spectral Fitting
We extract spectra from the two arcs as well as the nucleus for the purpose of comparing their temperatures and absorption properties.
2.4.1. Overall Spectral Fitting
We adopted the CCD S7 blank-sky background reprojected onto the reference frame of NGC 5195. We used the blank background because (i) M51 essentially covers the back-illuminated CCD S7, reducing the area available for an on-chip background; and (ii) possible Si fluorescence within the instrument must be assessed to determine whether Si emission is present in the source spectra. We followed the CXC-defined analysis thread to reproject that background into the reference frame of the merged observation, a procedure based on Hickox & Markevitch (2006). We also matched the particle backgrounds, using events in the 10–12 keV range, of the M51 and blank-sky observations as described in the Hickox & Markevitch analysis. Finally, we verified the normalization by extracting a background spectrum from the corners of CCD S7. The corner spectrum has a lower signal-to-noise, but does verify that the reprojected data match the observed background.
The spectra for the overall diffuse emission and the backgrounds were extracted using the regions shown in Figure 1(b). The extraction region for the nucleus was a circle centered on the nucleus of radius 9 arcsec. Detected point sources were removed from the source regions using excluded regions corresponding to >97% of the on-axis PSF (Chandra Proposer's Guide). Response matrices and effective area files were built for each source and background region. The data were binned to 15 counts per bin leading to ≈225 channels in the diffuse spectra, of which ≈80 cover the 0.4–2 keV band, and ≈480 channels in the nuclear spectrum of which ≈180 cover the 0.4–2 keV band.
The source + background and background spectra were fit simultaneously, ensuring the best measure of the flux for the source. We used XSPEC package v12.8 (Arnaud 1996) and the C statistic (Cash 1979). We adopted a power law for the background model with several Gaussians to mimic small fluorescence features in the spectrum. Once the model parameters were fit, we fixed all except the normalizations for a simultaneous fit of the source + background and background spectra. We describe the nuclear spectrum first because we must refer to it when discussing the spectra of the arcs.
2.4.2. Nucleus Spectrum and Luminosity
For the nucleus, we adopted an absorbed power law typical of AGNs and included an optically thin gas model (described in Section 2.4.3 below) because our extraction region includes some surrounding gas. We tested the significance of the gas component: a pure power-law model significantly fails to fit the data, while the combined components do.
The column density was a free parameter with a fitted value of ∼1.5 × 1021 cm−2. This value is in close agreement with the value implied by the column density of K i measured by Ritchey & Wallerstein (2015). The observed luminosity of the nucleus in the 0.5–2 keV band is ∼3.3 × 1038 erg s−1 (unabsorbed LX). This value indicates that the NGC 5195 SMBH must be in a radiatively inefficient state (see Section 3).
2.4.3. X-Ray Arc Spectra and Luminosities
For the X-ray arc spectra, we adopted an absorbed, optically thin thermal gas model with variable abundances (vapec in XSPEC). We adopted a power-law component to fit any residual nuclear or un-removed X-ray binary emission in the arc spectra. We also adopted a fixed value for the index (1.6; Gilfanov 2004). The resulting fit yields an upper limit on the presence of a power-law component in both arcs. All of the fitted model parameters are listed in Table 3. Initial, fully unconstrained fits to the spectra showed repeated consistency for the arcs' temperatures, normalizations, and abundance values, but not for the column densities.
Table 3. Spectral Model Fits: Nucleus and Arc Emission
| Parameter | Nucleus | Inner Arc | Outer Arc |
|---|---|---|---|
| χ2/dof; dof | 1.31; 490 | 1.56; 210 | 1.91; 228 |
| kT (keV) |

|

|

|
| NH (1022 cm−2) |

|
0.021fa | 0.021fa |
| Norm (×10−6) |

|

|

|
| Abundance-O (Z⊙) | 1.0f |

|

|
| Abundance-Ne (Z⊙) |

|

|

|
| Abundance-Mg (Z⊙) | 1.0f |

|

|
| Powerlaw |

|
1.6f | 1.6f |
| Norm (×10−7) |

|
<7.0 | <5.0 |
| Background (used with all components) | |||
| Index |

|
⋯ | ⋯ |
| Index |

|
⋯ | ⋯ |
| Norms (×10−7): | |||
| Power law |

|
⋯ | ⋯ |
| Power law |

|
⋯ | ⋯ |
| Gaussian-1: 0.567 keV |

|
⋯ | ⋯ |
| Gaussian-2: 0.764 keV |

|
⋯ | ⋯ |
| Gaussian-3: 1.767 keV |

|
⋯ | ⋯ |
| Gaussian-4: 2.129 keV |

|
⋯ | ⋯ |
| Measured Flux (×10−14, 0.5–2 keV) | |||
| Source | 4.42 ± 0.40 | 3.06 ± 0.28 | 1.97 ± 0.17 |
| Background | 0.11 | 0.14 | 0.18 |
| Luminosities (×1038) | |||
| Source (absorbed) | 3.37 | 2.33 | 1.50 |
| Source (unabsorbed) | 3.37 | 2.52 | 1.62 |
| Background | 0.08 | 0.11 | 0.14 |
Note. The "f" on any parameter indicates it was fixed at the value listed. For the power-law index of the background, a fit determined the value, then it was fixed. The energy range used in the spectral fits was 0.4–2.4 keV. Error values represent the 90% contour.
aFor the column density, see Section 2.4.3 for discussion.Download table as: ASCIITypeset image
We initially fixed the column density at a value of 2.1 × 1020 cm−2, the Galactic column in the direction of NGC 5195 from Schlafly & Finkbeiner (2011). We did so because an unconstrained fit did not converge on a fixed value of the column. Once we reached a "best-fit" state, we also explored fits with the column densities of the arcs fixed between the Galactic column and the nuclear value. The temperatures, abundances, and model normalizations are consistent with any value between the known Galactic column and the fitted nuclear column (0.2–1.6 × 1021 cm−2). To undertake a proper fit for the column density will require either (i) additional X-ray data; (ii) an on-axis observation; or (iii) additional constraints (such as a measured value for the reddening, EB − V).
The initial fits were also done for temperature and normalization with abundances fixed at solar (=1.0). Then, each abundance in turn was fit. Abundance values that were consistent with 1.0 were fixed at 1.0. Once the abundances were determined, a final fit was done with temperature, normalization, and any non-solar abundances as free parameters. Errors at the 90% level on each parameter were then determined.
We found the gas temperatures for the two arcs differ, with the outer arc cooler ( keV) than the inner arc (
 keV) (Figure 3)—the outer arc has had a longer time to expand and to cool, as well as plowing into more material that enhances the cooling. The fitted model normalizations also support one's visual impression that the outer arc is fainter—they differ by a factor of ≈1.5 with the outer arc having a smaller normalization. The 0.5–2 keV luminosities calculated from the fitted models are L38 ∼ 1.5 (outer) and L38 ∼ 2.3 (inner) in 1038 erg s−1 units.

Figure 3. Spectra of the (a) nucleus and (b, c) the inner and outer diffuse arcs. Note the differences in the spectra, particularly the continuum slopes and bumps at energies of ∼1 (Ne) and 1.4 (Mg).
Download figure:
Standard image High-resolution imageThe nucleus and both arcs exhibit Ne enhanced relative to a solar value. While the arc values are higher, within the errors, they are consistent with the nuclear value. However, both arcs also exhibit enhanced values for Mg of 2.5–3.5 times solar. Additionally, the inner arc has an enhanced value for oxygen of 3.3 (Table 3). That the arcs exhibit enhanced O and Mg abundances suggests the outflow has swept up material from prior phases of stellar mass loss. The enhanced Ne found in the nucleus and the arcs could indicate some nucleosynthetic processing occurred before the gas was expelled.
2.5. Multi-wavelength Observations
The X-ray observations are more easily interpreted if placed in context with the emission from other wavelengths. The position of the NGC 5195 nucleus is sufficiently well-determined, in spite of its near CCD-edge position, that it and the arc structures may be compared with images at other wavebands. The nuclear source corresponds within a few arcseconds to the positions of the nuclear source in the data sets from the Swift UVOT, DSS2 (blue), WISE6 μm, and VLA FIRST images (Figure 4).

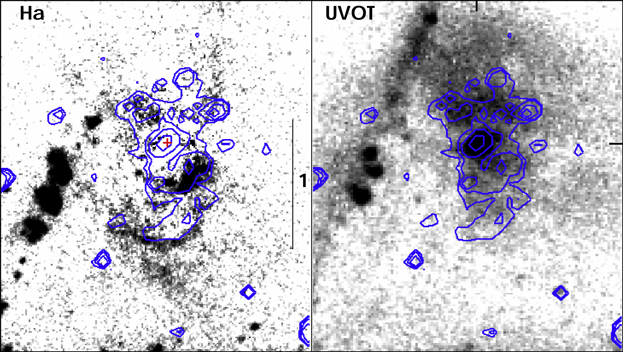
Figure 4. Multi-wavelength view of the NGC 5195 structure: Chandra X-ray; Swift UVOT (uw1); DSS2 Blue; Hα; WISE 6 μm; VLA 6 cm. North is up and east is left in all frames. The size of each frame is identical and ∼54 arcsec on a side. The contours represent the X-ray diffuse arcs with contours drawn at 10, 12.5, 15, 17.5, and 20 counts. The Hα frame is expanded in Figure 5. Note that the outer X-ray arc overlays a broad arc-like feature in the VLA 6 cm observation.
Download figure:
Standard image High-resolution imageMost other wavelengths reveal little structure at the location of the arcs, particularly if the band is a continuum or has a wide wavelength coverage. Necessarily, that statement depends on the degree to which the images in other bands provide sufficient dynamic range in the area of the sky where the arcs are located (e.g., WISE6 μm image has insufficient resolution to discern; DSS2 is over-exposed in the same region).
However, three images are intriguing. First, the 6 cm VLA image (Figure 4) shows a broad arc SE of the nucleus of NGC 5195 at approximately the distance of the outer X-ray arc. The breadth of the radio arc is likely tied to the resolution of the configuration used (VLA configuration "D") for the observation. Second, the Swift UVOT image (Figure 4) exhibits a structure to the north of NGC 5195 at a distance from the nucleus comparable to the distance between the nucleus and the inner arc. The UVOT structure resembles a single broad arc, suggesting a possible symmetric expulsion of matter. That interpretation leaves a puzzle: why are there two X-ray-visible arcs to the south and a single UV-visible arc to the north?
The third interesting image is Hα (Hoopes et al. 2001; retrieved from the NASA Extragalactic Database; Figures 4, 5). A slender Hα arc and a second, less well-defined structure are visible near the regions of the X-ray arcs. The slender Hα arc lies outside the outer X-ray arc, implying "snow-plowed," or swept-up material by the expanding plasma driven by the AGN outflow. Based on a single spectrum obtained in 1998 with the spectrograph's slit lying approximately across the Hα arc (their "slit 4"), Hoopes & Walterbos (2003) conclude that the spectral behavior is indicative of an expanding structure or outflow, but that "the mechanism for such an outflow is unclear." The same authors also note that this region exhibits high [N ii]/Hα, [S ii]/Hα, and [O iii]/Hβ, with values higher than in the diffuse gas elsewhere in the galaxy. Those emission lines are indicative of shocked emission.
Figure 5. Hα image of NGC 5195 with contours of X-ray emission (blue) overlaid from Figure 4. The contours are as described in Figure 4. North is up and east is left. The scale bar on the right side is 1 arcmin in length. The short bars approximately in the middle of the upper and left sides of the box point toward the nucleus of NGC 5195, indicated by a small, red cross. The line of Hα lumps directly east of NGC 5195 are H ii regions on the end of the arm of NGC 5194, the nucleus of which lies nearly due south of NGC 5195.
Download figure:
Standard image High-resolution image
The presence of the Hα emission plus the shock indicators support an interpretation of the X-ray arcs as resulting from shocks driving the Hα emission outward. Earlier, we raised the possibility that the arcs originate from collision-induced star formation. We interpret the shape of the Hα emission and its location immediately outside the outer X-ray arc as support for the outgoing blast wave interpretation, rather than in situ collision-induced star formation activity.
Furthermore, collision-induced star formation often occurs in tidal debris or along the bridges/tails linking the interacting pair (Machacek et al. 2009). The simulations to date either demonstrate a glancing collision with NGC 5195 passing by on a hyperbolic trajectory (Toomre & Toomre 1972), or that there have been multiple encounters with the two galaxies in high-eccentricity orbits (Salo & Laurikainen 2000). None of the simulations we have seen to date have been done with sufficient resolution to investigate detailed gas motions.
The outer Hα arc is ≈1660 pc in length (Table 2). Along the length of the arc, the width is ≈5'' or ≈200 pc. Measured velocities ranged from 500–600 km s−1. This arc also exhibits what appear to be two or three small H ii regions, suggesting the outer arc has plowed sufficient material to trigger star formation.
3. DISCUSSION
The X-ray arcs represent a clear case of feedback from the SMBH: it almost certainly cannot be a coincidence that the arcs arise in a galaxy that is known to possess a SMBH and has undergone at least one interaction with a nearby galaxy in the past ≈108 years. In that, the observations presented here for NGC 5195 appear broadly to match observations of outflows observed in other systems, as we describe at the end of this section.
Large-scale AGN feedback plays essential roles in galaxy evolution. In the initial quasar phase, there is very rapid growth of the central black hole through radiatively efficient accretion, along with active star formation. Nuclear winds driven by the quasar or, in the case of ULIRGS, by starbursts, can significantly remove gas from galaxy cores, thus quenching nuclear star formation, leading to radiatively inefficient accretion. (For a recent review of quasar feedback, see KP2015.) At the present epoch, central SMBHs are generally not in a quasar mode, but instead are radiatively faint, releasing the energy they produce from accretion kinetically through jets. These AGN outbursts can reheat cooling gas, thus truncating star formation and the growth of the SMBH.
AGN feedback is often observed through the cavities and shocks produced by SMBH outbursts in the hot X-ray atmospheres of massive early type galaxies, groups and clusters. However the mass of NGC 5195, estimated to be one tenth to half the mass of its companion NGC 5194 (Howard & Byrd 1990; Smith et al. 1990), is in the range from a few  to
to  and is too low to gravitationally bind hot X-ray emitting gas. Instead we have argued that the X-ray and Hα arcs near the nucleus of NGC 5195 are likely produced by episodic outbursts from the central SMBH that shock-heat cool gas in the galaxy core to X-ray emitting temperatures.
For those less familiar with the literature on feedback, we direct readers to three recent reviews, each with a slightly different view of feedback: from the viewpoint of clusters and massive galaxies (F12), from luminous AGNs (KP2015), and from outflows caused by starbursts in low-mass galaxies (Erb 2015).
3.1. Estimates of Physical Quantities
The data at present are limited, so many of the estimates must be order-of-magnitude. There are also a number of quantities that cross-feed into the estimates. As we want to avoid creating confusion in the reader's mind, the overall path is as follows: determine the mass of the SMBH, then LEdd, then an age estimate for the outbursts from the velocities, followed by a density estimate, which leads to the mass of the arcs, followed by an estimate of the cooling time of the arcs.
From the velocity dispersion σ of 124.8 km s−1 for NGC 5195 (Ho et al. 2009), the  relation yields MBH ∼ 3.8 × 10⁷ M⊙ (M7 = 3.8), assuming σα = σ4.4 (Ferrarese & Merritt 2000; Gebhardt et al. 2000). The Eddington luminosity for NGC 5195 is

where κ = electron scattering opacity; with values inserted for NGC 5195, we have LEdd = 4.9 × 1045 erg s−1 compared to the observed 0.5–2 keV luminosity of ∼5 × 1038 erg s−1 (Section 2.4.2). To reiterate, that value means the NGC 5195 SMBH is in a radiatively inefficient state of Lobs = f LEdd with f ∼ 10−7.
A measure of the velocities of the arcs could lead to their estimated age. Unfortunately, the velocities of the arcs and their surroundings likely have not been measured. The velocity measured from the Hoopes et al. (2001) Hα spectrum, ∼500–600 km s−1, was obtained from a long-slit spectrograph and represents an average over a range of velocities (Section 2.5). The velocity of NGC 5195 itself is ∼470 km s−1 (NED). With uncertainties included, these two values are comparable. Further, if the gas is confined to the interaction plane, then any measured velocity is a projection into our line of sight. Absent a good measure of the projection angle, measured velocities have a wide range.
Can limits on the velocity of the arcs be set or inferred? Hoopes et al. (2001) measured line ratios from optical spectra from which they inferred that the ratios are consistent with a shock velocity of "several hundred kilometers per second." Additionally, a lower limit on the arcs' motion is set by considering the time from the interaction of NGC 5195 and NGC 5194 based on models: ∼50–100 Myr (Salo & Laurikainen 2000). Given the present positions of the arcs, this leads to velocities of ∼8–15 (inner) and ∼17–35 (outer) km s−1. However, velocities this low would not generate shock emission consistent with the Hoopes et al. (2001) values.
If we instead assume that "several hundred" translates to ≈300 km s−1, then the arcs require ∼2.5 × 10⁶ (inner) and ∼5.6 × 10⁶ (outer) years to reach their current positions and the episodes are separated by ≈3 × 10⁶ years. Adopting the definition of terminal velocity from King (2010; Equation (37) in that paper), and assuming this value is the velocity of the arcs, then with σ200 = 0.624, the terminal speed is  km s−1 ≈ 620 km s−1. (We note that the ≈300–600 km s−1 range fits within the simulations of Salo & Laurikainen 2000.) This value leads to dynamical ages of ∼1.2 × 10⁶ (inner) and ∼2.7 × 10⁶ (outer) years. The episodes are then separated by ≈1.5 × 10⁶ years. Consequently, if we assume the interaction actually occurred ≈50 MYr ago, then the observed feedback took some time to develop, with the arcs emerging over the past ≈106–7 years.
One significant question then arises: what was the material doing for ≈40 MYr, the time between the interaction of NGC 5195 with NGC 5194 and the outbursts? The answer could be "infalling": if we assume material started from rest and was located ≈1500 pc distant (approximately the current separation of the arm of NGC 5194 from the nucleus of NGC 5195), then ≈65 MYr must elapse before the gas reaches the nucleus. With an arbitrary initial speed of 100 km s−1, that time would be reduced to ≈15 MYr. Absent additional constraints, this estimate may be the best we can do.
We now move to estimating gas densities with the goal of calculating masses and cooling times for the arcs to compare with the dynamical age estimate. The Hα (Figure 5) arc provides one route to the matter density. The flux in the line emission, integrated over a rectangular region matching the Hα arc, and again adopting a thickness = 100 thick100 pc, leads to a volume V of 1.3 thick100 × 1063 cm3. Assuming the Lyman H lines are optically thick ("Case B" recombination) then L = nΛV and adopting an emissivity Λ of 2.59 × 10⁻¹³ cm3 s−1 (Osterbrock & Ferland 2005, Table 2.1), leads to a number density of ∼5/thick100 cm−3 or a mass estimate of ≈4 × 10⁶ M⊙. That value is mid-range for typical interstellar molecular clouds (Murray 2011).
A second estimate of the number density in the X-ray arcs follows from the X-ray vapec model normalization:
(Arnaud 1996). Assuming ne = np, z = 0.002, DA =8 d8 Mpc, and using the volume V as defined in the prior paragraph, then  cm−3 for the outer (inner) arc. The mass in each of the X-ray-emitting arcs is then ≈5.5 × 10⁴ M⊙ (5.7 (outer) and 5.3 (inner)) or about 1% of the Hα arc.
Given the mass disparity, can the X-ray arcs be pushing the Hα arc? Assuming the gas in the X-ray and the Hα arcs may be described by the ideal gas law, then the pressures for the Hα, outer, and inner X-ray arcs are 3.5 × 10⁻¹², 1.9 × 10⁻¹¹, and 4.3 × 10⁻¹¹ dyn cm−2, respectively. The X-ray arcs then have about a factor of 5–12 times higher pressure than the Hα arc, driving material outwards. The total kinetic energy of the X-ray arcs is ≈2 × 1053 erg.
A second check on our mass estimates is possible. If the outer arc swept clear the gas in the halo along that vector, then the mass in the second arc is an approximate measure of the rate of accumulation. We acknowledge that the second arc is not moving through precisely the same space, but the question remains: is it possible to sweep up the observed mass? Above, we estimated the mass in the second arc as ≈5.3 × 10⁴ M⊙ and the interval between episodes as ≈1.3 × 10⁶ years. Those values lead to an accumulation rate of ≈4 × 10⁻² M⊙ yr−1. Magorrian et al. (1998) developed a bulge mass-SMBH mass relation with updates by McConnell & Ma (2013) and Belfiori et al. (2012) and environmental dependencies explored by McGee (2013). The value of σ100 and the SMBH mass yield an estimated bulge mass/SMBH mass ratio of ≈1000, or a bulge mass of ≈(2–4) × 1010 M⊙.5 If we assume most of that mass is composed of ≤1 M⊙ stars given the color of NGC 5195, then some of those stars will have evolved off the main sequence to at least the asymptotic giant branch (AGB). AGB stars have typical mass loss rates of ≈10−8 M⊙ yr−1 (De Beck et al. 2010). If just 0.1% are AGB stars, then the mass available per year is ≈10−1 M⊙, more than sufficient to provide the swept-up mass observed. As a by-product, we would expect sector-to-sector differences in gas density and metals in these regions, a potential test of the overall interpretation described in this paper.
With densities in hand, we can estimate the cooling time for comparison with the dynamical time. We use Figure 1 of Gehrels & Williams (1993) which displays, for an optically thin gas with solar abundances, the cooling curve as a function of temperature for several processes (two-photon, recombination, bremsstrahlung, and line emission). For the measured temperatures of the arcs of ∼0.4 and 0.65 keV, line emission dominates the cooling (the next largest contributor, bremsstrahlung emission, contributes ≤10%). The cooling time is defined as

where Λ(T) is the cooling function. With values inserted, we obtain an estimated cooling time of ≈1–1.6 × 10⁷ years for the X-ray arcs. This estimated cooling time is about an order-of-magnitude larger than the dynamical time. We then expect X-ray spectra should be dominated by line emission, a prediction that could be checked using Hitomi (Takahashi et al. 2014).
To summarize, we can place a crude limit on the age of the arcs (∼1–3 × 10⁶ years) that is an order-of-magnitude lower than the cooling time for the arcs based on crude estimates of their velocities. Estimated densities (≈0.1–5 cm−3) lead to the masses of the arcs, which combined with the arcs' velocities (adopted as ∼600 km s−1), carry sufficient momentum to sweep up the Hα arc. The estimated densities are supported by an estimate of the normal stellar mass loss within the galaxy's nuclear volume over the lifetime of the arcs.
3.2. Additional Future Constraints on Source Parameters?
3.2.1. Transition Radius from Momentum- to Energy-driven Flow?
With regard to AGN feedback, we can estimate the radius of transition from momentum- to energy-driven flow (KP2015):
Assuming their approach is valid for NGC 5195, the critical radius is ≈230 pc or ≈58 at the adopted distance of M51. For comparison, the sphere of influence for the SMBH is
The X-ray arcs both lie outside of this critical radius and, within the context of KP2015, both arcs would fall into the energy-driven regime. Rcrit could easily be constrained with current-generation telescopes provided the extreme luminosity contrast of the nucleus versus its surroundings is overcome.
3.2.2. Another Burst?
Is there evidence of a third episode of feedback? If high-resolution spectroscopy of the nucleus of NGC 5195 reveals high-velocity absorption lines, then a third episode would be underway. We would expect any possible third episode to be weaker in the sense of lower mass in the outflowing material because the time interval between the current burst is less than the time between the two outbursts.
3.2.3. Star Formation?
Inspecting the Hα image reveals two or three knots of emission (depending upon one's definition of "knot"), strongly suggesting the development, perhaps the initial development, of H ii regions surrounding star formation. Given the pressure and densities involved, the expanding X-ray arcs should create the conditions for star formation through the Rayleigh–Taylor instability. If confirmed, this region in NGC 5195 would be a clear case of triggered star formation. Verification that stars are forming in the plowed material will require additional optical or infrared observations centered on the knots. Estimates of the ages of the star-forming complexes would aid in constraining the scenario described in this paper. In addition, careful inspection of the sectors along which the arcs have travelled in comparison to other sectors may provide a measure of the degree to which cold gas has been removed by the action of the expanding arcs, thereby establishing at least one timeline for galaxy evolution.
3.2.4. Azimuthally Limited Arcs?
That each arc is limited azimuthally may suggest an interpretation that the arcs are more similar to a bubble. That interpretation could also argue for the north–south differences: bubbles present on the south side of the nucleus need not also appear on the north side. However, a bubble implies a slow vertical rise, hence unlikely to lead a shock or to X-ray emission.6
Alternatively, King & Pringle (2006) describe a "chaotic accretion" scenario in which the orientation of the accretion disk changes after an accretion episode. This scenario is used to describe SMBH growth at high redshift. Perhaps NGC 5195 is a local analog of events that took place at high redshift. The chaotic accretion scenario leads to momentum feedback that is isotropic over long times. That suggests that over short times, feedback effects need not be isotropic. While we do not have any constraints on the orientation of an accretion disk in NGC 5195, a question immediately arises from the observed arcs—do their positions and separations constrain our understanding of the accretion episodes or the interactions of the galaxies in any fundamental way? At this moment, we do not have an answer, but such a question calls for additional simulations of the interactions.
3.2.5. Similar Objects?
Are there similar objects to NGC 5195? Locally, there appear to be very few—one recent object may be NGC 660 (Argo et al. 2015). It is described as an "unremarkable starburst" with a "polar-ring morphology and a LINER-type nucleus." It has an estimated SMBH mass of log MBH = 7.35 M⊙ and an Eddington ratio of 10−6. Both values are similar to the NGC 5195 values. Interestingly, Argo et al. (2015) infer that a flare occurred between 2008 and 2012. We suggest NGC 5195 lies at an intermediate stage between a flare in the SMBH and rings and bubbles observed in the outskirts of an AGN or intercluster medium. That the arcs originate with a SMBH, are cooling, and appear to be moving at high velocity, raises a possible third scenario7 that some of the high-velocity clouds observed in the Milky Way's halo (Wakker & van Woerden 1997) originate in a similar manner.
How do the NGC 5195 arcs fit into the overall developing picture of feedback? Several objects studied with Chandra have been shown to illustrate bubbles and outflows: arm-like shocked outflows in the halo of NGC 4636 (Jones et al. 2002); bubbles near the center of M84 (Finoguenov et al. 2008); outflows in the E galaxy NGC 4552 (M89) in the Virgo cluster (Machacek et al. 2006) and in the center of the NGC 5846 group (Machacek et al. 2011). The difference between NGC 5195 and these objects is perhaps the difference between a relatively steady influx of matter versus the transient influx to the SMBH in NGC 5195 resulting from the interaction with NGC 5194. That comment suggests that other interacting galaxies should exhibit similar reactions provided the interaction has occurred relatively recently.
4. SUMMARY
From X-ray and Hα images, we find two X-ray arcs on the south side ∼15''–30'' from the nucleus of NGC 5195; Hα arc lies just outside of the outer X-ray arc. The results for NGC 5195 are important for at least three reasons: (i) they demonstrate dynamical and active feedback; (ii) they may illustrate an example of triggered star formation; and (iii) the arcs are a "snapshot" intermediate in the evolution between winds detected in the X-ray spectra of nuclei of AGNs and the large-scale filaments and bubbles observed in the hot atmospheres of many massive galaxies as well as in groups and clusters.
NGC 5195 is important for another reason: it is an example, perhaps the only one detected to date, where at least four critical clocks are evolving simultaneously: one clock started with the interaction between NGC 5194 and NGC 5195; a second started with the star formation triggered by the interaction; a third started with the reaction of the SMBH to the accreted material from the interaction; and the last clock commenced with the episodic nature of the response of the SMBH—given an accretion pulse, how long before the response? The rates at which the clocks advance are not well-known, but NGC 5195 presents perhaps the nearest opportunity to at least constrain some or all of those rates. Knowledge of such rates may be important for studies of the early universe.
Additional observations of NGC 5195 are necessary including: (i) a deep Chandra observation north of NGC 5195 will ascertain the outflow symmetry to test the expectation of isotropic outflows; (ii) Hα velocities of both of the arcs and their surroundings, using an integral field spectrometer, will pin down motions of the blast waves and provide improved estimates of the mass of swept-up material; (iii) estimates of the ages of star clusters that appear to be forming in the swept-up material will further constrain the timeline; (iv) observations at wavelengths that peer through the dust may provide additional insights interior to the arcs, e.g., molecular outflows; (v) observations that look at the dust can determine whether it is optically thick (as noted in KP2015); (vi) polarization observations that resolve field behavior may illuminate the interaction of the magnetic field with the blast waves; and (vii) VLA observations using the A configuration, or VLBI, can study the radio emission in greater detail. Given the dynamic nature of the arcs, high-resolution observations should be repeated on a moderate time frame to probe possible time dependence.
We thank the referee for comments that improved our paper. The research of E.M.S. was partially supported by the Vaughan Family Endowment.
Footnotes
- 5
We note that this relation has a two orders-of-magnitude range for any given SMBH mass, but the range is not critical for our purposes: our intent in using the relation at this time is plausibility, not accuracy.
- 6
Bubbles do have X-ray-emitting rims because as they rise, they can sweep up hot gas in a galaxy's halo (Finoguenov et al. 2008). The NGC 5195 halo does not appear to be hot, hence we would not expect to see hot, rimmed bubbles.
- 7
Instead of accretion from outside the Milky Way, or supernova-driven fountains (Fraternali et al. 2015).