
Abstract
Oxide vapor phase epitaxy (OVPE) has attracted much attention as a highly efficient method for synthesizing high-quality bulk GaN crystals, but the mechanical properties of OVPE GaN have not been clarified. We measured the five independent elastic constants of the OVPE GaN by resonant ultrasound spectroscopy. The in-plane Young modulus E1 and shear modulus C66 of the OVPE GaN are smaller than those of the hydride vapor phase epitaxy GaN by 1.8% and 1.3%, respectively. These reductions agree with predictions by density functional theory calculations. We also calculated the Debye temperature, revealing that oxygen impurity decreases its magnitude.
Export citation and abstract BibTeX RIS

Content from this work may be used under the terms of the Creative Commons Attribution 4.0 license. Any further distribution of this work must maintain attribution to the author(s) and the title of the work, journal citation and DOI.
Gallium nitride (GaN) is in the limelight for use in power devices due to its excellent physical properties, such as high breakdown electric field and high mobility. 1,2) A drawback in GaN is the high fabrication cost for synthesizing wafers with large diameters, keeping high crystal quality. Several crystal growth methods have been proposed to overcome this problem. The oxide vapor phase epitaxy (OVPE) method is promising because it is capable of realizing thick single crystals without producing solid byproducts. 3–6) The OVPE GaN has the unique characteristic of allowing very high oxygen impurities, leading to low resistivity and optically black crystal color. Oxygen is a common impurity in GaN, and it acts as a donor. Thus, understanding its effect on crystal properties is a critical issue, and the relationship between the oxygen impurity and various properties of GaN (formation energy and energy level, 7,8) optical absorption, 9,10) and thermal conductivity 10–13)) has been studied extensively. However, there is no study regarding the oxygen-impurity effect on the elastic constants of GaN.
Elastic constants are important physical quantities because they are indispensable for designing devices. Indeed, for AlGaN/GaN high electron mobility transistors, they are needed to estimate the interfacial strain that creates the two-dimensional electron gas, 14,15) enabling us to comprehend the carrier transport properties. Elastic constants are also crucial for evaluating thermal properties. Oxygen impurities in GaN reduce its thermal conductivity. 11–13) While the mean sound velocity is used in thermal conductivity models, previous studies have calculated the thermal conductivity of GaN with oxygen impurities without accounting for a decrease in the sound velocity due to the lack of knowledge of the oxygen effect on its elasticity. 12,13) In this study, we present the elastic constants of the OVPE GaN involving a high oxygen impurity of 4.3 × 1020 cm−3 and compare them to those predicted by the density functional theory (DFT) calculation. We also computed its Debye temperature using the elastic constants.
Rectangular-parallelepiped wurtzite GaN grown by the OVPE method was used in this study. The in-plane specimen dimensions are 3.503 mm and 3.002 mm, and the thickness (along the c-axis) is 0.289 mm. The mass density calculated by specimen dimensions and the mass measured by an electronic balance is 6032 kg m–3. The resistivity and the oxygen concentration are 7.75 × 10⁻⁴ Ω cm and 4.3 × 1020 cm−3, respectively.
We used resonant ultrasound spectroscopy (RUS) 16–18) to study the elastic constants of the OVPE GaN. Because of the high impurity content, we can neglect the contribution of the piezoelectricity to the resonance frequencies, otherwise we need to consider the piezoelectricity simultaneously. 19,20) The specimen is put on two rod-type ultrasonic transducers and a needle-like thermocouple. 21–23) The specimen temperature during the measurement was 293 K. One transducer is connected to a function generator to vibrate the specimen at an intended frequency, and the other transducer detects its vibration. The detected signal is amplified using a broadband amplifier before being converted to a digital format by a digitizer. Subsequently, it is imported into a computer, and the Fourier transform is applied to extract the amplitude of the frequency component of the driving signal. We obtain the resonant spectrum by sweeping the driving signal frequency and measuring the corresponding detected signal amplitude.
Figure 1(a) shows the measured spectrum. In principle, the five independent elastic constants are inversely determined by comparing the measured and numerically calculated resonance frequencies. However, due to the difficulty of fabricating a thick GaN single crystal while keeping high crystal quality, the thickness of this specimen is significantly smaller than that of the in-plane dimensions, resulting in low accuracy of the C33 determination. Figure 1(b) shows the contributions of each elastic constant to the resonance frequencies  , indicating that the contribution of C33 is much lower than those of the other components.
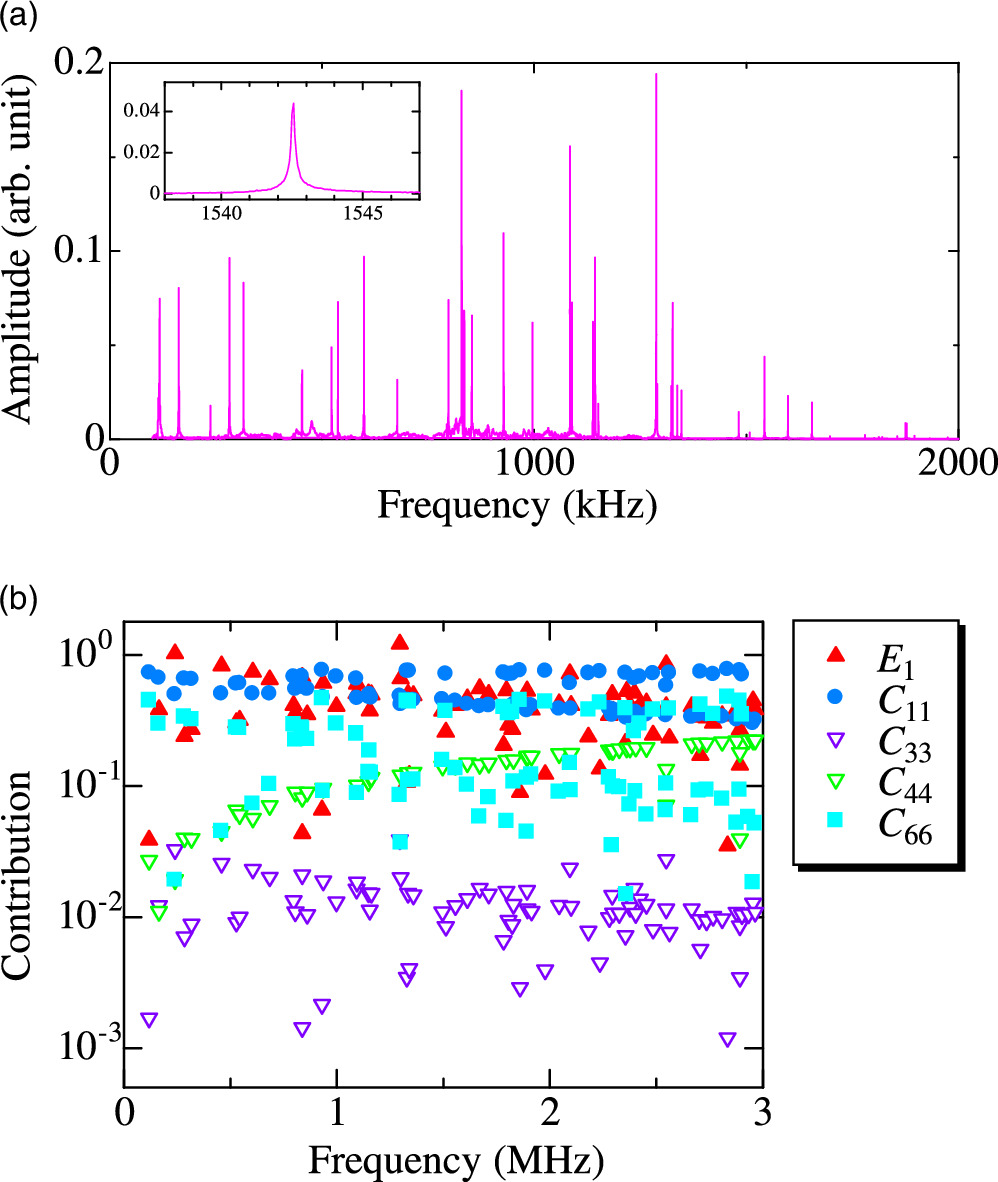
Fig. 1. (a) Measured resonant spectrum of the specimen. The inset shows an enlarged view of one resonance peak. (b) Contributions of elastic constants Cij and Young modulus along the basal plane E1 to resonant frequencies.
Download figure:
Standard image High-resolution imageTo avoid this problem, we measured the sound velocity along the thickness direction and independently determined C33. We employed a scanning acoustic microscope to measure the time of flight (ToF) of longitudinal ultrasonic echoes along the thickness direction. Then, C33 was derived using the obtained ToF and measured mass density and thickness. Note that the center frequency of the pulse is 180 MHz, and the estimated wavelength is 44 μm, well shorter than the specimen's thickness. We measured nine different points (a representative waveform is shown in Fig. 2) and used zero-crossing times to determine ToF. The obtained ToF is 71.7 ± 0.3 ns, and C33 is found to be 392 ± 3 GPa.
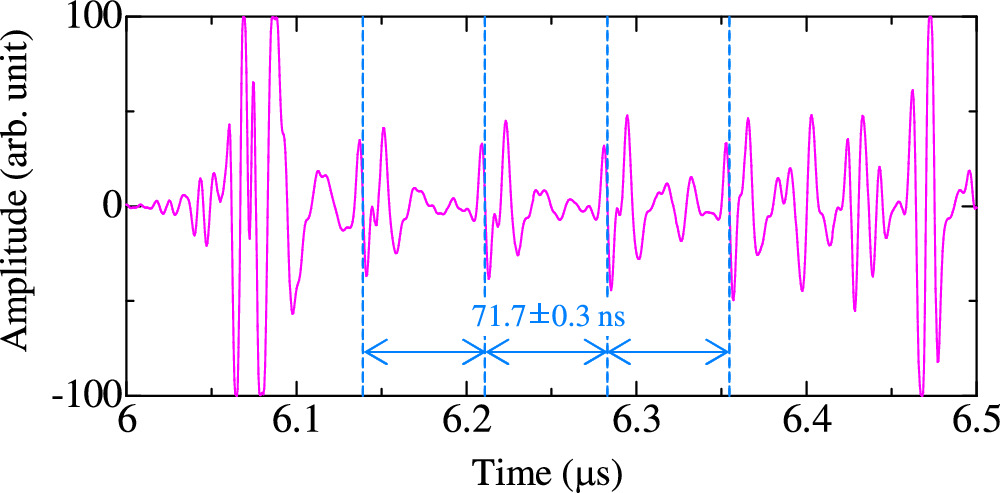
Fig. 2. Representative waveform measured by the scanning acoustic microscope along the thickness (c-axis) direction. The blue dashed line indicates the zero-crossing time for each echo.
Download figure:
Standard image High-resolution imageWe used 46 resonant modes to inversely determine the four remaining elastic constants (C11, C12, C13, and C44). For the inverse calculation, we numerically calculated resonance frequencies by the Ritz method with basis functions consisting of the product of Legendre polynomials involving orders of 24 or less. The rms error of resonant frequencies between measurement and calculation after convergence was 0.16%.
Table I shows the determined elastic constants and other reported values 19,24–30) for comparison. Differences in literature values are probably attributed to differences in specimen quality and measurement precision. The set of Cij for hydride vapor phase epitaxy (HVPE) GaN that we have previously reported using RUS takes nearly the average values of the literature. The specimen dimension and aspect ratio of the present OVPE GaN specimen are close to that of the HVPE GaN specimen, and both specimens are measured by RUS. Therefore, we can tell the oxygen impurity effect on elastic constants by comparing them. The specimen has a large aspect ratio between in-plane size and thickness, allowing the high accuracy measurement, especially in in-plane elastic constants (E1, C66, and C11. E1 denotes the Young modulus along the in-plane direction.). E1, C66, and C11 of the OVPE GaN are smaller by 1.8% and 1.3%, and larger by 0.4% than those of HVPE GaN, respectively.
Table I. Elastic constants Cij (GPa), in-plane Young modulus E1 (GPa), mass density ρ (kg m–3), and Debye temperature ΘD (K) of wurtzite GaN.
| Sample fabrication (or company), Shape/method | C11 | C12 | C13 | C33 | C44 | C66 | E1 | ρ | ΘD a | ΘD b |
|---|---|---|---|---|---|---|---|---|---|---|
| OVPE, bulk/RUS (This work) | 361.9 | 136.7 | 111.0 | 392.1 | 94.4 | 112.6 | 296.9 | 6032 | 625 | 621 |
| HVPE, bulk/RUS 19) | 360.3 | 132.1 | 93.4 | 391.0 | 99.3 | 114.1 | 302.3 | 6080 | 636 | 633 |
| Mitsubishi, bulk/RUS 24) | 359.4 | 129.2 | 92.0 | 389.9 | 98.0 | 115.1 | 303.5 | 6070 | 635 | 631 |
| Chloride vapor phase transport, bulk / RUS 25) | 377 | 160 | 114 | 209 | 81.4 | 109 | 284 | 6102 | 569 | 584 |
| Ammonothermal, bulk/Bulk acoustic waves 26) | 366.9 | 135 | 97.5 | 398.1 | 99.1 | 116.0 | 307.0 | 6087 | 638 | 634 |
| Not specified, needle-like single crystal/Brillouin 27) | 390 | 145 | 106 | 398 | 105 | 123 | 324 | 6095 | 653 | 653 |
| MOCVD, thin film/Brillouin 28) | 365 | 135 | 114 | 381 | 109 | 115 | 300 | 6089 | 642 | 657 |
| MOCVD, thin film/Brillouin 29) | 374 | 106 | 70 | 379 | 101 | 134 | 337 | N/A | 660 c | 650 c |
| Kyma, bulk/SAW 30) | 345 | 128 | 129 | 430 | 96.5 | 109 | 280 | 5986 | 623 | 623 |
| Literature statistics | ||||||||||
| Mean | 367 | 134 | 102 | 372 | 99 | 117 | 305 | 6073 | 632 | 633 |
| Std. dev. (%) | 3.7% | 11.5% | 17.6% | 18.2% | 8.2% | 7.1% | 6.2% | 0.7% | 4.4% | 3.6% |
a Debye temperature calculated by Anderson's method. 43) b Debye temperature calculated by Siethoff's method. 45) c ρ = 6081 kg m–3 is assumed for the calculation.
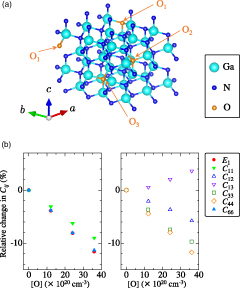
To investigate the effect of oxygen impurities on the elastic constant, we performed density functional theory calculations using the Vienna ab initio simulation package. 31). It is reported that the local density approximation (LDA) can predict elastic constants well in GaN, 32) and we adopted it by employing the projector augmented wave method. 33,34) We considered the oxygen impurity of substitution on the nitrogen site (ON); this type of substitution is regarded as a common impurity in GaN. 35,36) We used 72 atom 3 × 3 × 2 supercells with zero to three oxygen atoms. Figure 3(a) shows the oxygen positions of the three oxygens case (VESTA was used for the visualization 37)). The two-oxygen, one-oxygen, and no-oxygen cases were investigated by excluding the atoms of O3, O3, and O2, and O3 to O1, respectively. The cutoff energy for the plane wave was 500 eV, and the k-point mesh was 3 × 3 × 4 in each cell. The following steps were taken to calculate the elastic constants. First, a geometry optimization was performed to determine a stable lattice structure. Next, the elastic constants were determined by calculating the total energy under various strains within ±1% and performing the quadratic-function fitting. 38) The difference in the lattice constants between calculation and experiment (values of HVPE GaN are shown in Table II) is 0.10% for a and −0.02% for c in the cell without oxygen impurities, and 0.27% for a and 0.64% for c in the cell containing three oxygen atoms. Figure 3(b) and Table II show the elastic constants calculated at various oxygen concentrations. Table II also includes the calculated values from previous studies. 39–41) All components, except for C13, linearly decrease with increasing oxygen concentration. The estimated changes for E1 and C66 in the OVPE GaN with oxygen impurities of 4.3 × 1020 cm−3 are both −1.4%, which is close to the decrements compared to the experimental values of the HVPE GaN measured by RUS shown in Table I. There is a contradiction between the experiment and DFT calculation in C11:C11 of the OVPE GaN is higher than that of the HVPE GaN in the experiment. As can be seen in the figure, the decrease in elastic constants due to oxygen impurities is greater for E1 and C66 than for C11. Therefore, the difference in the sensitivity of Cij to the oxygen impurity may account for the absence of a decrease in C11. Other components of Cij exhibit different values to that of HVPE GaN; however, it is difficult to conclude that oxygen impurities are the reason for these changes due to the low contributions of Cij to resonance frequencies.
Fig. 3. (a) Supercell of wurtzite GaN with substitution of oxygen to nitrogen sites. (b) Oxygen-impurity effect on the elastic constants.
Download figure:
Standard image High-resolution image
Table II. Calculated elastic constants Cij (GPa), in-plane Young modulus E1 (GPa), and lattice constants a, c (Å) of wurtzite GaN. [O] (×1020 cm−3) denotes the oxygen impurity concentration.
| [O] | C11 | C12 | C13 | C33 | C44 | C66 | E1 | a | c | c/a | |
|---|---|---|---|---|---|---|---|---|---|---|---|
| This work (calc./LDA) | 0 | 371 | 154 | 118 | 405 | 92 | 108 | 294 | 3.187 | 5.184 | 1.627 |
| 12 | 360 | 151 | 118 | 390 | 88 | 104 | 283 | 3.191 | 5.197 | 1.629 | |
| 24 | 348 | 149 | 120 | 375 | 85 | 100 | 270 | 3.195 | 5.208 | 1.630 | |
| 36 | 338 | 146 | 122 | 365 | 81 | 96 | 260 | 3.198 | 5.219 | 1.632 | |
![$\tfrac{{{dC}}_{{ij}}}{d[{\rm{O}}]}\times \tfrac{1000}{{C}_{{ij}}(0)}$](https://content.cld.iop.org/journals/1882-0786/17/1/016501/revision2/apexad0ba2ieqn2.gif) (×10−20 cm3) (×10−20 cm3) | −2.51 | −1.57 | 1.03 | −2.74 | −3.22 | −3.18 | −3.24 | ⋯ | ⋯ | ⋯ | |
| Reference 4 (exp./HVPE GaN) | ⋯ | ⋯ | ⋯ | ⋯ | ⋯ | ⋯ | ⋯ | ⋯ | 3.1896 | 5.1854 | 1.6257 |
| Reference 4 (exp./OVPE GaN) | 4.3 | ⋯ | ⋯ | ⋯ | ⋯ | ⋯ | ⋯ | ⋯ | 3.1899 | 5.1852 | 1.6255 |
| Reference 39 (calc./LDA) | 0 | 396 | 144 | 100 | 392 | 91 | 126 | 333 | 3.17 | 5.13 | 1.618 |
| Reference 40 (calc./LDA) | 0 | 350 | 140 | 104 | 376 | 101 | 115 | 283 | 3.210 | 5.237 | 1.631 |
| Reference 41 (calc./LDA) | 0 | 334 | 132 | 99 | 372 | 86 | 101 | 271 | 3.232 | 5.268 | 1.630 |
Finally, we have computed the Debye temperature from the Cij . There are two ways to calculate it based on elasticity. One is a formula directly derived from the Debye model, a well-known approach. The other is a semi-empirical method taking a correspondence between Debye temperatures from heat capacity measurements and the elastic constants. This method allows us to calculate it directly using Cij without estimating sound velocity in the Debye model. We present the Debye temperature in these two ways because the value depends on the measurement method. 42)
Firstly, according to Anderson's method, it is given by the following relations: 43)


Here, h, and kB denote Planck's and Boltzmann's constants, respectively, Va is the atomic volume, and vm is the mean sound velocity in the solid. vs and vl are averaged shear and longitudinal sound velocities obtained by the Hill averaging method. 44) Using our Cij , we obtain ΘD = 625 K for the OVPE GaN. For comparison, we present the values for other GaN in Table I. As described previously, the reported sets of Cij are inconsistent and vary significantly. Hence, we compare it with especially for the HVPE GaN measured by RUS, which is 636 K.
The other method to calculate ΘD elastically is using an averaged shear modulus related to transversal acoustic phonon modes in specific lattice directions. Siethoff and Ahlborn proposed the following relations: 45)


Here, Ch is a constant, s is the number of atoms in the unit cell, a is the lattice constant along a-axis, and M is the atomic weight. Gh is the geometrical mean of the shear modulus along the basal plane and the c-axis. Using their fitted value of Ch = 5.94 × 10¹¹, we find that ΘD is 621 K for the OVPE GaN and 633 K for the HVPE GaN.
The ΘD calculated from the two methods are not exactly the same but generally agree within a few K. The decrement of ΘD in the OVPE GaN is ∼2% compared to the HVPE GaN. Therefore, we experimentally find that oxygen impurities in GaN decrease the elastic constants and then the Debye temperature by ∼2%.
In conclusion, we measured the elastic constants of the OVPE GaN for the first time using resonant ultrasound spectroscopy. The in-plane elastic constants of E1 and C66 are lower than those of the HVPE GaN by ∼1.5%. We performed the DFT calculations to evaluate the oxygen impurity effect on the elastic constants, and find that all components except for C13 are decreased by the oxygen impurity. The decrements of E1 and C66 agree with the measured decrements. We also calculate the Debye temperature using the set of Cij , and it shows a lower value for the OVPE GaN than that for the HVPE GaN by ∼2%. We thus experimentally find that oxygen impurity decreases the Debye temperature of GaN.