
Abstract
Temporal focusing (TF) microscopy has a trade-off between temporal resolution, optical sectioning capability, and field of view. To improve this trade-off, we demonstrate time-multiplexed multi-line temporal focusing (TM-ML-TF) microscopy, which combines the time-multiplexed TF technique with multi-line focusing using a digital micromirror device. Compared with those for TF microscopy, the optical sectioning capability and the signal-to-background ratio were improved by factors of 2.5 and 4.17, respectively. In addition, by applying post-processing for structured illumination microscopy to TM-ML-TF microscopy, the optical sectioning capability and the signal-to-background ratio were further enhanced by factors of 1.2 and 4.63, respectively.
Export citation and abstract BibTeX RIS

Content from this work may be used under the terms of the Creative Commons Attribution 4.0 license. Any further distribution of this work must maintain attribution to the author(s) and the title of the work, journal citation and DOI.
Multiphoton microscopy (MPM) has become a powerful tool for three-dimensional imaging of the structure of, and activity in, biological tissues. 1–3) The nonlinear dependence of the multiphoton signal intensity on the excitation intensity of the tightly focused pulse inherently provides optical sectioning capability in three dimensions. Since the image is acquired by scanning the focal spot point-by-point, the image acquisition time in laser scanning MPM is longer than that in wide-field microscopy. In order to overcome this disadvantage, temporal focusing (TF) microscopy, 4,5) which provides wide-field multiphoton illumination with optical sectioning capability, has been introduced to eliminate the scanning process. Scanningless depth-resolved imaging is a vital technique for observing rapid biological phenomena 6) in a wide field of view. 7,8) TF is achieved by focusing the spectrally dispersed pulse, which is generated by a diffraction grating. However, the optical sectioning capability of wide-field TF microscopy is lower than that of point-by-point scanning MPM because wide-field TF microscopy does not have spatial focusing characteristics along the direction (y) perpendicular to the dispersion direction (x). 9) By using line-focusing along the y-direction, the optical sectioning capability of line-by-line scanning TF microscopy becomes comparable to that of point-by-point scanning MPM. 9–11)
While it improves the optical sectioning capability, conventional mechanical line scanning restricts the image acquisition time. Multi-line TF (ML-TF) microscopy enables us to acquire two-dimensional images at high speed by reducing the number of scans along the y-direction. 12) However, the narrower focused line spacing increases the out-of-focus background fluorescence. This is because the out-of-focus excitation is enhanced by the interference between the multiple defocused beams that pass through neighboring line foci. 12,13) The same problem is encountered in multifocal MPM with a microlens array and can be solved by introducing a temporal delay between the beamlets so that excitation pulses reach the neighboring foci at different time points. 14–16) By using a reflective echelle grating with a larger period, 17) the time-multiplexed (TM) technique has been applied to multifocal wide-field TF microscopy without laser scanning, and provides an optical sectioning capability comparable to that of line-by-line scanning TF microscopy. However, the field of view (FOV) is limited by the output laser power, and the largest FOV diameter achieved to date is only 6 μm. The narrow FOV in TM-TF microscopy is also related to an imaging magnification of 1000×, from the sample to the echelle grating, which is necessary to achieve diffraction-limited focusing of each beamlet from the echelle grating. Although a higher laser power expands the FOV, the practical beam diameter on the echelle grating is limited by aberration. TM-TF microscopy using a virtually imaged phased array (VIPA) has also been demonstrated to improve the FOV. 18) By using a chirped pulse amplification (CPA) laser, the FOV has been expanded to 20 × 15 μm. However, the available laser power is limited by the damage threshold of the VIPA where the laser is line-focused.
Here, we demonstrate TM-ML-TF microscopy to relax the diffraction-limited condition satisfied by the imaging magnification from the sample to the echelle grating. As shown in Fig. 1(a), the TM-ML-TF microscope consists of two 4-f optical systems. A transmission echelle grating with a step thickness (d) of 0.55 mm and a step width (w) of 1.02 mm and a digital micromirror device (DMD: Texas Instruments, DLP4500NIR) are placed at the conjugate position of the focal plane of a water-immersion objective lens with an NA of 1.2 (UPLSAPO 60 × W, Olympus). An output beam from a custom-built Yb-doped fiber CPA system, 19) which produces 96 fs, 1.4 μJ, 1055 nm pulses at a repetition rate of 3.3 MHz, is input into the echelle grating. The beam is split into multiple beamlets with a temporal delay between them, which is induced by the difference in refractive index between the glass and air at each step of the echelle grating. Since the temporal delay caused by a transmission echelle grating with a step thickness of 0.55 mm is longer than the coherence time of excitation pulses with a duration of 96 fs, the beamlets do not interfere with each other near the transmission echelle grating. Thus, each beamlet with a beam width (y-direction) of 1.02 mm, which is the step width of the echelle grating, is diffracted along the y-direction and focused on the DMD in the first 4-f optical system with a magnification of 1/4. Because the group velocity dispersion for the BK7 glass is 23.1 fs2 mm−1, the change in the pulse duration for each step of the echelle grating is negligibly small.

Fig. 1. (Color online) (a) Schematic diagram of TM-ML-TF microscopy using transmittance echelle grating. DM: dichroic mirror, OB: objective lens, SPF: short-pass filter. (b) Spectral dispersion and amplitude distribution modulation by DMD.
Download figure:
Standard image High-resolution imageAs shown in Fig. 1(b), the DMD is used both as a blazed grating to generate spectrally dispersed pulses along the x-direction 20) and a spatial light modulator to modulate their amplitude distributions. 21–24) The beamlets on the DMD are projected on the focal plane of the objective lens in the second 4-f optical system with a magnification of 1/125. Without amplitude modulation by the DMD, the beamwidth of the beamlets at the focal plane is 2 μm, which is almost twice the 1.1 μm beam width for the diffraction-limited focal spot. Even in this situation, amplitude modulation by the DMD, which exhibits multi-line patterns with a projected line width smaller than 1.1 μm, yields diffraction-limited focal spots. To eliminate the gap between the lines, line scanning of the beam along the y-direction is required, although only a few lines need to be scanned. TM-ML-TF images can be obtained by integrating the fluorescence detected by the camera over the beam scanning region. If the beam scanning time is shorter than the readout time of the camera, the image acquisition time does not increase. Beam scanning is performed by shifting the multi-line patterns displayed on the DMD in the same way as in structured illumination microscopy (SIM), 21–24) as shown in Fig. 1(b). By recording the fluorescence images of multi-line patterns with different pattern shifts, we can also reconstruct the image with post-processing for SIM to enhance the optical sectioning capability and to reject background out-of-focus and scattered fluorescence. 25–27)
In our demonstration, the line width and line spacing for the multi-line patterns on the DMD were adjusted to 64.8 μm and 194.4 μm, respectively. The fluorescence signal was collected with the same objective lens and separated from the excitation pulses using a dichroic mirror (DM; Semrock, FF875-Di01). To remove the residual excitation pulses, a short-pass filter (SPF; Semrock, FF01-890/SP-25) was used. The fluorescence images of 6 multi-line patterns with different pattern shifts were recorded with a water-cooled complementary metal-oxide-semiconductor (CMOS) camera (Hamamatsu Photonics, ORCA-Flash4.0). TM-ML-TF images were reconstructed by integrating the fluorescence images. TM-ML-TF-SIM images were reconstructed from the same fluorescence images used in the TM-ML-TF image reconstruction. 25,26) In TF and TM-TF microscopy, the amplitude distribution was not modulated by the DMD. In line-TF microscopy, a single line pattern on the DMD was projected to the sample. In TF, line-TF, and ML-TF microscopy, the echelle grating was removed. The FOV diameter was 30 μm.
To determine the effective NA along the y-direction, we measured the beam profiles at the conjugate position of the pupil plane of the objective lens (Fig. 2). The white circle indicates the back aperture of the objective lens. Since the pulse was spectrally dispersed in the x-direction by the DMD, the beam profile for TF microscopy was line-shaped. For ML-TF microscopy, a multi-line beam was observed. This is because the beam profile at the pupil plane is expressed by the Fourier transformation of the multi-line pattern generated by the DMD due to its high spatial coherence. The beam for TM-TF microscopy was spread in the y-direction because of diffraction by the echelle grating. However, the back aperture of the objective lens was unfilled in the y-direction. On the other hand, the beam for TM-ML-TF microscopy filled the back aperture completely in the y-direction and did not have a multi-line shape because the spatial coherence in the y-direction was degraded by the echelle grating. We found that the effective NA along the y-direction was maximized in TM-ML-TF microscopy.
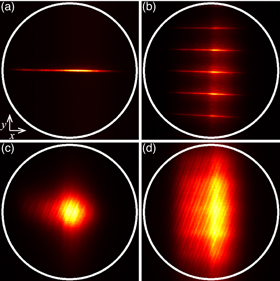
Fig. 2. (Color online) Beam profiles at back focal plane of objective lens in (a) TF, (b) ML-TF, (c) TM-TF and (d) TM-ML-TF microscopy. The white circle indicates the back aperture of the objective lens.
Download figure:
Standard image High-resolution imageTo characterize the optical sectioning capability of TM-ML-TF microscopy, we measured the signal intensity distribution of two-photon excited fluorescence (TPEF) from a single layer of 200 nm fluorescent beads (Molecular Probes, F8809) along the axial direction. The input power was 55 mW, and the exposure time was 10 ms. 200 x–y cross-sectional images were acquired by scanning the objective lens, which was mounted on a piezoelectric transducer stage (nPoint, nPFocus100HD), in the axial direction with a step of 200 nm. To determine the optical sectioning capability, the signal distribution along the axial direction was obtained by integrating the fluorescence signal over the x–y cross-sectional images. Figure 3 shows the signal distributions acquired using TF, ML-TF, TM-TF, line-TF and TM-ML-TF microscopy, and TM-ML-TF-SIM. The full width at half maximum (FWHM) for TF, ML-TF, TM-TF, line-TF and TM-ML-TF microscopy, and TM-ML-TF-SIM was 4.06, 1.62, 3.90, 1.57, 1.62, and 1.36 μm, respectively. The FWHM for TM-TF microscopy was almost the same as that for TF microscopy because the imaging magnification from the sample to the echelle grating was not satisfied for the diffraction-limited condition. On the other hand, the FWHM for ML-TF and TM-ML-TF microscopy was comparable to that for line-TF microscopy and was 2.5 times narrower than that for TF microscopy because the line width of the multi-line patterns on the DMD was reduced to generate diffraction-limited focal spots. The signal distribution for ML-TF microscopy has multiple side lobes due to interference between the multiple defocused beams, while that for TM-ML-TF microscopy has a single peak because the interference between the multiple defocused beams is suppressed. These results indicate that TM-ML-TF microscopy allows us to relax the diffraction-limited condition satisfied by the imaging magnification from the sample to the echelle grating. We also found that the optical sectioning capability for TM-ML-TF microscopy could be further enhanced by a factor of 1.2 by simply using post-processing for SIM.
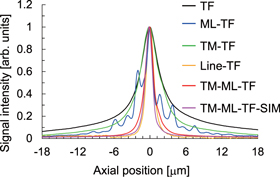
Fig. 3. (Color online) (a) Axial signal distributions of a single layer of 200 nm fluorescent beads for TF (black), ML-TF (blue), TM-TF (green), line-TF (yellow), and TM-ML-TF (red) microscopy, and TM-ML-TF-SIM (pink).
Download figure:
Standard image High-resolution imageWe performed TPEF imaging of fluorescent beads in a tissue-like phantom using TF, ML-TF, and TM-ML-TF microscopy. The phantom contained 200 nm and 2 μm fluorescent polystyrene beads at concentrations of 1.7 × 10¹¹ and 4.3 × 10⁷ beads ml−1, respectively. Figures 4(a)–4(d) show x–y cross-sectional TPEF images acquired by TF, ML-TF, and TM-ML-TF microscopy, and TM-ML-TF-SIM, respectively. The white dotted circle in Fig. 4(a) indicates the out-of-focus background fluorescence from the 2 μm beads located at different penetration depths. We also detected background fluorescence from the 200 nm beads stacked in the axial direction. Figure 4(e) shows the normalized signal distributions along the green dotted line in Fig. 4(a). To quantify the background suppression, we obtained the background intensities by taking the average of TPEF intensities at 11 pixels ranging from −3 μm to −1 μm in Fig. 4(e). The contrast ratios between the signal intensity from the 200 nm bead at 2 μm and the background intensity for TF, ML-TF, and TM-ML-TF microscopies, and TM-ML-TF-SIM were 5.12, 5.99, 21.4, and 99.0, respectively. The background intensity for ML-TF microscopy is almost the same as that for TF microscopy. On the other hand, the background intensity for TM-ML-TF microscopy could be suppressed by a factor of 4.17, as compared with that for TF microscopy. The signal-to-background ratio for TM-ML-TF microscopy could be further improved by a factor of 4.63 by using post-processing for SIM.
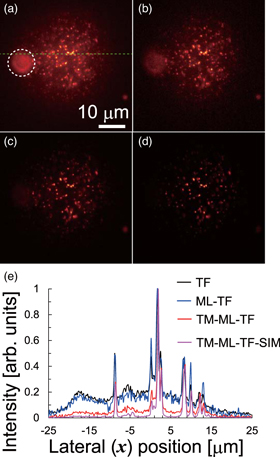
Fig. 4. (Color online) TPEF images of fluorescent beads in tissue-like phantom. x–y cross-sectional images at depth of 53 μm acquired by (a) TF, (b) ML-TF and (c) TM-ML-TF microscopy, and (d) TM-ML-TF-SIM. (e) Normalized signal distributions along green dotted line in panel (a).
Download figure:
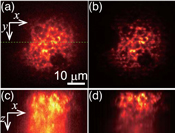
Standard image High-resolution imageFinally, we employed TM-ML-TF microscopy to image fixed mouse brain tissue. The brain was fixed with 4% paraformaldehyde (PFA). A coronal section of the cerebral cortex was prepared, and actin was stained with rhodamine phalloidin. Figures 5(a) and 5(b) show x–y cross-sectional TPEF images of the actin of fixed mouse brain tissue for TF and TM-ML-TF microscopies, respectively. The x–z cross-sectional images in Figs. 5(c) and 5(d) were reconstructed from 50 x–y cross-sectional images. The actin structure is clearly visible in the x–z cross-sectional image for TM-ML-TF microscopy, unlike in the image for TF microscopy. This indicates that TM-ML-TF microscopy can provide better optical sectioning capability and higher image contrast.
Fig. 5. (Color online) TPEF images of fixed mouse brain tissue stained with rhodamine phalloidin. (a), (b) x–y cross-sectional (a) TF and (b) TM-ML-TF images acquired at depth of 5 μm. (c), (d) x–z cross-sectional (c) TF and (d) TM-ML-TF images along dotted line indicated in (a).
Download figure:
Standard image High-resolution image
In conclusion, we have demonstrated TM-ML-TF microscopy to enhance the optical sectioning capability and image contrast even when the imaging magnification from the sample to the echelle grating is not satisfied for the diffraction-limited condition. The optical sectioning capability and the signal-to-background ratio were enhanced by factors of 2.5 and 4.17, respectively, as compared with those for TF microscopy. By applying post-processing for SIM to TM-ML-TF microscopy, the optical sectioning capability and the signal-to-background ratio were further improved by factors of 1.2 and 4.63, respectively. These results indicate that the combination of SIM and TM-ML-TF microscopy, which suppresses the generation of the out-of-focus background fluorescence, could be a powerful tool for imaging biological tissues. This is because a wide dynamic range in fluorescence detection is required for post-processing in SIM. In addition, even if the background fluorescence can be rejected, the intensity fluctuation noise and the shot noise from the background fluorescence remain. Without post-processing for SIM, the image acquisition time in TM-ML-TF microscopy could be reduced by integrating the fluorescence detected by the camera over the laser scanning region with a fast scanner such as a resonant scanner or a micro-electro-mechanical systems scanner. The TM-ML-TF technique could also enhance the axial resolution of multiphoton-patterned illumination for photostimulation. 28–30) Since the axial resolution could not be enhanced by post-processing after imaging in the case of photosimulation, the reduction of the axial excitation volume by the TM-ML-TF technique promises to become a key technology.
Acknowledgments
We are truly grateful to the Advanced Manufacturing Support Team at RIKEN Center for Advanced Photonics for manufacturing the transmission echelle grating. This work was supported by JST CREST (Grant Nos. JPMJCR1851 and JPMJCR1921), MEXT/JSPS KAKENHI (Grant No. JP18H04750 "Resonance Bio"), and the Nakatani Foundation for Advancement of Measuring Technologies in Biomedical Engineering grant program.