
Abstract
We proposed a NIR spectroscopy system that measures multiple types of gases using a plasmonic photodetector. We formed a gold diffraction grating on a silicon substrate to create a plasmonic photodetector and conducted gas spectral measurements in the NIR region. As a result, we could measure the transmission spectrum of water vapor gas at a concentration of 2%. Furthermore, we could measure ethanol gas transmittance at different concentrations of 4.5% and 2.7%, and change in transmission depending on concentration. Lastly, the transmission spectrum of 10% NH3 gas was measured. Since these results are consistent with evaluations using Fourier transform IR spectroscopy, it was confirmed that the proposed gas measurement can be applied to multiple types of gas sensing.
Export citation and abstract BibTeX RIS
1. Introduction
Small gas sensors are widely used to measure gas concentration on site. 1) These sensors find applications in various fields, including the detection of explosive gases, air quality analysis, and odor evaluation. 2,3) There are multiple methods for gas measurement, mainly classified into electrical methods using oxide semiconductors, 4–7) mechanical methods using resonant vibration by quartz crystal microbalance, 8,9) and optical methods measuring gas light absorption. 2,10–20) Among these, optical gas sensors are suitable for long-term measurements and high gas concentration measurements, as they can measure gas concentration without contacting the gas. 2) In particular, non-dispersive IR (NDIR) sensors 11,16,19,20) typically measure the transmitted light at the absorption wavelength band of the target gas and compare it with the transmitted light intensity of the reference wavelength to quantify and detect harmful gases such as CO2 in places where the installation area is limited due to their small size. On the other hand, since it targets specific gas species, there has been an issue in applying for multiple types of gases, which presents different absorption spectrum. If gas absorption is measured spectrally at multiple IR wavelengths, not just a specific IR wavelength, it can apply to multiple types of gases with a single sensor architecture, which will potentially expand the range of sensor applications. 21,22) However, conventional spectrometers disperse light with a diffraction grating, and a certain optical path length is required inside the sensor, which has been a problem making the sensor miniaturization difficult. 23)
In response to this problem, our group has proposed a NIR spectroscopic method using a gold diffraction grating plasmonic photodetector as an IR spectroscopy method that does not require an optical path length. 24–26) This photodetector can excite surface plasmon resonance through a diffraction grating formed on a silicon substrate. Due to surface plasmon resonance, free electrons in gold are excited, and by having these free electrons flow into the silicon substrate, it has the function of measuring the surface plasmon resonance as an electric current. In this photodetector, surface plasmon resonance occurs at a specific incidence angle for a particular wavelength, so it can selectively detect NIR light by wavelength. Utilizing this function, the incident IR light spectrum can be reconstructed by relatively changing the angle of the device to the incident light and measuring electric current data while changing the incidence angle. Unlike conventional diffraction grating spectrometers, it is not necessary to measure diffracted light with a detector placed at a distance, and NIR spectroscopic measurements can be completed by sensing an incident light on the sensor surface. Therefore, it is a method that has advantages for miniaturization. Currently, since components of the system such as the light source are large, the miniaturization of the entire system is still in progress. However, we are conducting research on the miniaturization of MEMS for the photodetector, which is the core component of the system by placing a plasmonic photodetector on a MEMS cantilever and changing the angle of the cantilever by actuation. In this way, the incidence angle change and light detection functions can be integrated into a small sensor. 24,26) However, at present, gas sensing by NIR spectroscopy using this plasmonic photodetector is limited only to the measurement of specific concentrations of ethanol gas, and the changes in response when measuring different concentrations and the adaptability to other gas measurements have not been verified. 25) Therefore, an additional evaluation of whether the sensor can be deployed for other types of gases has not been made. In this study, we verified the possibility of deploying NIR gas sensing by spectroscopy to measure water vapor, ethanol gas at different concentrations, and NH3 gas. In the conference paper, 27) basic data and the water vapor transmittance were reported. In this paper, we included other gas responses and further discussed the possibility of spectroscopy sensing based on the plasmonic photodetector.
2. Principle
The gas detection method in this study is shown in Fig. 1, which is almost the same as the one reported in Ref. 25. The gas sensing principle and procedure are as follows.
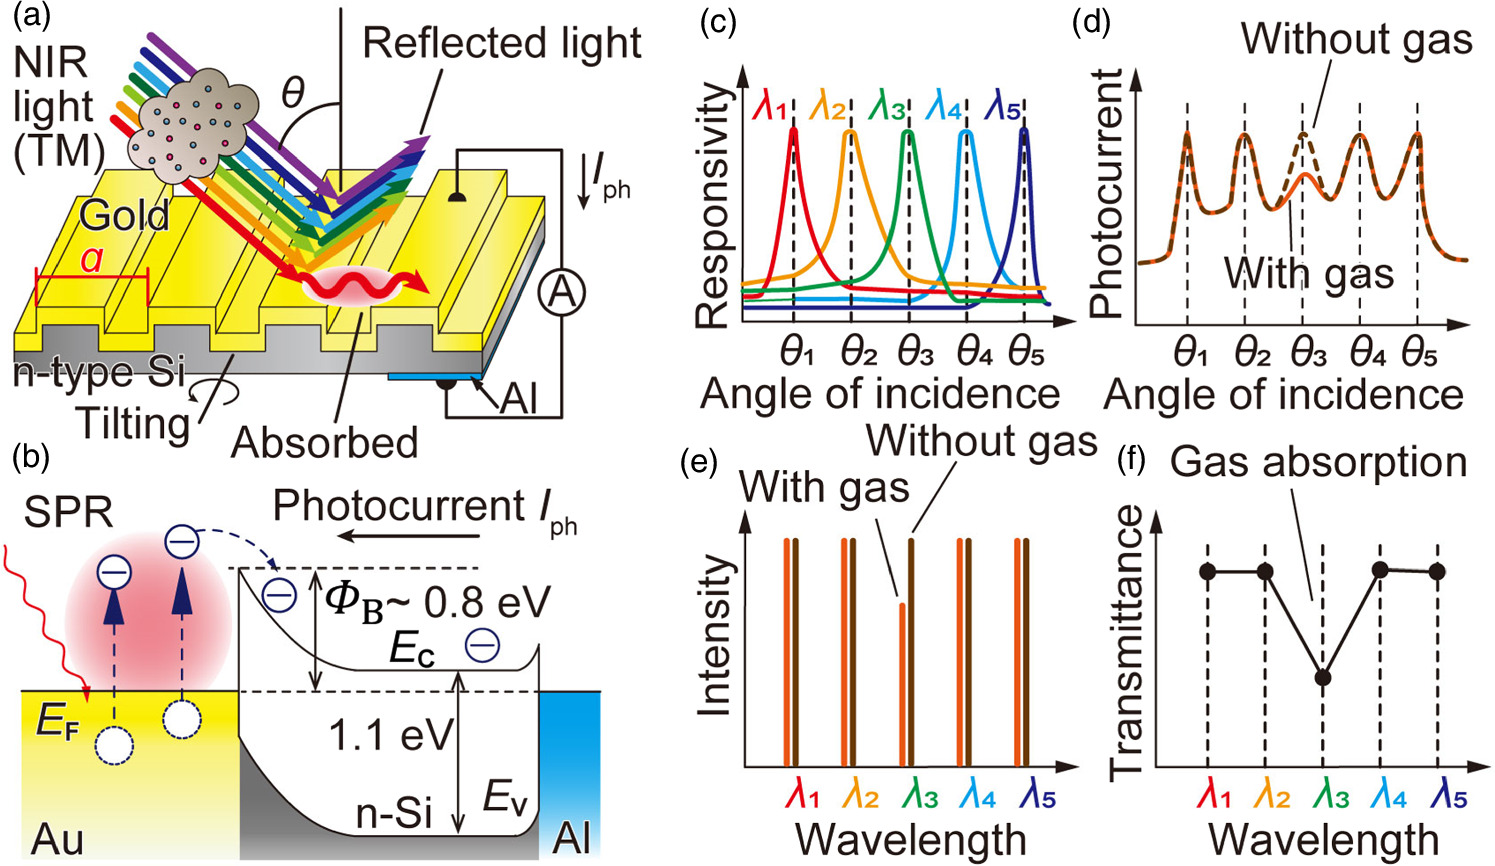
Fig. 1. Gas sensing procedures, (a) Gas transmission spectrum measurement, (b) The energy band diagram for the photocurrent detection, (c) The responsivity spectrum for each monochromatic light incidence with different wavelength, (d) Obtained photocurrent with and without gas while tilting the photodetector, (e) The reconstructed transmitted spectrum schematics with and without gas, (f) The calculated gas transmittance by dividing the transmittance spectrum of the gas by that of the inert gas.
Download figure:
Standard image High-resolution image2.1. Photocurrent measurement using surface plasmon resonance
The proposed photodetector absorbs the corresponding incident wavelength at a specific incident angle and outputs a current. Figure 1(a) shows a schematic diagram of the photodetector used in this study. The photodetector consists of a gold diffraction grating formed on the surface of n-type silicon and an aluminum thin film on the backside. When a collimated TM wave on the incident plane of wavelength λ is incident on the gold diffraction grating, diffraction of the incident light occurs in the direction dependent on the pitch of the diffraction grating. In this case, the grating grooves are perpendicular to the incident plane of the light. When the matching condition Eq. (1) is satisfied in terms of the wave number component in the direction parallel to the device surface, the incident light couples with the surface plasmon resonance. 28)

Here, ω represents the angular frequency of the incident light, θ is the incidence angle, a is the pitch width of the gold diffraction grating, l is the order of diffraction, c is the speed of light in vacuum, εair is the dielectric constant of air, and εAu is the dielectric constant of gold. When this condition is satisfied, the energy of the incident light is absorbed by the gold as surface plasmon resonance. The energy of this incident light excites the electrons in gold through the surface plasmon resonance. As a result, hot electrons with high energy are generated within the gold.
On the other hand, a Schottky barrier is formed at the interface between the gold film of the diffraction grating and the n-type silicon, as shown in Fig. 1(b). The energy supplied to the electrons allows them to overcome this Schottky barrier, converting them into a photocurrent Iph. This photocurrent is generated due to the surface plasmon resonance, so the photocurrent shows a peak at incident angles and wavelengths that satisfy Eq. (1). By changing the incident angle θ, the resonance condition in Eq. (1) can be changed, thus changing the resonant wavelength λ. Generally, since the band gap Eg of silicon is 1.1 eV, only IR light shorter than a wavelength corresponding to that energy, 1.1 μm, can be measured. The Schottky barrier ΦB between gold and n-type silicon shows 0.7–0.8 eV, and NIR light up to a wavelength of 1.5–1.7 μm can be detected.
2.2. Spectrum reconstruction and gas sensing
The spectral reconstruction procedure using the plasmonic photodetector is detailed in other literature,
29,30) so we briefly describe it here. The spectroscopy step consists of a two-stage process: (1) measuring the wavelength sensitivity characteristics of the photodetector and (2) reconstructing the spectrum of the incident light based on that composition data. First, the procedure starts with the calibration of the photodetector. Light with a known wavelength  and intensity
  is input into the photodetector, and while sweeping the incident angle θ, the photocurrent
  at each incident angle
  is measured [Fig. 1(c)]. At this time, the responsivity
  of the photodetector at a specific angle
  for the wavelength
 that is, the amount of generated photocurrent per unit incident light, can be expressed by the following formula.

As shown in Fig. 1(c), the responsivity is measured for each wavelength  within the wavelength range used for spectroscopy. This responsivity for each wavelength and incident angle forms an m × n matrix, which is used in the next step.
Spectrum reconstruction can be considered as the process of deriving the unknown light intensity vector  of the incident light from the photocurrent vector
  measured by changing the angle of the plasmonic photodetector relative to the incident light. When multiple wavelength-monochromatic lights are irradiated at the same time, the photocurrent
  at a certain incident angle
  can be expressed as the linear sum of the photocurrents of each monochromatic light (depicted in Fig. 1(d) as "Without gas"), and is expressed as:

Therefore, when photocurrents are measured at multiple incident angles  the following matrix equation holds:

Therefore, if the responsivity matrix is represented by R , it can be written in a simple form as I = RP . Here, the spectrum P of the incident light can be obtained from the generalized inverse matrix of the responsivity matrix R and the photocurrent vector I during the incident light irradiation using the following equation:

Thus, the unknown light intensity vector P is reconstructed from the pre-constructed responsivity matrix R and the measured data, the photocurrent vector I , enabling NIR spectroscopic measurement. When light passes through a gas, the transmittance decreases due to absorption by the gas, which slightly changes the vector I as shown in Fig. 1(d) "With gas." This allows the wavelength spectra for cases with and without gas to be obtained [Fig. 1(e)]. By dividing the intensity measured in the "With gas" condition by that of the "Without gas" condition at each wavelength, the gas transmittance spectrum can be measured [Fig. 1(f)], where the absorbance of the gas will appear as the transmission drop.
3. Fabrication and characterization of the photodetector
We fabricated a gold diffraction grating-type photodetector constructed on a bulk n-type silicon wafer. The fabrication process flow is shown in Fig. 2(a). First, we removed the natural oxide film layer by immersing an n-type silicon wafer (resistivity ρ = 1–10 Ω·cm, thickness 625 μm, both sides polished, 25.4 mm × 25.4 mm) in hydrofluoric acid. A diffraction grating pattern with a line and space ratio of 1:1 and a grating pitch (a = 3.2 μm) was formed on the wafer surface using a photoresist (OFPR-23cp, Tokyo Ohka, Japan). After that, Reactive Ion Etching (MUC-21, SPP, Japan) was performed, making 80 nm trenches on the silicon surface. After removal of the photoresist, the gold was deposited while tilting and rotating the wafer around the surface normally such that the sides of the grating were covered with gold. The deposition gold thickness was 110 nm. The area where the gold thin film was formed was 22 mm × 21 mm. The gold film also serves as an anode electrode during current measurement. To form a cathode electrode, an aluminum layer was deposited on the bottom surface opposite the gold grating. The cathode electrode of the fabricated photodetector and the electrode of the printed circuit board adhered with silver paste. The appearance of the fabricated photodetector is shown in Fig. 2(b). The surface roughness measurement by AFM (AFM5500M, Hitachi, Japan) confirmed that the grating was accurately formed [Fig. 2(c)]. To determine the Schottky barrier height, the current–voltage (I–V) characteristics were measured. The measurement was conducted inside a prober connected to a source meter (B1500A, Keysight, USA). It should be noted that a Schottky barrier is usually formed at the interface between n-Si and Al, which is a cathode metal, due to the difference in the work function. It was experimentally confirmed that n-Si and Al showed an ohmic junction for wafers of the dopant concentration used in this study. To confirm this point, we conducted I–V measurements with a setup where Al was deposited on both the front and back surfaces of the wafer [Fig. 2(d)]. Since the Al/n-Si interface exhibited resistive behavior, ohmic contacts could be formed without doping under the Al film at the concentration of this wafer. The measured I–V curve of the gold/n-Si interface is shown in Fig. 2(d). Using this data, the Schottky barrier height was calculated using Cheung's method, 31) resulting in ΦB = 0.76 eV. The corresponding cutoff wavelength λcutoff was calculated to be 1602 nm. This confirmed that NIR spectroscopy is possible with the fabricated plasmonic photodetector.

Fig. 2. (a) Fabrication processes of the plasmonic photodetector, (b) A photograph of the photodetector, (c) An AFM image of the grating surface, (d) I–V characteristics of the two Al/n-Si contact at the trans-substrate configuration, (e) I–V characteristics of the photodetector.
Download figure:
Standard image High-resolution image4. Gas sensing setup and basic spectroscopy performance
To verify the capability of the photodetector in detecting multiple types of gases, a gas measurement setup was constructed [Fig. 3(a)]. The spectroscopic performance of the fabricated device was evaluated before the gas measurement. A supercontinuum (SC) light source (SC450, Fianium, UK) was used as the light source. An Acousto-Optic Tunable Filter (AOTF NIR2, Fianium, UK) connected to the SC light source produced wavelength tunable single-wavelength lights. A long-pass filter that cuts wavelengths above 1100 nm was inserted to remove the visible light from the SC light completely. The light intensity that arrived at the photodetector surface was 20 μW nm−1 (per wavelength) at around the wavelength of 1300 nm. For gas detection, a gas cell with an optical path length of 10 cm (10 cm long gas cell with a KBr window, Shimadzu, Japan) was installed between the light source and the photodetector. In addition, the incident light was modulated by a chopper to improve the signal-to-noise ratio using a lock-in amplifier (LI5630, NF circuit, Japan). The modulated light entered the plasmonic photodetector placed on the rotation stage around the axis perpendicular to the plane of the paper. The grooves of the diffraction grating were set to be parallel to the rotation axis. The photocurrent was introduced to the pre-amplifier and, the converted output voltage was then input into the lock-in amplifier.
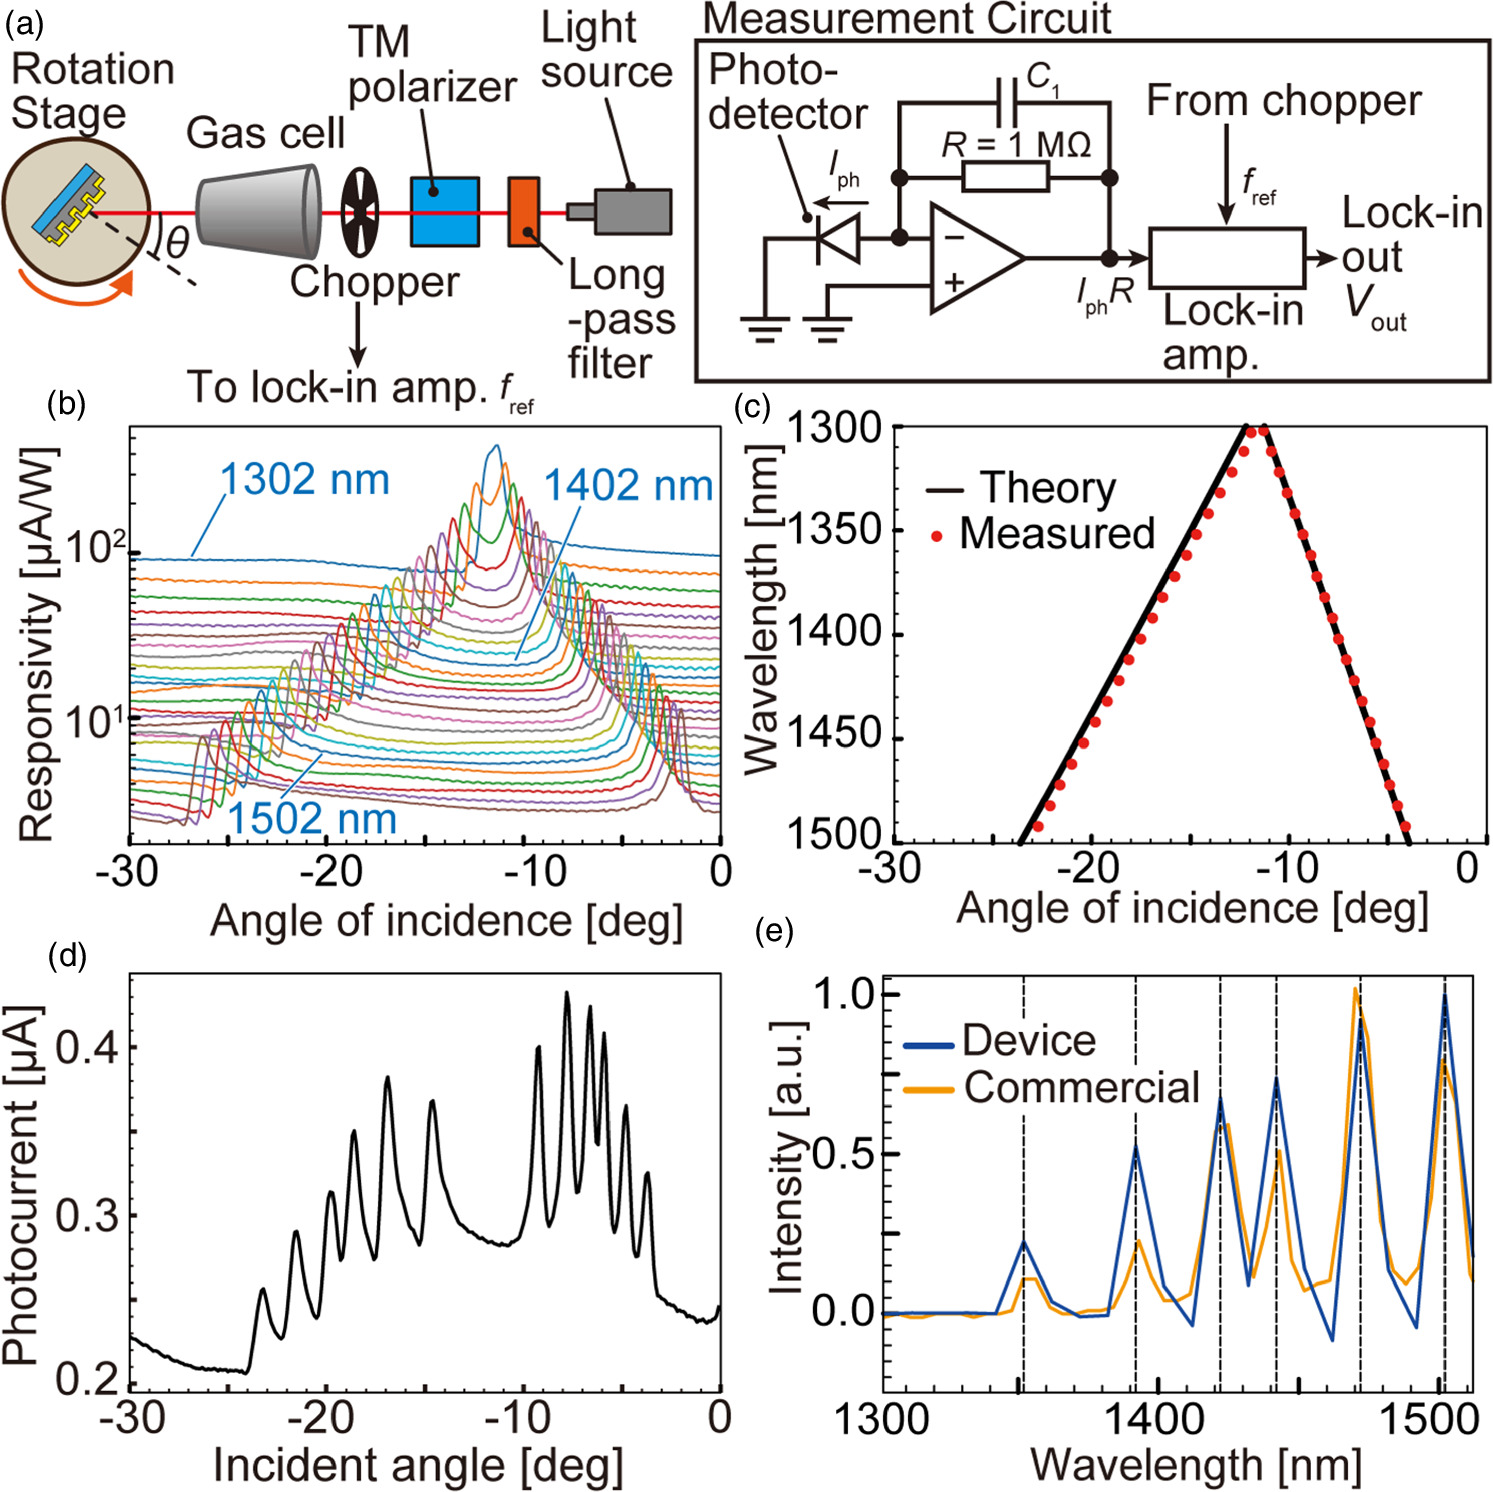
Fig. 3. The verification of the spectrum reconstruction performance, (a) an experimental setup and the detail of the measurement circuit, which were also used in the gas transmission measurement, (b) the responsivity spectrum for different wavelength monochromatic light incidence, (c) the comparison of the SPR peaks obtained from the experimental data and the theoretical calculations, (d) measured photocurrent data while six different wavelength monochromatic lights during the incident angle change, (e) the derived spectrum of the incident light with six different wavelength monochromatic light, compared with that obtained with the reference commercial spectrometer.
Download figure:
Standard image High-resolution imageFirst, NIR light was irradiated without enclosing gas in the gas cell, which was open to the atmosphere. To create a responsivity matrix R in this experimental configuration, single-wavelength light was irradiated on the photodetector in the range of 1302–1552 nm, with a wavelength interval of 10 nm. The photocurrent was measured by sweeping the incidence angle θ from −30° to 0° at a resolution of 0.1°. Separately, the intensity of each single wavelength was measured with a power meter so that the responsivities could be calculated by dividing the generated current by the intensity of the incident wavelength. The responsivities are shown in Fig. 3(b). A systematic responsivity spectrum was obtained in which the peak angle shifts according to the wavelength shift. To validate this data, Fig. 3(c) shows a graph comparing the peak angles of response for each incident wavelength and the theoretical surface plasmon resonance angles calculated from Eq. (1). In this case, the permittivity of gold is derived from a Ref. 32. Air was calculated with a permittivity of 1. As can be seen from the figure, the measured peak angles, and the theoretical angles of surface plasmon resonance match, indicating that the photodetector appropriately measures the surface plasmon resonance. However, there is a slight difference between the experiment and the calculation for the angle ranging from −24° to −8°. This difference can be attributed to the actual grating profile. Figure 3(b) constitutes the responsivity matrix.
To verify the spectroscopic capabilities, the responsivity matrix R was used to reconstruct the incident spectrum using the measured photocurrent when six single-wavelength lights (1352, 1392, 1422, 1442, 1472, and 1502 nm) were incident simultaneously. The obtained photocurrent signal I , and the reconstructed spectra P are shown in Figs. 3(d) and 3(e), respectively. For evaluation, the reconstructed spectrum was compared with measurement data with a commercial NIR spectrometer (Sol. 2.2A, B&W Tek, USA). While there is some variation in the peak heights, the two spectra show peaks at the same wavelengths, and there is a high agreement in the shape of the spectra. This result thus confirms that NIR spectroscopic measurements were possible with the proposed plasmonic photodetector. Moreover, while it is theoretically possible to reduce the wavelength step to less than 10 nm, the SC light source, even when emitting monochromatic light, has a FWHM of the wavelength distribution of about 7 nm. Therefore, setting the wavelength step to less than 10 nm for calibration does not improve measurement accuracy. To evaluate the continuous spectrum with finer wavelength steps, a light source with a very narrow linewidth and capable of sweeping wavelengths is required. The constraints of laser performance are the reason for the determination of the spectral wavelength step.
5. Gas measurement experiments
5.1. Gas measurement procedure
Using the setup in Fig. 3(a), we measured the transmission spectra of water vapor, two different concentrations of ethanol gas, and 10% NH3 gas. The absorption of light by gas is explained by the Beer–Lambert law. Suppose the intensity of the incident light is A0, the intensity of the transmitted light is A, and the optical path length of the gas cell is l. In that case, the molar absorptivity is ε, and the molar concentration of the gas is c, the following equation holds, A = A0 exp(−εcl). This allows for the measurement of changes in gas concentration through the intensity of transmitted light. During this measurement, gas was enclosed in the gas cell that had previously been opened to the atmosphere. However, to calculate the transmission rate of the gas, it is necessary to take a reference value with a gas that does not absorb NIR light. Therefore, we used nitrogen gas to measure the reference value. The light spectrum, when nitrogen gas at 1 atm is enclosed in the gas cell, is PReference, and the light spectrum, when the gas sample is introduced, is PSample. The transmission spectrum T of the gas sample at this time was calculated using the following formula.

First, nitrogen gas was enclosed in the gas cell, and six wavelengths (1352, 1392, 1422, 1442, 1472, and 1502 nm) were simultaneously incident on the plasmonic photodetector. In this study, we selected six wavelengths close to 1392 nm, where ethanol gas has an absorption peak. We obtained the light intensity P of the transmission spectrum by spectroscopy and used it as a reference.
5.2. Gas preparation
Then, water vapor, ethanol gas of different concentrations, and 10% NH3 gas were enclosed in the gas cell, and the light spectrum was obtained similarly. Water vapor was generated by putting pure water in the gas-collecting bottle and bubbling it with nitrogen. The experiment was conducted at a room temperature of 20 °C. Water vapor is assumed to be the saturated vapor at room temperature, which corresponds to 2% at room temperature of 20 °C. Ethanol gas was generated by putting anhydrous ethanol (99.5% ethanol, Wako, Japan) in a gas collecting bottle and bubbling it with nitrogen similarly. To generate ethanol gas of different concentrations, bubbling was performed with the same amount of pure water and anhydrous ethanol in the gas collecting bottle, or with only anhydrous ethanol in the gas collecting bottle. As a result of the measurement with a gas detection tube, we were able to obtain ethanol gas with concentrations of 2.7% and 4.5% measured with a gas detector tube [a gas detection tube: 112 (for ethanol) and gas sampling pump kit GV-100S, GASTEC, Japan)]. The NH3 gas stored in a gas cylinder of which concentration was adjusted to be 10% was employed. Each gas was filled into the gas cell. The gas generated was introduced into the gas cell with the inlet and outlet open for 5 min, and then the inlet and outlet were sealed to confine the gas inside the cell. The pressure was 1 atm at each measurement. To obtain the precise gas transmittance and absorbance, we also measured the same gas cell introduced into the Fourier transform IR spectroscopy (FTIR) (IRTracer-100, Shimadzu, Japan).
5.3. Gas measurement results
Figure 4(a) shows the transmission spectrum of N2 gas and the water vapor. Peaks can be seen at the six wavelengths irradiated. This transmission spectrum of N2 gas was used as a transmission rate of 100% at the corresponding wavelength in the following, so the transmission spectrum of N2 itself is not shown in the graph. The calculated transmission rate based on these results is shown in Fig. 4(b). Figure 4(b) also includes the FTIR measurement results for water vapor. The error bars of the photodetector's result indicated by "Device" correspond to maximum and minimum values, and the data point corresponds to the average value of the four experiments. In the case of water vapor, it can be seen that the transmission decreased by about 30% at all wavelengths compared to that of N2 gas. Also, no specific peak was observed within the measurement range. This characteristic observed with the plasmonic photodetector is consistent with the FTIR measurement result, in which a broad decrease in the transmission by about 30% was observed. Since there is consistency between the two, it can be concluded that the proposed spectroscopy method could measure the water vapor response.

Fig. 4. The gas sensing results, (a) Derived transmitted spectrum through the gas cell with either pure inert N2 gas or N2 gas including H2O vapor, (b) Transmittance spectra of the pure inert N2 gas or N2 gas including H2O vapor, which was measured by the proposing method, (c) Transmittance spectrum of the ethanol gas (4.5%) with the reference FTIR spectrum, (d) Transmittance spectrum of the ethanol gas (2.7%) with the reference FTIR spectrum, (e) The NH3 gas sensing results, comparison of data obtained with FTIR and those with the proposed device, denoted as proposed.
Download figure:
Standard image High-resolution image
Figures 4(c) and 4(d) show the ethanol gas measurement results with the plasmonic photodetector and the FTIR as a reference. The measurements were repeated four times, the data points represent the average of the four experiments, and the error bars indicate the maximum and minimum values. As shown in Fig. 4(c), in the case of 4.5% ethanol gas, a transmission dip was observed at λ = 1392 nm, which could be attributed to the ethanol gas light absorption. The transmission decreased by 6%–7% at λ = 1392 nm from the baseline. Comparing this measurement result with FTIR, absorption was observed at the same wavelength, and the amount of the transmission decreased and also presented consistency. When the concentration was changed to dilute 2.7% ethanol gas, a decrease in transmission was observed at the same wavelength λ = 1392 nm as the 4.5% ethanol gas. Because of the low gas concentration, the decrease in the transmission was 4%, which was also consistent with the transmittance drop in an FTIR plot from the baseline. This transmittance difference depending on the gas concentration suggests the plasmonic photodetector can be applied to quantitative measure of the gas concentrations.
Lastly, we conducted measurements on NH₃ gas. Figure 4(e) shows the transmission characteristics of NH₃ gas at a concentration of 10%. It should be noted that the data is preliminary and limited with measurements at only 3 wavelengths. The data from the FTIR is also presented for comparison. Measurements were taken 10 times by irradiating at wavelengths of 1494, 1514, and 1534 nm, and the room temperature at the time of measurement was 18 °C. The error bars indicate the maximum and minimum values. The spectrum shape is more complex than that of the ethanol gas due to many small absorption peaks, the FTIR showed a transmittance drop band around 1514 nm and was ∼3% from the baseline. In the case of the measurement with the plasmonic photodetector, the transmittance drop at the central wavelength compared with the other two wavelength transmittances was ∼2%–3%, which was also coherent with the FTIR analysis. Due to the limited measured wavelengths, a full spectrum evaluation remains a subject for future study.
Based on the above experiments, we have demonstrated the possibility of gas sensing with the plasmonic photodetector for gases that show a gentle absorption spectrum like water vapor, those that present an absorption dip near specific wavelengths like ethanol gas, and those like NH3 that exhibit absorption at longer NIR wavelengths. Although the range of gases measured is limited, we have shown that gas sensing using the proposed photodetector can be expanded to a variety of gases. However, at this point, there are challenges to improving the accuracy of the measurement method.
Firstly, there is a problem with the interpretation of the water vapor spectrum. Based on the data from the HITRAN database, for water vapor, an absorption peak should be observed in the 1350–1400 nm range, but a broad absorption trend was evident in this case. Regarding this, it seems reasonable to interpret that the spectrum obtained this time is due to the fusion of absorption by water vapor and the gentle absorption band around the longer wavelength of 1500 nm by condensed liquid water resulting from the saturated water vapor. Therefore, in this measurement, there is a possibility that the absorption of pure water vapor in the gas phase has not been accurately measured.
Moreover, compared to the absorption wavelength band of ethanol, that of NH3 is relatively situated on the longer wavelength side. As a result, the energy of the incoming photons is reduced, causing a decrease in the signal-to-noise ratio, which affects the accuracy of measurements. The current photodetectors have not been structurally optimized yet. By enhancing the structure of plasmonic photodetectors, for example, an appropriate choice of a Schottky and plasmonic metal, both the quantum efficiency and signal-to-noise ratio can be improved. This will enable more precise measurements of gases like NH3, which have absorption bands in the NIR region of longer wavelengths.
In addition, spectroscopy was conducted using a special light source capable of irradiating monochromatic light this time. It is also desirable to replace the light source with a more affordable and easily accessible broadband light source. However, to make use of such a light source, it is necessary to improve the sensitivity of the photodetector. This device exhibits limited sensitivity, which limits its application in spectrometry using white light as a light source. Nonetheless, progress has been made in spectrometry by employing commercially available halogen lamps as light sources, as reported in Ref. 33. The light source used in this case had a power density of 8 μW nm−1 at wavelengths around 1300 nm (SL S201L, Thorlabs, USA). In terms of sensitivity, we can improve the responsivity by reducing the Schottky barrier height and optimizing the structure. Although the microstructures are different, previous measurements by our group presented a sensitivity of 10 mA W−1 at a wavelength of 1500 nm using a Cu/n-Si Schottky barrier. 34) Therefore, while optimization of the device's structure is necessary, we anticipate a potential sensitivity improvement of two to three orders of magnitude in principle. This improvement can facilitate its application to the broadband light source.
6. Conclusion
In this study, we proposed a spectroscopic gas measurement using a plasmonic photodetector and applied the photodetector to several types of gases using a plasmonic photodetector. It was possible to measure the transmittance of the water vapor, the ethanol gas, and partially the NH3 gas. These results suggested that gas measurement targeting multiple types of gas is possible with a single architecture photodetector. Using the device from this study, compact spectroscopic gas sensing can be realized with only a gas cell, light source, and a small spectroscopic device. This sensor has the advantage of being reusable multiple times as it optically measures the gas without directly contacting it. On the other hand, the measurable gas concentration is estimated to remain at a few ppm levels with low resolution by noise analysis. 25) In the latest research, some methods measure ammonia or ozone in the atmosphere with high resolution at the ppb level using tunable lasers for spectroscopic gas measurement. 35,36) Bridging this resolution gap will be a requirement in the future. As can be seen from the results of the experimental section, in the NIR wavelength band, the absorption of ambient moisture is broadly spread and is not necessarily suitable for gas measurement. In addition, for gas spectroscopic measurements, shifting to longer wavelengths in the mid-IR range where gas absorption is strong is preferable. In our group, we have already modified the Schottky metal to PtSi in a similar configuration to the proposed plasmonic photodetector and extended the measurable wavelength to 3.4 μm. 37) Introducing this technology and the design optimization make it possible for the plasmonic photodetector to perform mid-IR spectroscopy where gases significantly absorb the light, which will be a key to bridging the resolution gap.
Acknowledgments
This work is partly supported by New Energy and Industrial Technology Development Organization (NEDO). The photolithography masks were made using the University of Tokyo Systems Design Lab (d.lab)'s 8-in. EB writer F5112 + VD01 donated by ADVANTEST Corporation. Microfabrication was performed in a clean room of the Division of Advanced Research Facilities (DARF) of the Coordinated Center for UEC Research Facilities of the University of Electro-Communications, Tokyo, Japan.