
Abstract
We report the effect of Sr substitution on the crystal growth and piezoelectric properties of calcium magnesium silicate Ca2MgSi2O7 (CMS) single crystals. Strontium-substituted CMS single crystals with a chemical composition of Ca1−xSrxMgSi2O7 (CSMS100x; x = 0.0 to 0.6) were grown using the conventional Czochralski method. CSMS100x crystals without impurity phases are obtained up to x = 0.5. Both crystallographic axis c and a increased with the Sr content x, and the crystallographic axis ratio a/c decreased. The piezoelectric d36 constants obtained using CMS, CSMS30, and CSMS40 crystals decreased with an increase in the Sr content x. Based on these observations, a relationship between piezoelectric properties and crystal structure was found using data from 14 types of melilite-type crystals. It was found that d36 increases with an increase in a/c.
Export citation and abstract BibTeX RIS
1. Introduction
Piezoelectric materials have attracted attention for medical, civil engineering, and information technology applications. 1) Piezoelectric materials can be broadly classified into polar and nonpolar piezoelectrics. For example, BaTiO3, Pb(Zr,Ti)O3, and (K,Na)NbO3 are polar piezoelectrics, and α-SiO2 (quartz) and langasite-family are non-polar piezoelectrics. Polar piezoelectric materials generally have a high dielectric constant and high piezoelectric constant dij; hence, they have been used in medical transducer and actuator devices. 2–6) On the other hand, nonpolar piezoelectric materials show a low dielectric constant and low dij, but have higher phase transition temperatures. Therefore, their possible applications include gas sensors, 7) microbalance, 8) and combustion pressure sensors, 9) which operate at temperatures higher than 300 °C. Promising candidates are langasite La3Ga5SiO14-type crystals, 10) rare-earth calcium oxoborate ReCa4O(BO3)3 (Re = Y, La–Lu) crystals, 11,12) gallium phosphate GaPO4, 8,13) and aluminum nitride AlN and its related nitride thick films, 14–17) which have been investigated vigorously. These crystals and thin films have one or more shortcomings in applications, as mentioned in Ref. 18.
In the last ten years, melilite-type crystals such as Ca2Al2SiO7 (CAS)
19) and CaYAl3O7 crystal
20) have been studied. The melilite-type crystals possess the tetragonal symmetry and belong to  space group. The crystal has two kinds of piezoelectric constants (d14 and d36) in shear mode. In compression mode with the piezoelectric d'31 constant used for pressure sensor applications, piezoelectric responses are obtained by using crystal substrates with both (XYt)θ° rotation cut for d14 and (ZXt)θ° rotation cut for d36.
21,22) The melilite-type single crystal exhibits both high resistivity and stable piezoelectric properties at high temperatures. For the CAS crystal, because d14 is higher than d36, the compressive strength of the (XYt)45° cut was measured in Ref. 18. However, the compressive strength of the (XYt)45° cut of the CAS crystal is 140 MPa, and this value is insufficient for practical applications. There is clear cleavage plane (001) normal to the crystallographic c-axis in the melilite-type crystals. Because the shear stress direction on the (XYt)45° cut is in c-plane (001), this cause a low mechanical strength. Therefore, another piezoelectric d'31 constant, originating from d36 on the (ZXt)45° cut is attractive because the compressive strength of the (ZXt)45° cut is greater than 800 MPa.
23) Among melilite-type crystals, calcium magnesium silicate Ca2MgSi2O7 (CMS), known as the mineral akermanite, shows a d36 value of more than 4 pC/N
24,25); hence, d'31 should be comparable to d11 (2.20 pC/N
26)) of quartz crystals. CMS crystals are grown from a melt with stoichiometric composition using the conventional Czochralski (Cz) method.
25,27) Because CMS shows a commensurate-incommensurate phase transition occurring at approximately 85 °C,
28) strontium substitution into CMS was successfully applied. Although the phase transition temperature decreases to less than −50 °C,
23) the effect of Sr substitution on the crystal structure and electrical properties remains unknown. A previous report
29) demonstrated that a Sr-substituted CMS (Ca1−x
Srx
MgSi2O7: CSMS100x) single crystal with x up to 0.64 was obtained. However, the details of the crystal growth have not been reported. Another report
23) showed that colorless and transparent CSMS100x single crystals for x = 0.3 were grown by the Cz method. Therefore, there have been no reports on the growth of CSMS100x single crystals for 0.3 < x < 0.64, and their electrical properties are unknown.
space group. The crystal has two kinds of piezoelectric constants (d14 and d36) in shear mode. In compression mode with the piezoelectric d'31 constant used for pressure sensor applications, piezoelectric responses are obtained by using crystal substrates with both (XYt)θ° rotation cut for d14 and (ZXt)θ° rotation cut for d36.
21,22) The melilite-type single crystal exhibits both high resistivity and stable piezoelectric properties at high temperatures. For the CAS crystal, because d14 is higher than d36, the compressive strength of the (XYt)45° cut was measured in Ref. 18. However, the compressive strength of the (XYt)45° cut of the CAS crystal is 140 MPa, and this value is insufficient for practical applications. There is clear cleavage plane (001) normal to the crystallographic c-axis in the melilite-type crystals. Because the shear stress direction on the (XYt)45° cut is in c-plane (001), this cause a low mechanical strength. Therefore, another piezoelectric d'31 constant, originating from d36 on the (ZXt)45° cut is attractive because the compressive strength of the (ZXt)45° cut is greater than 800 MPa.
23) Among melilite-type crystals, calcium magnesium silicate Ca2MgSi2O7 (CMS), known as the mineral akermanite, shows a d36 value of more than 4 pC/N
24,25); hence, d'31 should be comparable to d11 (2.20 pC/N
26)) of quartz crystals. CMS crystals are grown from a melt with stoichiometric composition using the conventional Czochralski (Cz) method.
25,27) Because CMS shows a commensurate-incommensurate phase transition occurring at approximately 85 °C,
28) strontium substitution into CMS was successfully applied. Although the phase transition temperature decreases to less than −50 °C,
23) the effect of Sr substitution on the crystal structure and electrical properties remains unknown. A previous report
29) demonstrated that a Sr-substituted CMS (Ca1−x
Srx
MgSi2O7: CSMS100x) single crystal with x up to 0.64 was obtained. However, the details of the crystal growth have not been reported. Another report
23) showed that colorless and transparent CSMS100x single crystals for x = 0.3 were grown by the Cz method. Therefore, there have been no reports on the growth of CSMS100x single crystals for 0.3 < x < 0.64, and their electrical properties are unknown.
In this study, the effect of Sr substitution on the growth, structural, and electrical properties of CMS piezoelectric single crystals was investigated. In addition, the relationship between the crystal structure and the piezoelectric properties of melilite-type crystals was demonstrated.
2. Experimental procedure
Crystal growth of CMS and CSMS100x was conducted using the RF-heating Cz method. As starting materials, powders of CaCO3, SrCO3, MgO, and SiO2 with 99.99% purity were used. We prepared these powders with stoichiometric amounts corresponding to CMS and CSMS100x. In this study, the chemical composition of CSMS100x with x = 0.3–0.6 was selected based on previous studies. 23,29) The powders were then mixed in ethanol, dried, and calcined at 1350 °C for 5 h in air. Powder X-ray diffraction (XRD) was conducted to determine the phases of the calcined powders. The calcined powder was compacted to became pellet. The pellets were charged in a platinum crucible (diameter and height: 50 mm). The growth atmosphere consisted of argon gas flow and oxygen gas flow at rates of 5 × 10⁻⁴ and 5 × 10⁻⁶ m3 min−1, respectively. These gases were mixed in the furnace. By using a CSMS10 single crystal reported in Ref. 23, rectangular bars with dimensions of 3 mm × 3 mm × 30 mm were fabricated and used as the seeds. The rotation rate and pulling rate were 10 rpm and 1.0 mm h−1, respectively.
Phase identification and the chemical composition analysis of the as-grown crystals was performed using powder XRD analysis and an electron probe microanalyzer (EPMA), respectively. Density of the as-grown crystals was calculated using the lattice parameter determined by the powder XRD analysis. The crystals were cut from the grown boules and were crushed to size of less than 100 μm. These crystals were used on single-crystal XRD analysis. Using a Rigaku automated four-circle diffractometer, we collected the diffraction intensities at RT. Using the Rigaku program, the intensities were corrected for the absorption, polarization, and Lorentz factors. We refined the crystal structure using the full-matrix least-squares program SHELXL97.
30) The electro-acoustical constants (dielectric, piezoelectric, and elastic compliance constants) of single crystals made of CMS, CSMS30, and CSMS40 were determined using an NF LCR meter ZM2376. We fabricated equivalent (ZXt)45° cut plate resonators with dimensions 12 mm × 3 mm × 0.8 mm. In this study, the piezoelectric constant  expressed by the equation
  using the piezoelectric constant d36 and rotation angle θ of the substrate was focused and evaluated by measuring the resonant and anti-resonant frequencies of the resonators in length-extensional mode.
3. Results and discussion
We have grown the CSMS100x crystals with x = 0.0 (CMS) and x = 0.3 – 0.6 (CSMS30, CSMS40, CSMS50 and CSMS60) by the Czochralski method. The solidification fraction g = Wcrystal/Winitial, where Wcrystal and Winitial are the weights of the grown crystal and starting melt, respectively, was calculated to be approximately 0.30 for all grown crystals. The as-grown CMS, CSMS40, and CSMS60 crystals are shown in Fig. 1. The CMS and CSMS30 crystals were transparent and colorless. Moreover, these crystals had smooth surfaces and no inclusions. The CSMS40 crystal was transparent and colorless but had many bubbles from the middle to the end of the crystal boule, as shown in Fig. 1(b). The CSMS50 crystal was also transparent but had numerous bubbles throughout the crystal. On the other hand, the CSMS60 crystal shown in Fig. 1(c) was composed of a mixture of transparent and opaque parts. From these results, CMS, CSMS30, and CSMS40 crystals were selected to determine electro-acoustical constants.

Fig. 1. Photographs of side view of CSMS100x crystals with (a) x = 0.0 (CMS), (b) x = 0.4 (CSMS40), (c) x = 0.6 (CSMS60) grown by the Czochralski method in Ar + 1 vol% O2 flow atmosphere.
Download figure:
Standard image High-resolution imageFigure 2 shows the XRD profiles of the CSMS100x powders obtained by pulverizing the crystal samples. From CMS to CSMS50, all peaks in the powder XRD patterns of the boules were identified to be those of akermanite Ca2MgSi2O7 phase without any impurity phases. With increasing Sr-content x, all peaks were gradually shifted toward to lower diffraction angles. This result is reasonable from the viewpoint of the ionic size [Ca2+ (rVIII = 1.12 Å) and Sr2+ (1.26 Å)] 31) and suggested that the Sr2+ cation was introduced into the Ca2+ site. In the CSMS60, akermanite and mervinite Ca3MgSi2O8 phases were observed.

Fig. 2. Powder XRD patterns observed using pulverized powders of CSMS100x crystals grown using the Czochralski method.
Download figure:
Standard image High-resolution imageFigure 3 shows photographs and scanning electron microscope (SEM) image of the cross-section of the upper part of the CSMS60 crystal. As mentioned above, the CSMS60 crystal is composed of a mixture of transparent and opaque parts. Comparing Figs. 3(c) and 3(d), the transparent and opaque parts are named areas A and B, respectively. The chemical compositions of areas A and B determined by EPMA were (Ca+Sr):Mg:Si ratios 2.11:1.01:2 and 3.33:1.02:2, respectively. This result indicates that the opaque parts (area B) are Sr-substituted mervinite Ca3MgSi2O8 phase. Therefore, it was found that the solubility limit of Sr in CMS is x = 0.5, under the growth conditions set in this study. This observation is consistent with that reported in Ref. 29 and phase diagram of the Ca2MgSi2O7–Sr2MgSi2O7 binary system. 32)

Fig. 3. Photographs of (a) side view, (b) cross-section view, (c) magnified view of the CSMS60 crystal, and (d) SEM image. Areas A and B correspond to melilite and mervinite phases, respectively.
Download figure:
Standard image High-resolution imageThe lattice parameters a and c of the CSMS100x crystals were determined using 2θdif values of the corresponding diffraction peaks shown in Fig. 2. Figure 4 shows Sr-content x in CSMS100x crystals versus lattice parameter a, c and crystallographic a/c ratio. Both the a and c values increased with the Sr content x, but the crystallographic a/c ratio decreased with increasing x. This result indicates that the CSMS100x crystal lattice is enlarged anisotropically by introducing Sr2+ cations into the Ca2+ site; that is, the c-axis expands more easily than the a-axis.

Fig. 4. Influence of Sr content x in CSMS100x crystals on lattice parameters a and c and crystallographic a/c ratio.
Download figure:
Standard image High-resolution imageFigure 5 shows the frequency dependences of impedance |Z| and phase θp measured in k31 mode for the CSMS40 crystals at RT. The phase value θp was found to be on the order of 88.7° and no spurious mode of vibration was shown. Electromechanical coupling factor k'
31 and piezoelectric constant  were evaluated by measuring the mechanical series resonance frequency fs and parallel resonance frequency fp of resonators. The electro-acoustic properties of the CSMS100x crystals are listed in Table I.
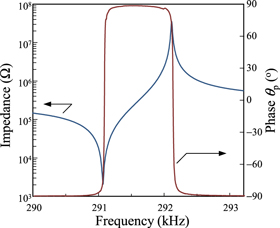
Fig. 5. Typical resonance and anti-resonance frequencies characteristics of impedance and phase on k31 mode for CSMS40 single crystal at RT.
Download figure:
Standard image High-resolution imageTable I. Electro-acoustic properties of CSMS100x crystals.
| ε33 Τ /ε0 | s33 E ' | d36 | k'31 | |
|---|---|---|---|---|
| CMS | 8.16 | 6.75 | 5.71 | 0.13 |
| CSMS30 | 7.78 | 6.67 | 4.30 | 0.10 |
| CSMS40 | 7.86 | 6.74 | 4.04 | 0.09 |
εT 33/ε0: Relative dielectric constant (−), d36: Piezoelectric constant (pC/N), sE' 33: Elastic compliance constant (×1012 m2 N−1), k'31: Electromechanical coupling factor (−).
The influence of the Sr content x in CSMS100x crystals on the piezoelectric constant d36 is shown in Fig. 6. The d36 value decreased with increasing Sr content, x. The relationship between the piezoelectric constants (d14,
d36) and the polyhedral distortion Δ for the 8-coordinated site of melilite-type crystals was reported in our previous report.
23) Δ is defined as  where N is the coordination number, Ri
is the individual bond length, and
where N is the coordination number, Ri
is the individual bond length, and  is the average bond length.
33) In the reports,
23) the piezoelectric constant d14 increases with Δ, on the other hand, d36 slightly decreases. By single-crystal structure analysis, the Δ values for the 8-coordinated site of the CMS and CSMS30 crystals were determined to be 2.7 × 10⁻³ and 2.3 × 10⁻³, respectively. This means that the Δ value decreases with increasing Sr content x. Hence, in the CSMS100x crystals, d36 increases with increasing the Δ value. This result is inconsistent with the trend reported in Ref. 23, another relationship must be determined.
is the average bond length.
33) In the reports,
23) the piezoelectric constant d14 increases with Δ, on the other hand, d36 slightly decreases. By single-crystal structure analysis, the Δ values for the 8-coordinated site of the CMS and CSMS30 crystals were determined to be 2.7 × 10⁻³ and 2.3 × 10⁻³, respectively. This means that the Δ value decreases with increasing Sr content x. Hence, in the CSMS100x crystals, d36 increases with increasing the Δ value. This result is inconsistent with the trend reported in Ref. 23, another relationship must be determined.

Fig. 6. Influence of Sr content x in CSMS100x crystals on piezoelectric constant d36.
Download figure:
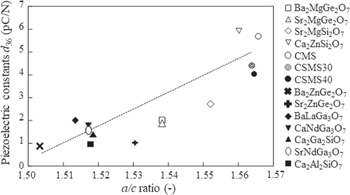
Standard image High-resolution imageFigure 7 shows the dependence of d36 on the crystallographic a/c ratio in the melilite-type crystals. The d36 and the crystallographic a/c ratio data were obtained from the references (Ba2MgGe2O7,
24) Sr2MgGe2O7,
24) Sr2MgSi2O7,
24) Ca2ZnSi2O7,
24) Ba2ZnGe2O7,
24) Sr2ZnGe2O7,
24) BaLaGa3O7,
34) CaNdGa3O7,
34) Ca2MgSi2O7,
25) Ca2Ga2SiO7,
25) SrNdGa3O7,
34) Ca2Al2SiO7
35)). From the figure, an increase in the crystallographic a/c ratio, that is, high tetragonality, leads to an increase in the piezoelectric constant d36. This tendency can be explained as follows: an increase in the crystallographic a/c ratio implies that the a-axis is more easily enlarged than the c-axis. The  (
( ) value of melilite-type crystals with tetragonal symmetry indicates the magnitude of the electric charge along the c-axis developed by the applied stress normal to the c-axis, that is, along direction rotated by θ from the a-axis. By increasing the a/c ratio, the cations can move more easily in the c-plane consisting of the a-axis of the crystal. This explanation is not universal because a positive correlation between d14 and Δ in the melilite-type crystals is still observed, as reported in Ref. 23. These tendencies will provide a hint on how to improve piezoelectric properties of melilite-type crystals.
Fig. 7. Piezoelectric constant d36 versus crystallographic a/c ratio of melilite-type crystals.
Download figure:
Standard image High-resolution image
4. Conclusions
The crystal growth of CMS and Sr-substituted CMS (CSMS100x) was conducted using the Cz method. In this study, the CSMS100x crystals without impurity phases and bubbles were grown up to x = 0.5 (CSMS50) and x = 0.4 (CSMS40), respectively. Powder XRD measurements clarified that both crystallographic axis c and a increased with Sr content x, and the crystallographic axis ratio a/c decreased. Single-crystal structure analysis showed that the polyhedral distortion of the Ca2+ site was relaxed by Sr substitution. The piezoelectric d36 constants were obtained using CMS, CSMS30, and CSMS40 crystals. It was found that the piezoelectric constant d36 decreased with increasing Sr content. We found that the independent piezoelectric constant, d36, in the melilite-type crystal increased with an increase in a/c.
Acknowledgments
Part of this study was financially supported by JSPS KAKENHIs 20H05879 and 22H02162.