
Abstract
We clarified the design guides for H2- and CO-producing artificial photosynthetic devices. The combination of a voltage-matched (VM) tandem solar-cell (SC) module and an electrochemical (EC) module was adopted. The parallel-connected top and bottom SC modules, in which multiple organic–inorganic hybrid perovskite (PVK) SCs with a bandgap of 1.7 eV and crystalline-silicon SCs were connected in series, respectively, powered the EC module consisting of series-connected multiple EC reactors. It was found that the design parameters of the series connection numbers must be optimized under slightly greater solar intensity and higher temperature than the average values to minimize the mismatch between the device operating voltage and SC maximal power voltage. This is in contrast to that the annual electricity production of the VM SC module coupled with a power conditioner is not sensitive to the optimization conditions. Increases in the bandgaps of the PVK SCs do not affect the annual production significantly.
Export citation and abstract BibTeX RIS
1. Introduction
Efficient utilization of solar energy is obviously important for carbon neutrality. However, solar photovoltaic power generation currently only accounts for a small part of total electricity production, although crystalline silicon solar cells (Si SCs) are widespread. Therefore, improvements in the solar-to-electricity energy conversion efficiency (ηSC) of SCs are strongly desired. 1) In addition, artificial photosynthesis that converts H2O to H2 and CO2 to CO, HCOOH (formic acid), etc. is another means to utilize and store solar energy, as well as to produce alternative fuels and reduce net CO2 emissions. Therefore, artificial photosynthetic devices consisting of SCs and electrochemical (EC) reactors, which are of the topic of the present study, have been extensively studied. 2–4)
We have tackled the problem to achieve both high efficiency and a practically large size for artificial photosynthetic devices, designing a device consisting of a Si SC module and an EC reactor equipped with 1 m2-sized electrode catalysts to produce formate, and realized a high solar-to-chemical energy conversion efficiency (ηSTC) of 10.5%. 5,6) Furthermore, an improvement in the durability of the catalysts 7) and direct conversion of dilute CO2 in a flue gas 8) are proceeding. On the other hand, an improvement in the ηSC of the SCs used in the device will directly lead to a higher ηSTC, in addition to the development of more active electrode catalysts.
The steadiest way for an improvement in ηSC is a tandem configuration, 9,10) in which two or more materials with different bandgaps (Eg) share the light-absorption function. This reduces the energy dissipation caused by carrier thermalization because the light-absorption spectrum of each material narrows. Tandem SCs using group III-V compound semiconductors have been developed and commercialized for concentration photovoltaics and space use. 11) However, the high cost of these group III-V tandem SCs is an obstacle to non-concentration applications and consumer use.
On the other hand, the development of organic–inorganic hybrid perovskite (PVK) SCs has advanced significantly, resulting in high ηSC values close to those of Si SCs, as well as improvements in the durability. 12–14) The tunability of Eg by their compositions is one of the great advantages of PVK SCs in addition to potentially low costs. High photovoltaic performance has been realized in an Eg range of 1.2–1.7 eV, 15,16) although an Eg of around 1.5 eV has achieved the highest ηSC. 17,18) As shown later (see Fig. 13), Eg = 1.7 eV is close to the optimal value for tandem SCs combined with Si SCs. Therefore, tandem PVK/Si SCs 19–21) and their application to artificial photosynthetic devices 22–24) has been studied for the purpose of both high ηSTC and low cost. The next target should be triple-tandem SCs using two PVKs with different Eg values. 25–27) However, higher ηSC or ηSTC than those for the double-tandem SCs has not yet been realized, because the performance of the PVK SCs at Eg > 1.7 eV is not sufficiently high. Therefore, in the present study, we seek the means to improve ηSC and ηSTC using the double-tandem PVK (Eg = 1.7 eV)/Si configurations.
We have previously revealed that the voltage-matched (VM) tandem SC modules consisting of parallel-connected PVK top modules and Si bottom modules, in which multiple PVK and Si SCs are connected in series, respectively, yield high ηSC. 28) In addition, artificial photosynthetic devices using EC modules, which consist of multiple series-connected EC reactors, powered by VM tandem SC modules yield a higher ηSTC. Thus, the objective of the present study is to clarify the design guides for artificial photosynthetic devices consisting of VM SC modules and EC modules to achieve higher ηSTC throughout the year, by investigating the impacts of the solar intensity and SC temperature in detail. In particular, the differences in the effects of these external operating conditions on the performance of the SCs and the SC-EC combinations are elucidated.
2. Basic design of VM tandem SC modules and artificial synthetic devices using these SC modules
Figure 1 illustrates two kinds of PVK/Si tandem SC modules and artificial synthetic devices using these SC modules. When an SC module is coupled with a power conditioner, ηSC is the ratio of the maximal value of the output power density that is equal to the product of the current density and voltage to the solar intensity. The two-terminal (2T) SC module using the PVK/Si double-junction SCs displayed in Fig. 1(a) requires current matching between the PVK and Si SCs for a high ηSC. This determines the optimal Eg of the PVK SC. However, the current matching breaks when the solar spectrum changes, even though it holds for the spectrum used for Eg-optimization. Hence, the 2T SC module suffers from solar spectrum variation.
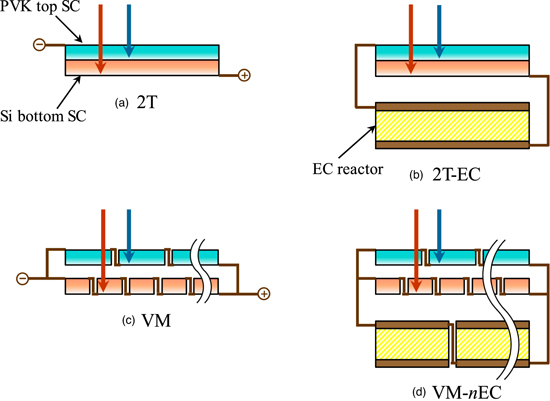
Fig. 1. (a) and (c) Organic–inorganic hybrid PVK/Si tandem SC modules. (b) and (d) Artificial photosynthetic devices consisting of the SC modules and EC modules.
Download figure:
Standard image High-resolution imageThe intersection of the current density−voltage (J–V) curve of the SC module and the load curve of the EC module determines the operating point (current density Jop and voltage Vop) of the artificial photosynthetic device. Because the reaction rate increases in proportion to Jop, ηSTC is proportional to Jop at a given solar intensity. Therefore, the requisite for a high ηSTC is that J at V = Vop is maximized. This, in turn, requires that the voltage at the maximal power point (VMPP) of the SC module is close to Vop. The load curves of the H2- and CO-producing EC reactors start to increase from 1.4–1.6 V which are higher than the thermodynamic threshold voltages (1.23 V for H2 production from H2O, and 1.34 V for CO production from CO2) by the overvoltages required for promoting the reactions. Therefore, Vop is slightly higher than 1.4–1.6 V (1.5–1.7 V in reality; see Figs. 9 and 12). However, the Eg of the PVK SC used in the 2T SC module is determined from the current matching condition, as stated above. Hence, Vop of the artificial photosynthetic 2T-EC device using the 2T SC module shown in Fig. 1(b) does not coincide with VMPP of the SC module in general, resulting in a low ηSTC.
The VM tandem SC module illustrated in Fig. 1(c) solves these problems with the 2T SC module and an artificial photosynthetic 2T-EC device. 28–32) In the VM module, multiple PVK SCs and Si SCs constitute the top and bottom modules, respectively, which are connected in parallel. Semi-transparent PVK SCs used in this configuration have been developed to be used for four-terminal (4T) tandem SCs and see-through SCs. 33,34) The numbers of the series-connected PVK and Si SCs in the top and bottom modules, respectively, are tuned so that the VMPP values of these two modules are approximately the same as each other. Parallel connection of the top and bottom modules eliminates the current matching problem, leading to high robustness against solar spectrum variation. Instead, voltage matching is a unique requisite to the VM configuration for a high ηSC. More intense solar illumination increases VMPP, whereas a higher temperature decreases VMPP. These changes would break the voltage matching and consequently lower ηSC because the effects of the solar intensity and temperature on the PVK SCs and Si SCs are different from each other.
The artificial photosynthetic device with a VM-nEC configuration is displayed in Fig. 1(d), in which the VM tandem SC module powers the EC module. By tuning the series-connected SC numbers in the VM module and the number of EC reactors that are connected in series in the EC module, the VMPP of the VM module per a single EC reactor is suitably set under a given condition. However, variations in the solar intensity and temperature affect the VM-nEC devices more detrimentally, as discussed below, than the VM SC modules coupled with power conditioners described above.
Figure 2 shows the J–V curves of an SC module with the load curve of an EC reactor. Under the condition used for optimization (tuning the series connection numbers for the VM-nEC device), VMPP of the J–V curve of the solid line coincides with Vop, and hence Jop is close to the photocurrent density (Jph). When the solar illumination becomes more intense, Jph increases proportionally to the solar intensity, whereas VMPP shifts higher only slightly [the broken line in Fig. 2(a)]. Therefore, Vop becomes larger than VMPP and Jop smaller than Jph, resulting in a notable lowering in ηSTC that is proportional to Jop. On the other hand, under weaker solar illumination, ηSTC scarcely changes because Jop ≅ Jph holds [the dashed–dotted line in Fig. 2(a)]. However, Vop becomes smaller than VMPP, in other words, the voltage loss increases because too many PVK and Si SCs are connected in series for this weaker solar illumination.

Fig. 2. Dependences on (a) the solar intensity and (b) the temperature of the current density–voltage (J–V) curve of an SC module. The open square indicates the maximal power point for each condition. The load curve of an EC module is also plotted. The intersection of the two curves determines the operating point (Jop and Vop).
Download figure:
Standard image High-resolution imageWhen the temperature rises, VMPP decreases whereas Jph does not change [the broken line in Fig. 2(b)]. Hence, Vop exceeds VMPP, Jop decreases far below Jph, and consequently ηSTC notably lowers. A lower temperature also detrimentally affects ηSTC because of a significant voltage loss [the dashed–dotted line in Fig. 2(b)].
The lowering in ηSTC arising from the mismatch between Vop and VMPP is unique to the present artificial photosynthetic devices, and is in contrast to that the power conditioner adjusts the load so that the SC module always operates at VMPP. Therefore, the design guide should be clarified to mitigate these detriments.
A 4T tandem SC module in which the output powers of the top and bottom modules are extracted separately eliminates both the current matching and voltage matching problems. However, it has the drawback that a dual power converter or EC module must be connected because of the two different output voltages. Nevertheless, ηSC and ηSTC using the 4T SC modules are virtually the same as those of the optimally designed VM SC modules (a single output with two terminals) and VM-nEC devices. 28,29,31,32) Therefore, the detailed evaluation on the 4T modules are described in Appendix A and excluded from the main considerations.
3. Modeling of photovoltaic processes and formulation of energy conversion efficiency
The objective of the present study is to clarify the design guide for VM-nEC artificial photosynthetic devices using PVK and Si SCs to minimize the detrimental impacts of varying solar intensity and temperature and to achieve high annual production. For this purpose, we modeled the J–V characteristics of the VM tandem SC modules. Then, we calculated ηSTC for two kinds of artificial photosynthetic devices: H2 production from H2O and CO production from CO2, and systematically investigated the impacts of the external operating conditions. Prior to consideration of these devices, ηSC values of the VM SC modules were also evaluated for clarifying the difference between the VM modules coupled with power conditioners and those combined with the EC modules. To capture the general trends rather than to precisely evaluate ηSC for a specific case, we constructed the following simplified models that describe the essence of the VM configuration.
3.1. Solar-to-electricity energy conversion efficiency of tandem SC modules (ηSC)
The current density of a single-junction SC (j(SC)) is described by the following formulation derived from an equivalent circuit model consisting of a constant current source, a diode, and a series resistance, 28,35,36)

where jph, j0, and rs are the current density, reverse saturation current density of the diode, and series resistance, respectively, and q, kB, and Tcell denote the elementary charge, Boltzmann constant, and cell temperature, respectively. The external quantum efficiency (ηEQE) of the photovoltaic conversion can be approximated to be a constant independent of the photon energies, and then jph is determined from the bandgap (Eg) of the light-absorbing material used in the SC and the spectral photon flux of solar illumination (![${n}_{\mathrm{sun}}\left[\hslash \omega \right]$](https://content.cld.iop.org/journals/1347-4065/62/SK/SK1018/revision3/jjapacc3a5ieqn1.gif) ),
),

For the Si bottom SC, the upper bound of the integration range in Eq. (2) is Eg of the top PVK SC ( ). This means no overlap between the PVK and Si absorption ranges, and hence will lead to slight overestimations of ηSC and the impact of spectrum variation on ηSC. The component originating from the radiative recombination involved in the recombination current density in Eq. (1) is determined by the generalized Plank law.
37) In addition, the external radiative efficiency (ηERE) is introduced for the expression of the nonradiative component.
36,38) Thus, by replacing the Fermi–Dirac distribution function with the Boltzmann distribution function,
). This means no overlap between the PVK and Si absorption ranges, and hence will lead to slight overestimations of ηSC and the impact of spectrum variation on ηSC. The component originating from the radiative recombination involved in the recombination current density in Eq. (1) is determined by the generalized Plank law.
37) In addition, the external radiative efficiency (ηERE) is introduced for the expression of the nonradiative component.
36,38) Thus, by replacing the Fermi–Dirac distribution function with the Boltzmann distribution function,

is derived, with h and c being the Plank constant and light velocity in vacuum, respectively.
The VM tandem SC module consists of the parallel-connected top module and bottom module, in which nPVK PVK SCs and nSi Si SCs are connected in series, respectively. The J–V relation per a single PVK SC is derived as follows,

It should be noted that the ohmic losses in the transparent electrodes and connecting wires and the photon losses arising from reflection and parasitic absorption that do not contribute to photovoltaic conversion are neglected.
The J–V characteristics of the 2T tandem SC module are obtained by solving the simultaneous equation,

When the SC module is coupled with a power conditioner, ηSC is the ratio of the maximal value of the output power density that is equal to the product of J and V as a function of V to the solar intensity (Psun),

For numerical evaluations, ηEQE, ηERE, and rs for the PVK and Si SCs were determined so that the photovoltaic properties calculated using Eq. (1) are approximately the same as the values of the world-record SCs measured under the standard condition for SC evaluation of the AM 1.5 G illumination (Psun = 100 mW cm−2)
39) and Tcell = 25 °C: ηEQE = 0.90, ηERE = 0.15, and rs = 3.1 Ω cm2 for the PVK SC ( = 1.51 eV); and ηEQE = 0.96, ηERE = 0.0062, and rs = 0.28 Ω cm2 for the heterojunction (HJ) Si SC. These parameter sets reproduce the experimental results well, as summarized in Table I.
17,40) Although more complicated equivalent circuits including the diode ideal factor and two diodes have been proposed for more precise fitting,
41,42) Eq. (1) well describes the J–V characteristics of a highly efficient SC at around its maximal power point, which fits the objective of the present study. For the PVK SCs with different
= 1.51 eV); and ηEQE = 0.96, ηERE = 0.0062, and rs = 0.28 Ω cm2 for the heterojunction (HJ) Si SC. These parameter sets reproduce the experimental results well, as summarized in Table I.
17,40) Although more complicated equivalent circuits including the diode ideal factor and two diodes have been proposed for more precise fitting,
41,42) Eq. (1) well describes the J–V characteristics of a highly efficient SC at around its maximal power point, which fits the objective of the present study. For the PVK SCs with different  values, the same parameter set was used neglecting the
  -dependence. This approximation leads to a higher ηSC than those previously demonstrated at a wider
  For example, ηSC = 23.8% at
  = 1.7 eV is higher than the record efficiency of 22% using metal electrodes
43) and 20% of semi-transparent SCs with
= 1.7 eV is higher than the record efficiency of 22% using metal electrodes
43) and 20% of semi-transparent SCs with  = 1.6 eV,
34,44) and therefore would be a target value.
= 1.6 eV,
34,44) and therefore would be a target value.
Table I. Comparison between the calculated (calc.) values and experimental (expt.) results of the short-circuit current density (jSC), open-circuit voltage (vOC), filling factor (ff), and energy conversion efficiency (ηSC) of the PVK and heterojunction Si SCs.
| jSC (mA/cm2) | vOC (V) | ff | ηSC (%) | ||
| PVK | Calc. | 25.8 | 1.189 | 0.833 | 25.5 |
| (Eg = 1.51 eV) | Expt. a) | 25.7 | 1.189 | 0.832 | 25.5 |
| Heterojunction Si | Calc. | 42.1 | 0.744 | 0.838 | 26.2 |
| (Eg = 1.12 eV) | Expt. b) | 41.8 | 0.744 | 0.838 | 26.3 |
When an SC operates outdoors, Tcell changes. A higher Tcell narrows Eg and hence increases jph. However, the detriments of a smaller open-circuit voltage and a lower filling factor arising from more significant radiative and nonradiative recombination surpass the benefit of the larger jph. Consequently, ηSC lowers. Thus, the dependences of ηSC and ηSTC on Tcell are essential for evaluation of annual production.
31,45,46) Therefore, the explicit Tcell dependence and Tcell-dependent Eg ( = 0.31 meV K–1 for PVK
47) and −0.27 meV K–1 for Si
48)) in Eqs. (1)−(3) are involved, whereas ηEQE, ηERE, and rs are approximated to be constant independent of Tcell. The resultant Tcell-dependences of ηSC, i.e.
= 0.31 meV K–1 for PVK
47) and −0.27 meV K–1 for Si
48)) in Eqs. (1)−(3) are involved, whereas ηEQE, ηERE, and rs are approximated to be constant independent of Tcell. The resultant Tcell-dependences of ηSC, i.e.  is −0.15% K–1 for the PVK SC and −0.27% K–1 for the Si SC, are close to the experimental values of −0.17% K–1 (PVK)
49) and −0.26% K–1 (HJ Si).
50)
is −0.15% K–1 for the PVK SC and −0.27% K–1 for the Si SC, are close to the experimental values of −0.17% K–1 (PVK)
49) and −0.26% K–1 (HJ Si).
50)
3.2. Solar-to-H2 and -CO energy conversion efficiencies of artificial photosynthetic devices (ηH2 and ηCO)
The operating point of the VM-nEC artificial photosynthetic device illustrated in Fig. 1(d) is determined from the J–V curve of the VM tandem SC module and the load curve of the EC module. When nEC EC reactors are connected in series in the EC module powered by the VM SC module, the J–V curve per a single EC reactor is

The intersection of this J–V curve and the load curve of the EC reactor (![${j}_{{\rm{EC}}}\left[V\right]$](https://content.cld.iop.org/journals/1347-4065/62/SK/SK1018/revision3/jjapacc3a5ieqn11.gif) ) determines the operating point (Jop and Vop).
) determines the operating point (Jop and Vop).
The Faradaic efficiency (ηFE) of the EC reaction of H2O → H2 + 1/2 O2 is virtually unity. The thermodynamic threshold voltage of this reaction is 1.23 V. Thus, the conversion efficiency of solar energy to chemical energy of H2 (ηH2) is derived as follows,

On the other hand, ηFE of the CO2 → CO + 1/2 O2 reaction is lower than unity and dependent on Vop. Therefore, the solar-to-CO energy conversion efficiency (ηCO) is calculated by

using the thermodynamic threshold voltage of 1.34 V.
For numerical evaluations, the load curve of the H2-producing reactor was taken from Ref. 51, the load curve and ηFE for the CO production from Ref. 52, and these curves are depicted in Fig. 3. CO production requires a higher voltage by approximately 0.2 V than H2 production. Another point is that the ηFE of CO production lowers with decreasing voltage from 1.7 V.
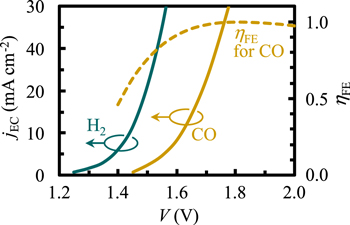
Fig. 3. Load curve of an H2-producing EC reactor, 51) and the load curve and voltage-dependent ηFE of a CO-producing EC reactor. 52)
Download figure:
Standard image High-resolution image3.3. Outdoor operation conditions
The standard condition for SC evaluations is the combination of AM 1.5 G illumination (Psun = 100 mW cm−2)
39) and Tcell = 25 °C. However, this is a rare condition for outdoor use; mostly, Psun is smaller and Tcell is higher. Therefore, the average values of Psun and Tcell ( and
and  respectively) and their distributions were obtained for a south-facing 32° slope using a database of Psun, solar spectrum, and ambient temperature (Ta) measured in Tsukuba, Japan (N36° and E140°, in 2015).
53) The weighted values of
respectively) and their distributions were obtained for a south-facing 32° slope using a database of Psun, solar spectrum, and ambient temperature (Ta) measured in Tsukuba, Japan (N36° and E140°, in 2015).
53) The weighted values of  and
and  by Psun were calculated as follows because the electricity of the SC modules and the H2 and CO production rates of the artificial photosynthetic devices are approximately proportional to Psun,


An empirical relation of Psun and Ta to Tcell was adopted for determining Tcell, 49)

where NOCT denotes the nominal operating cell temperature defined as Tcell at Psun = 80 mW cm−2, Ta = 20 °C, and a wind speed of 1 m s−1.
The results were  = 63.9 mW cm−2 and
  = 37.7 °C, and their distributions are depicted in Figs. 4(a) and 4(b), respectively. Eighty percent of the relative frequency distribution of Psun locates in a range of 20–95 mW cm−2, and 80% of the Tcell distribution in 20 °C–55 °C.

Fig. 4. Frequency distributions of (a) the solar intensity (Psun) and (b) cell temperature (Tcell). (c) and (d) Annually averaged spectral solar photon flux (![$\left\langle {n}_{{\rm{sun}}}\left[\hslash \omega \right]\right\rangle $](https://content.cld.iop.org/journals/1347-4065/62/SK/SK1018/revision3/jjapacc3a5ieqn18.gif) ) compared with the AM 1.5 G spectrum. Converted
) compared with the AM 1.5 G spectrum. Converted ![$\left\langle {n}_{{\rm{sun}}}\left[\hslash \omega \right]\right\rangle $](https://content.cld.iop.org/journals/1347-4065/62/SK/SK1018/revision3/jjapacc3a5ieqn19.gif) corresponding to Psun = 100 mW cm−2 is plotted in (d) for direct comparison with the AM 1.5 G. (e) Frequency distribution of the relative difference in the photocurrent densities (
corresponding to Psun = 100 mW cm−2 is plotted in (d) for direct comparison with the AM 1.5 G. (e) Frequency distribution of the relative difference in the photocurrent densities ( ). Psun and
 ![${n}_{{\rm{sun}}}\left[\hslash \omega \right]$](https://content.cld.iop.org/journals/1347-4065/62/SK/SK1018/revision3/jjapacc3a5ieqn21.gif) were measured on a south-facing 32° slope in Tsukuba, Japan (N36° and E140°, in 2015),
53) whereas Tcell was estimated from the measured Psun and ambient temperature (Ta) using Eq. (12).
were measured on a south-facing 32° slope in Tsukuba, Japan (N36° and E140°, in 2015),
53) whereas Tcell was estimated from the measured Psun and ambient temperature (Ta) using Eq. (12).
Download figure:
Standard image High-resolution imageThe average of ![${n}_{{\rm{sun}}}\left[\hslash \omega \right]$](https://content.cld.iop.org/journals/1347-4065/62/SK/SK1018/revision3/jjapacc3a5ieqn22.gif) (
(![$\left\langle {n}_{{\rm{sun}}}\left[\hslash \omega \right]\right\rangle $](https://content.cld.iop.org/journals/1347-4065/62/SK/SK1018/revision3/jjapacc3a5ieqn23.gif) ) was determined in a similar manner,
) was determined in a similar manner,

As is clear from Figs. 4(c) and 4(d), ![$\left\langle {n}_{{\rm{sun}}}\left[\hslash \omega \right]\right\rangle $](https://content.cld.iop.org/journals/1347-4065/62/SK/SK1018/revision3/jjapacc3a5ieqn24.gif) is close to the AM 1.5 G photon flux, except that the high photon-energy components are relatively only slightly more intense. The variation in the spectrum was quantified by the relative difference (
is close to the AM 1.5 G photon flux, except that the high photon-energy components are relatively only slightly more intense. The variation in the spectrum was quantified by the relative difference ( ) between the photocurrent densities of the PVK with
  = 1.7 eV and Si SCs (
 and
and  respectively),

The frequency distribution of  is depicted in Fig. 4(e); 80% of the relative distribution ranges from −0.05 to 0.2 with
  = 0.036 for
 ![$\left\langle {n}_{{\rm{sun}}}\left[\hslash \omega \right]\right\rangle .$](https://content.cld.iop.org/journals/1347-4065/62/SK/SK1018/revision3/jjapacc3a5ieqn31.gif)
Although the characteristics of the EC reactors are also affected by their temperature, the general trends are not clear because the effects differ depending on the target reactions and catalyst materials. 54,55) In addition, the temperature variation is smaller than that of the SC module that is directly solar-illuminated. Therefore, the temperature dependence was neglected, and jEC and ηFE measured at RT, shown in Fig. 3, were always used.
Recently, high-performance PVK SCs with up to  = 1.7 eV have been realized.
15,16) Therefore, we employed a combination of the Si SCs and PVK SCs with
= 1.7 eV have been realized.
15,16) Therefore, we employed a combination of the Si SCs and PVK SCs with  = 1.7 eV to design the VM tandem SC modules and artificial photosynthetic VM-nEC devices. First,
  of the VM module was optimized so that ηSC was maximized under the "average" condition of
 and
and ![$\left\langle {n}_{{\rm{sun}}}\left[\hslash \omega \right]\right\rangle $](https://content.cld.iop.org/journals/1347-4065/62/SK/SK1018/revision3/jjapacc3a5ieqn37.gif) derived above, and subsequently other practical conditions depicted in Fig. 4. Although nPVK and nSi are integers,
derived above, and subsequently other practical conditions depicted in Fig. 4. Although nPVK and nSi are integers,  can be finely tuned for a large-sized module with large nPVK and nSi. Therefore, they were dealt with as continuous variables. Then, the annually averaged ηSC (
 ) determined by the ratio of the accumulated electricity production to the accumulated solar intensity was calculated. Thus, the suitable optimization condition was sought by investigating the impacts of the optimization conditions on
  The design parameters of the artificial photosynthetic devices, i.e.
  and
and  , were similarly dealt with as continuous variables and optimized. The effects of the optimization conditions on the annually averaged ηH2 and ηCO (
 and
and  respectively) were investigated, and thus the design guide was derived. Finally, we discussed the feasibility of improvements in
 and
and  assuming realization of PVK SCs with
  wider than 1.7 eV, by calculating
  etc. as functions of
4. Results and discussion
4.1. VM tandem SC modules
First, we considered the VM tandem SC modules illustrated in Fig. 1(c). Figure 5(a) shows the dependence of ηSC on Psun for the VM module ( = 1.98) optimized under the average condition of
  = 63.9 mW cm−2,
  = 37.7 °C, and
 ![$\left\langle {n}_{{\rm{sun}}}\left[\hslash \omega \right]\right\rangle $](https://content.cld.iop.org/journals/1347-4065/62/SK/SK1018/revision3/jjapacc3a5ieqn54.gif) (
( = 0.036). The VMPP values of the VM module and top/bottom modules are also depicted. In the calculated Psun range, VMPP of the Si SC monotonically increases, proportionally to
 ![$\mathrm{log}\left[{P}_{{\rm{sun}}}\right].$](https://content.cld.iop.org/journals/1347-4065/62/SK/SK1018/revision3/jjapacc3a5ieqn56.gif) By contrast, the VMPP of the PVK SC changes only slightly, because its rs is an order of magnitude larger than that of the Si SC and hence the ohmic loss is more significant at a large Psun.
56,57) As a result, the change in ηSC is 0.9% at most in the Psun range of 20–95 mW cm−2 in which the relative frequency distribution accounts for 80%. Although the difference between the VMPP values of the PVK and Si SCs, namely, the voltage mismatch, increases when Psun shifts from
By contrast, the VMPP of the PVK SC changes only slightly, because its rs is an order of magnitude larger than that of the Si SC and hence the ohmic loss is more significant at a large Psun.
56,57) As a result, the change in ηSC is 0.9% at most in the Psun range of 20–95 mW cm−2 in which the relative frequency distribution accounts for 80%. Although the difference between the VMPP values of the PVK and Si SCs, namely, the voltage mismatch, increases when Psun shifts from  it is as small as 0.05 V at most in the relevant Psun range. Thus, it causes only a slight lowering in ηSC, smaller than 0.2% at a given Psun relative to that of the 4T tandem SC that is free from the voltage mismatching problem. The details are discussed in Appendix A.
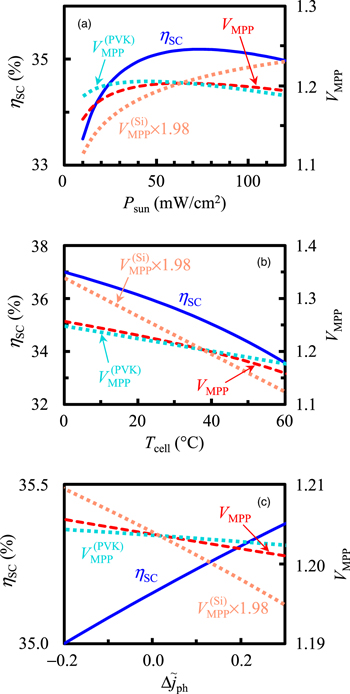
Fig. 5.
ηSC and VMPP of the VM tandem SC module and VMPP values of the top/bottom modules. The optimization conditions are the average conditions of Psun =  = 63.9 mW cm−2, Tcell =
  = 37.7 °C, and
 ![${n}_{{\rm{sun}}}\left[\hslash \omega \right]$](https://content.cld.iop.org/journals/1347-4065/62/SK/SK1018/revision3/jjapacc3a5ieqn60.gif) =
= ![$\left\langle {n}_{{\rm{sun}}}\left[\hslash \omega \right]\right\rangle $](https://content.cld.iop.org/journals/1347-4065/62/SK/SK1018/revision3/jjapacc3a5ieqn61.gif) (
( = 0.036), resulting in
  = 1.98. The operating conditions are the average conditions except for the parameter of the horizontal axis in each figure.
Download figure:
Standard image High-resolution imageBy contrast, the impact of Tcell is notable, as is clear from Fig. 5(b). When Tcell rises from the lower bound (20 °C) to the upper bound (55 °C) of 80% of the relative frequency distribution, ηSC lowers by 2.2% because the VMPP of each submodule is a decreasing function of Tcell. In addition, the VMPP of the Si SC decreases more rapidly than that of the PVK SC. However, the detrimental impact of the resultant voltage mismatch is marginal. The maximal mismatch is 0.04 V, which lowers ηSC relative to that of the 4T module by only 0.2%.
On the other hand, it is apparent that the impact of  is extremely weak, as shown in Fig. 5(c), even though the present model of no overlap between the PVK and Si absorption ranges would overestimate the impact. The voltage mismatch is 0.005 V at most, corresponding to a negligibly small change in ηSC of 0.0002%, in the
  range of the 80% frequency distribution between −0.05 to 0.2.
Thus, it was found that the impact of Tcell on ηSC is notable, whereas the other two operating conditions of Psun and ![${n}_{{\rm{sun}}}\left[\hslash \omega \right]$](https://content.cld.iop.org/journals/1347-4065/62/SK/SK1018/revision3/jjapacc3a5ieqn66.gif) have only a slight effect. Therefore,
have only a slight effect. Therefore,  was optimized under three Tcell conditions: Tcell = 25 °C,
  = 37.7 °C, and 50 °C with the average conditions for Psun and
 ![${n}_{{\rm{sun}}}\left[\hslash \omega \right].$](https://content.cld.iop.org/journals/1347-4065/62/SK/SK1018/revision3/jjapacc3a5ieqn69.gif) The results are compared in Fig. 6. Although the slope of the ηSC vs. Tcell relation depends on the Tcell value adopted for the optimization, the difference is minor. Consequently, all three
The results are compared in Fig. 6. Although the slope of the ηSC vs. Tcell relation depends on the Tcell value adopted for the optimization, the difference is minor. Consequently, all three  values, which are the average of ηSC over various Tcell values, are almost the same: 34.6%–34.7%. In other words,
  is scarcely affected even when the design parameter of
  changes between 1.9–2.0. Further, when
  was optimized under the condition of the AM 1.5 G illumination (Psun = 100 mW cm−2) and Tcell = 25 °C that is the standard for SC evaluation,
  was 34.5%, virtually the same as the abovementioned three values. The resultant
  values are more realistic than the results of over 40% in the radiative limit,
29) although there remains a slight discrepancy from the practically achievable values because the parasitic optical and ohmic losses are neglected in the present model as described in Sect. 3.1. In addition, improvements in semi-transparent PVK SCs are obviously essential.
values are more realistic than the results of over 40% in the radiative limit,
29) although there remains a slight discrepancy from the practically achievable values because the parasitic optical and ohmic losses are neglected in the present model as described in Sect. 3.1. In addition, improvements in semi-transparent PVK SCs are obviously essential.
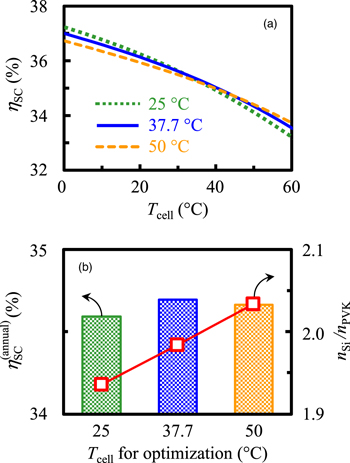
Fig. 6. (a) ηSC of the VM tandem SC modules optimized under the conditions of Psun =  Tcell = 25 °C,
  = 37.7 °C, and 50 °C, and
 ![${n}_{{\rm{sun}}}\left[\hslash \omega \right]$](https://content.cld.iop.org/journals/1347-4065/62/SK/SK1018/revision3/jjapacc3a5ieqn78.gif) =
= ![$\left\langle {n}_{{\rm{sun}}}\left[\hslash \omega \right]\right\rangle .$](https://content.cld.iop.org/journals/1347-4065/62/SK/SK1018/revision3/jjapacc3a5ieqn79.gif) The operating conditions are the average conditions except Tcell. (b) Impact of Tcell used for the optimization of
The operating conditions are the average conditions except Tcell. (b) Impact of Tcell used for the optimization of  on
on 
Download figure:
Standard image High-resolution imageConsequently,  of the VM tandem SC module can be optimized under any practical conditions. This is because the lowering in ηSC caused by the voltage mismatch under varying operation conditions is smaller than 0.2% in most cases, and hence scarcely affects ηSC in the annual average. This is also the reason that
  = 34.7% of the 4T tandem SC module calculated in a similar manner is almost the same as that of the VM module. A detailed comparison between the VM module and 4T module is described in Appendix A.
4.2. VM-nEC H2-producing artificial photosynthetic devices
Next, we calculated ηH2 of the H2-producing artificial photosynthetic devices consisting of the VM tandem SC modules and EC modules shown in Fig. 1(d). The requisite for a high ηH2 is that the VMPP of the SC module is a little larger than 1.4 eV, as stated in Sect. 2. Figure 7 depicts the results for the device optimized under the average condition ( = 1.22 and
  = 2.43). The significant difference from ηSC of the VM SC module coupled with a power conditioner displayed in Fig. 5 is that ηH2 is a monotonically decreasing function of Psun. The lowering in ηH2 is as large as 1.6% when Psun increases from 20 mW cm−2 to 95 mW cm−2. Another difference is that ηH2 becomes only slightly higher at a lower Tcell than
  = 37.7 °C although the lowering in the higher Tcell range is similar to that for ηSC. On the other hand, the effect of
  is again marginal.

Fig. 7.
ηH2 and Vop of the VM-nEC H2-producing artificial photosynthetic device, and VMPP of the VM tandem SC module used in the device. The optimization conditions are the average conditions of Psun =  = 63.9 mW cm−2, Tcell =
  = 37.7 °C, and
 ![${n}_{{\rm{sun}}}\left[\hslash \omega \right]$](https://content.cld.iop.org/journals/1347-4065/62/SK/SK1018/revision3/jjapacc3a5ieqn90.gif) =
= ![$\left\langle {n}_{{\rm{sun}}}\left[\hslash \omega \right]\right\rangle $](https://content.cld.iop.org/journals/1347-4065/62/SK/SK1018/revision3/jjapacc3a5ieqn91.gif) (
( = 0.036), resulting in
  = 1.22 and
  = 2.43. The operating conditions are the average conditions except for the parameter of the horizontal axis in each figure.
Download figure:
Standard image High-resolution imageThese dependences of ηH2 on Psun and Tcell arise from the mismatch between VMPP of the SC module and Vop, as depicted in Fig. 2. A larger Psun and a higher Tcell lead to VMPP < Vop, and therefore ηH2 that is proportional to  rapidly lowers. On the other hand, when Psun increases and Tcell falls, Vop decreases below VMPP, Jop shifts from JMPP toward Jph, and consequently ηH2 increases slightly.
Thus, Psun and Tcell strongly affect ηH2; a large Psun is equivalent to a high Tcell. Therefore,  and
and  were optimized under five conditions in which both Psun and Tcell were simultaneously changed. The results are shown in Fig. 8. When a small Psun and a low Tcell are adopted for the optimization, ηH2 lowers remarkably with increasing Psun and Tcell although ηH2 is high at a small Psun and a low Tcell. By contrast, ηH2 changes moderately when the design parameters of
  and
and  are optimized under a condition of a large Psun and a high Tcell. Reflecting these trends,
  notably depends on the optimization conditions, in contrast to
  The best optimization condition, i.e. Psun = 80 mW cm−2 and Tcell = 45 °C (Condition D in Fig. 8) are both slightly greater than the average values. The maximal
  is as high as 28.7%, although there is a slight discrepancy from the practically achievable values, as discussed in Sect. 4.1. However, it should be noted that too large a Psun and too high a Tcell (Condition E) decrease
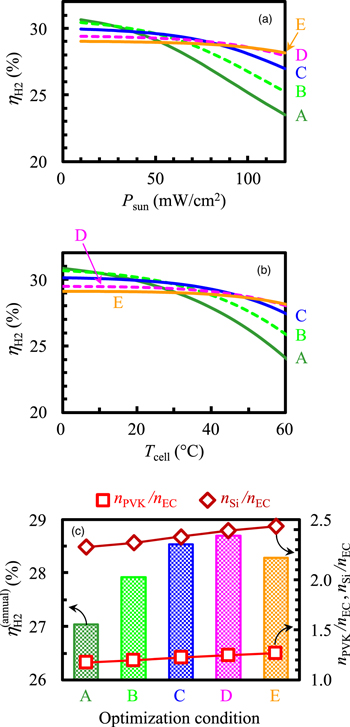
Fig. 8. (a) and (b) ηH2 of the VM-nEC H2-producing artificial photosynthetic devices optimized under five conditions, A–E. A: Psun = 40 mW cm−2 and Tcell = 25 °C. B: Psun = 50 mW cm−2 and Tcell = 30 °C. C: Psun =  = 63.9 mW cm−2 and Tcell =
  = 37.7 °C. D: Psun = 80 mW cm−2 and Tcell = 45 °C. E: Psun = 90 mW cm−2 and Tcell = 50 °C.
 ![${n}_{{\rm{sun}}}\left[\hslash \omega \right]$](https://content.cld.iop.org/journals/1347-4065/62/SK/SK1018/revision3/jjapacc3a5ieqn105.gif) =
= ![$\left\langle {n}_{{\rm{sun}}}\left[\hslash \omega \right]\right\rangle $](https://content.cld.iop.org/journals/1347-4065/62/SK/SK1018/revision3/jjapacc3a5ieqn106.gif) is used for the optimization for all conditions A–E. The operating conditions are the average conditions except for the parameter of the horizontal axis in each figure. (c) Impacts of Psun and Tcell used for the optimization of
is used for the optimization for all conditions A–E. The operating conditions are the average conditions except for the parameter of the horizontal axis in each figure. (c) Impacts of Psun and Tcell used for the optimization of  and
and  on
on 
Download figure:
Standard image High-resolution imageWhen the device is optimized under the standard condition for SC evaluation of AM 1.5 G illumination (Psun = 100 mW cm−2) and Tcell = 25 °C, the resultant  = 28.4% is approximately the same as the maximal value determined under the best optimization condition. However, this is attributed to the combination of a Psun close to the upper bound of the measured frequency distribution and a Tcell close to the lower bound shown in Fig. 4 having an effect similar to that of the best optimization condition, because a large Psun is equivalent to a high Tcell. It should be noted again that the standard condition are far from typical conditions or the average condition.
Figure 9 compares the J–V curves of the VM tandem SC module used in the device optimized under the best optimization condition (Condition D in Fig. 8) with the load curve of the EC reactor. When the device operates under the optimization condition (the solid line), Vop determined by the intersection of the two curves, coincides with VMPP, leading to a high ηH2. However, Vop shifts away from VMPP and hence ηH2 lowers when Psun and Tcell change, although these detriments are minimized. This drawback of the direct connection of the SC module and EC module is solved by using a DC–DC converter for connecting these two modules. However, it is found that the energy loss originating from the voltage mismatch for the optimized device is smaller than the internal loss of a commonly used DC–DC converter with an efficiency of 90%–95%.
58,59) In short, the direct connection yields a higher  The details are discussed in Appendix B.

Fig. 9. J–V curves of the VM tandem SC module and the load curve of the EC module used in the VM-nEC H2-producing artificial photosynthetic device. The optimization condition is D used in Fig. 8, and the operating conditions are A, D, and E. The open square depicts VMPP under each operating condition.
Download figure:
Standard image High-resolution image4.3. VM-nEC CO-producing artificial photosynthetic devices
We also considered the CO-producing artificial photosynthetic devices. Figure 10 shows ηCO, Vop, and VMPP of the device optimized under the average condition ( = 1.34 and
  = 2.78). As is clear from Fig. 10(a), ηCO rapidly lowers with decreasing Psun. This qualitative difference from the Psun dependence of ηH2 depicted in Fig. 7(a) arises from the ηFE of the EC reactor that lowers at a low Vop and a small Jop; see Fig. 3. The hypothetical ηCO supposing ηFE = 1 (dotted line) depends on Psun similarly to ηH2.
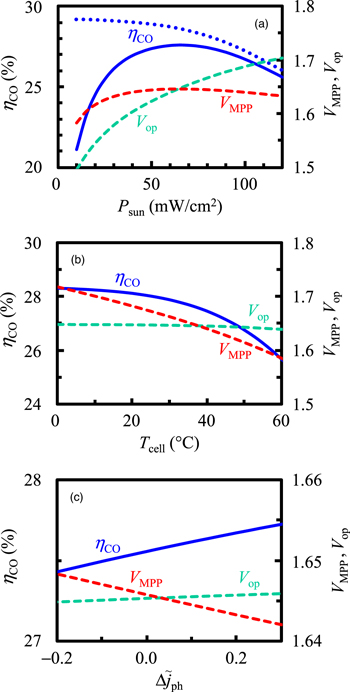
Fig. 10.
ηCO and Vop of the VM-nEC CO-producing artificial photosynthetic device, and VMPP of the VM tandem SC module used in the device. The optimization conditions are the average conditions of Psun =  = 63.9 mW cm−2, Tcell =
  = 37.7 °C, and
 ![${n}_{{\rm{sun}}}\left[\hslash \omega \right]$](https://content.cld.iop.org/journals/1347-4065/62/SK/SK1018/revision3/jjapacc3a5ieqn116.gif) =
= ![$\left\langle {n}_{{\rm{sun}}}\left[\hslash \omega \right]\right\rangle $](https://content.cld.iop.org/journals/1347-4065/62/SK/SK1018/revision3/jjapacc3a5ieqn117.gif) (
( = 0.036), resulting in
  = 1.34 and
  = 2.78. The operating conditions are the average conditions except for the parameter of the horizontal axis in each figure. The dotted line in (a) depicts ηCO supposing ηFE = 1.
Download figure:
Standard image High-resolution imageThe impacts of the optimization conditions on the Psun- and Tcell-dependent ηCO depicted in Figs. 11(a) and 11(b), respectively, are also similar to those for the H2-producing devices, except for the rapid lowering in the small Psun range arising from the low ηFE; see Fig. 8. Thus,  is also maximized when the design parameters of
  and
and  are optimized under the condition of Psun = 80 mW cm−2 and Tcell = 45 °C (Condition D in Fig. 11) that are both slightly greater than the average values. However, the lowering in
  when optimized with the larger Psun and higher Tcell (Condition E) is moderate, reflecting that a smaller Psun and a resultant smaller Jop lead to a lower ηFE. Therefore, the more precisely selected best Psun for the optimization should be larger than that for the H2 production. It should be again noted that the present model of the SC modules will slightly overestimate
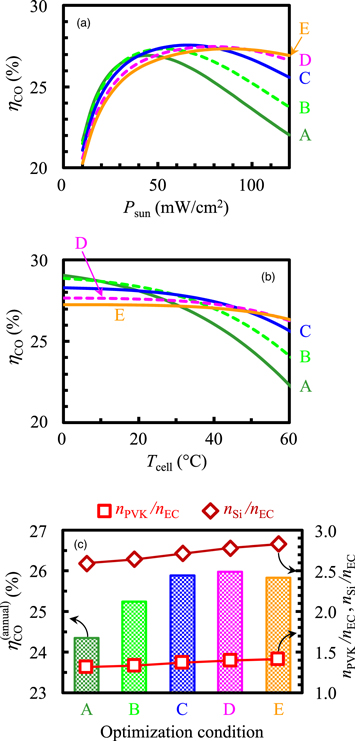
Fig. 11. (a) and (b) ηCO of the VM-nEC CO-producing artificial photosynthetic devices are optimized under five conditions, A–E. A: Psun = 40 mW cm−2 and Tcell = 25 °C. B: Psun = 50 mW cm−2 and Tcell = 30 °C. C: Psun =  = 63.9 mW cm−2 and Tcell =
  = 37.7 °C. D: Psun = 80 mW cm−2 and Tcell = 45 °C. E: Psun = 90 mW cm−2 and Tcell = 50 °C.
 ![${n}_{{\rm{sun}}}\left[\hslash \omega \right]$](https://content.cld.iop.org/journals/1347-4065/62/SK/SK1018/revision3/jjapacc3a5ieqn128.gif) =
= ![$\left\langle {n}_{{\rm{sun}}}\left[\hslash \omega \right]\right\rangle $](https://content.cld.iop.org/journals/1347-4065/62/SK/SK1018/revision3/jjapacc3a5ieqn129.gif) is used for the optimization for all conditions A–E. The operating conditions are the average conditions except for the parameter of the horizontal axis in each figure. (c) Impacts of Psun and Tcell used for the optimization of
is used for the optimization for all conditions A–E. The operating conditions are the average conditions except for the parameter of the horizontal axis in each figure. (c) Impacts of Psun and Tcell used for the optimization of  and
and  on
on 
Download figure:
Standard image High-resolution imageThe J–V curves of the VM tandem SC module used in the device optimized under the best optimization condition (Condition D in Fig. 11) are plotted in Fig. 12, with the load curve and ηFE of the EC reactor. Although ηFE is close to unity under the intense illumination of Psun = 90 and 80 mW cm−2 (Conditions E and D, respectively), it lowers to 0.91 at Psun = 40 mW cm−2 (Condition A). However, it should be noted that how much ηFE lowers depends on the EC reactor structure, catalysts used in the reactor, etc. It was confirmed again that the direct connection of the optimized VM SC module and EC module yields a higher  than the use of a DC–DC converter; the numerical results are shown in Appendix B.
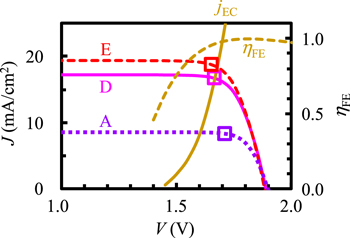
Fig. 12. J–V curves of the VM tandem SC module, and the load curve and ηFE of the EC module used in the VM-nEC CO-producing artificial photosynthetic device. The optimization condition is D used in Fig. 11, and the operating conditions are A, D, and E. The open square depicts VMPP under each operating condition.
Download figure:
Standard image High-resolution image4.4. Application of wide Eg PVK SCs
In the previous subsections, the PVK SC with  = 1.7 eV was adopted for the design of the VM tandem SC modules because the performance of the PVK SCs with a wider
  than 1.7 eV is not sufficiently high at present.
15,16) Finally, we discuss the feasibility of improvements in
than 1.7 eV is not sufficiently high at present.
15,16) Finally, we discuss the feasibility of improvements in 
 and
and  when highly efficient PVK SCs with a wider
  are realized. The fitting parameters of ηEQE, ηERE, and rs obtained in Sect. 3.1 were used, neglecting their
  dependences.
Figure 13(a) compares the  values of the VM and 2T tandem SC modules as a function of
  The advantage of the VM module is the weak dependence on
  which is in contrast to the
  of the 2T module being strongly affected by
  because of the current matching problem.
28,29,31,32) Although
because of the current matching problem.
28,29,31,32) Although  of the VM module is maximized at
  = 1.84 eV, the gain compared with the value at
  = 1.7 eV is as small as 0.4%.
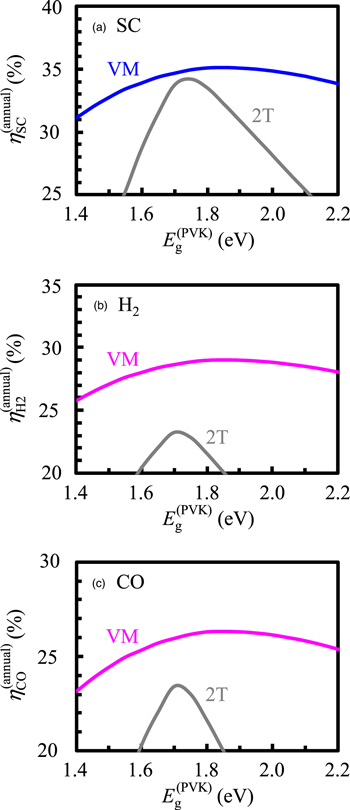
Fig. 13. (a)  of the tandem SC modules, (b)
  of the H2-producing artificial photosynthetic devices, and (c)
  of the CO-producing artificial photosynthetic devices dependent on
  The results for the VM modules and 2T modules are compared. The VM modules are optimized under the average condition for the SC modules in (a), whereas Condition D in Figs. 8 and 11 is adopted for the artificial photosynthetic devices in (b) and (c).
Download figure:
Standard image High-resolution imageThe results for the H2- and CO-producing artificial photosynthetic devices using the VM-nEC configuration exhibit similar trends, as shown in Figs. 13(b) and 13(c), respectively. The maximal  and
and  at
at  = 1.84–1.85 eV are higher than those at
  = 1.7 eV by only 0.3%–0.4%. Therefore, it is concluded that the room for improvements in
 and
and  using a wider
  PVK SC is extremely narrow, and hence the focus should be further improvements in ηSC and durability with
  = 1.7 eV.
The maximal  for the 2T SC module that satisfies the current matching under the optimization condition is close to that for the VM SC module.
28,29,31,32) By contrast, the maximal
for the 2T SC module that satisfies the current matching under the optimization condition is close to that for the VM SC module.
28,29,31,32) By contrast, the maximal  and
and  for the 2T-EC devices are remarkably lower than those for the VM-nEC devices. This is because the optimal
  of the 2T modules are determined from the current matching condition, resulting in too high a VMPP to power the present EC reactors.
28)
of the 2T modules are determined from the current matching condition, resulting in too high a VMPP to power the present EC reactors.
28)
5. Conclusions
We have clarified the design guides for the H2- and CO-producing artificial photosynthetic devices consisting of the VM PVK ( = 1.7 eV)/Si tandem SC modules and EC modules in which multiple EC reactors are connected in series. The design parameters of
  and
and  must be optimized under the conditions of slightly larger Psun and higher Tcell than the average values, respectively. This is in contrast to that the VM tandem SC modules, whose configuration is characterized by
  , can be optimized under any practical conditions when they are coupled with power conditioners. Even if highly efficient PVK SCs with
  = 1.84–1.85 eV are realized,
  and
and  (and also
  ) improve by only 0.3%–0.5% relative to those at
  = 1.7 eV.
Appendix A
When the VM tandem SC module operates under the optimization condition, the voltage matching holds, and hence ηSC coincides with that of the 4T tandem SC module. However, ηSC lowers relative to the 4T value under different operating conditions, because the voltage matching breaks. Nevertheless, as shown in Figs. A 1(a)–A1(c), the difference from ηSC of the 4T module is 0.2% at most, in the relevant range of the operating conditions: Psun from 20 to 95 mW cm−2, Tcell from 20 °C to 55 °C, and
  from −0.05 to 0.2. Consequently,
  of the VM module, which is the average over various operating conditions, is virtually the same as that of the 4T module; the difference is as small as 0.05%, at
  = 1.7–1.8 eV required for a high
  28,29,31,32); see Fig. A1(d).

Fig. A1. (a)−(c) Comparison of ηSC between the VM and 4T tandem SC modules. The optimization conditions for the VM module are the average conditions of Psun =  = 63.9 mW cm−2, Tcell =
  = 37.7 °C, and
 ![${n}_{{\rm{sun}}}\left[\hslash \omega \right]$](https://content.cld.iop.org/journals/1347-4065/62/SK/SK1018/revision3/jjapacc3a5ieqn181.gif) =
= ![$\left\langle {n}_{{\rm{sun}}}\left[\hslash \omega \right]\right\rangle $](https://content.cld.iop.org/journals/1347-4065/62/SK/SK1018/revision3/jjapacc3a5ieqn182.gif) (
( = 0.036), resulting in
  = 1.98. The operating conditions are the average conditions except for the parameter of the horizontal axis in each figure. (d)
  of the VM and 4T modules dependent on
  In (c) and (d), the plots for the VM and 4T modules almost overlap with each other.
Download figure:
Standard image High-resolution imageAppendix B
In Sects. 4.2 and 4.3, it was found that the artificial photosynthetic devices consisting of the directly connected VM tandem SC modules and EC modules involve a voltage mismatching problem. Here, the two kinds of modules are connected via DC–DC converters (DDCs) to solve the problem. The VM modules should be optimized so that the output power (or ηSC) is maximized, like SC modules coupled with power conditioners. This offers an advantage that precise design is not required because  is less sensitive to the optimization conditions than
  and
and  as stated in Sect. 4.1.
The operating point of the EC module changes depending on the DDC setting. The maximal value of Jop per a single EC reactor ( ) and the corresponding voltage (
 ) are obtained by solving the following equation,

where ηDDC is the efficiency of the DC–DC conversion.
Figure B1 shows the results of  and
and  Although ηDDC changes depending on the setting, it usually ranges from 90%–95%.
58,59) Thus, the direct connection of the VM tandem SC modules and EC modules yields higher ηH2 and ηCO than the use of the DDCs.
Although ηDDC changes depending on the setting, it usually ranges from 90%–95%.
58,59) Thus, the direct connection of the VM tandem SC modules and EC modules yields higher ηH2 and ηCO than the use of the DDCs.

Fig. B1. (a)  and (b)
  of the artificial photosynthetic devices with two configurations: direct connection of the VM tandem SC modules and EC modules, and connection via DC–DC converters (DDCs). The VM modules used for the direct connection are optimized under Condition D in Figs. 8 and 11, whereas those used with DDCs under the average condition.
Download figure:
Standard image High-resolution image