

Abstract
The orientation angles of liquid crystal (LC) molecules were measured during ultrasound vibrations. Light transmitted through a fabricated LC lens was analyzed via the crossed Nicol condition and a crystal rotation method. The LC orientation angle was estimated with a theoretical model, and its distribution in the lens was determined. There was a strong correlation between the molecular angles and ultrasonic vibrational distributions, indicating that the angle was changed by the acoustic radiation force. The maximum tilt angle was 12° for a 50 V peak-to-peak input.
Export citation and abstract BibTeX RIS
Camera modules used in devices such as cellular phones consist of several convex and concave solid lenses. To adjust the focal position, one lens is moved along the optical axis via mechanical actuators and gearing. These mechanical systems increase the total volume of the camera modules, 1) and limit the response speed for capturing fast-moving obejcts along the optical axis. 2) Liquid lenses have been developed that utilize differences in refractive indices between two immiscible liquids, such as water and oil, and the focal length can be changed with a driving signal. 3–5) They have simple structures with no mechanical moving parts and can be downsized. Variable-focus lenses, such as liquid, 6–8) gel, 9,10) and liquid crystal (LC) lenses, 11–14) have also been developed that use ultrasound vibrations where the focal length can be controlled by acoustic radiation force. 15) The LC lenses have exhibited both robustness and downsizing. LC materials are in an intermediate state between liquid and solid and exhibit both liquidity and anisotropy. They are classified into three types: nematic, smectic, and cholesteric. Nematic LCs are widely used in optical devices, such as displays, 16) because they have high liquidity, and the optical anisotropy can be controlled easily by external forces such as electric fields. Sato et al. reported electric-field-type variable-focus LC lenses, 17–20) where the focal point was controlled by changing the refractive index distribution in the lens. In conventional LC devices, including lenses, transparent indium tin oxide (ITO) electrodes are required to apply electric fields. Although ITO is very transparent and exhibits low power consumption, indium is a rare metal that requires costly sputtering deposition systems for fabrication. 21) Furthermore, inorganic materials such as ITO would be unsuitable for flexible devices.
Previously, we reported a method without ITO electrodes that controlled the molecular orientation in LCs with ultrasound vibrations. 22,23) The orientation could be changed statically via acoustic radiation force. Ultrasonic LC lenses have been developed for industrial applications. 11) The orientation distributions and the optical characteristics of the lens were investigated. However, quantitative measurements of LC molecular orientations under ultrasound excitation have not been reported. The molecular orientations via ultrasonic excitation were predicted qualitatively for the crossed Nicol condition. 12) For practical industrial applications, the polarization characteristics of ultrasonic LC lenses should be determined to estimate important parameters such as the focal length. Here, the molecular orientation in an ultrasound LC lens was measured quantitatively via the crossed Nicol condition and the crystal rotation method. 24) The tilt angle of the LC molecules was evaluated, and the relationship between molecular orientation and ultrasound vibrations was determined.
The ultrasound LC lens consisted of an LC layer sandwiched by two glass discs [(a) and (b) in Fig. 1(a)], and an ultrasound piezoelectric transducer. Nematic LC 5CB was used (1.533 refractive index no at 589 nm; 0.183 birefringence Δn at 589 nm and 24 °C; 28 mPa viscosity at 25 °C; C1550 product code; TCI, Japan). An annular piezoelectric lead zirconate ultrasound transducer (C-213, Fuji Ceramics, Japan; 65 mm outer diameter; 55 mm inner diameter; 1 mm thickness) was attached to a glass disc (a) (65 mm diameter; 0.5 mm thickness) with epoxy. Glass disc (b) (50 mm diameter; 0.5 mm thickness) was attached coaxially to glass disc (a) via a 50 μm thick polyethylene terephthalate spacer. Orientational polyimide films (vertical alignment type; SE-5811, Nissan Chemical, Japan) were formed on the inner surfaces of the two glass discs without rubbing. The LC was injected into the 50 μm thick gap between the two glass discs via capillary forces, and the LC layer was formed by sealing the surrounding area with epoxy. When a continuous sinusoidal electric signal was applied to the ultrasound transducer at resonant frequencies, a flexural standing-wave vibrational mode was generated on the entire lens with concentric vibrational nodal and loop circles. The acoustic wave generated from the transducer propagated in the lens and was reflected at the boundaries between the LC layer, the glass discs, and the surrounding air. Most of the acoustic energy remained in the lens because there was a large acoustic impedance mismatch between the lens and the air. This generated a difference in acoustic energy density at the lens surface and induced a static acoustic radiation force from the lens to the air. The acoustic radiation force changed the molecular orientations in the LC that, in turn, changed the refractive index distribution of the LC lens, thereby refracting and focusing the incident light. The focal position was controlled along the axial 11) and radial directions 14) by controlling the input signal. This was because the orientation distribution in the lens was dependent on the sound pressure distribution in the LC layer.
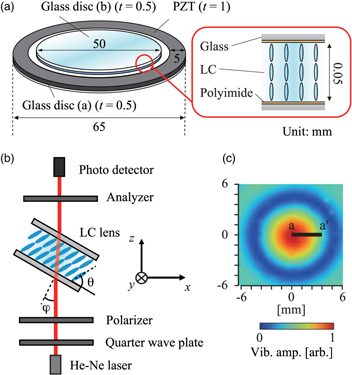
Fig. 1. (Color online) (a) Configuration of the ultrasound liquid crystal (LC) lens. (b) Measurement setup for the crystal rotation method. (c) Vibrational displacement amplitude distribution of the LC lens at the 35 kHz resonance. The line a–a' indicates the scanning line used in the crystal rotation method.
Download figure:
Standard image High-resolution imageThe crystal rotation method was used to measure the tilt angle θ of the LC molecules with respect to the glass discs. The tilt angle with respect to the thickness direction of the LC layer was determined from the change in transmitted light intensity through the LC device when changing the incident angle of the light. Figure 1(b) shows the measurement setup for the crystal rotation method. The LC lens was in the optical axis between two orthogonal polarizers in a crossed Nicol condition. A linearly polarized beam (632.8 nm helium–neon laser; 2 mm beam width) was converted into circular polarization with a quarter-wave plate inserted between the light source and the polarizer so that the polarization direction of the linearly polarized light that passed through the polarizer was 45° with respect to the molecular tilt angle θ in the x–y plane. The light intensity transmitted through the lens and an analyzer was measured with a photodetector (2051-FS, Newport, CA, USA) while changing the incident angle φ of the linearly polarized light. The incident light was perpendicular to the lens when φ = 0. The LC molecules were tilted axisymmetrically toward the center of the lens where the vibrational amplitude was maximized. 12) First, the polarizer and analyzer were rotated, maintaining the crossed Nicol condition, to set the polarization direction of the incident light on the LC lens to 45° with respect to the radial direction of the lens. Then, the LC lens was rotated in the φ direction. The tilt angle θ was estimated by comparing the experimental results with those calculated from a theoretical model. In the case where the LC molecules have optically uniaxial anisotropy, the extraordinary refractive index of an LC molecule with tilt angle ne'(θ) can be expressed as: 24)

where no and ne are the ordinary and extraordinary refractive indices of the LC, respectively. The light transmittance T for the LC layer at tilt angle θ can then be expressed as: 24)
where δ(θ, φ) is the phase retardation caused by the birefringence of the LC molecules, d is the thickness of the LC layer, and λ is the wavelength of the incident light. Therefore, by measuring the transmitted light intensity for changing φ of the incident light, θ in the lens under ultrasound excitation can be estimated from Eqs. (1), (2).
There were several resonance frequencies for the flexural vibrational mode of the LC lens over 20 kHz; here, we used the axisymmetric mode at 35 kHz. Figure 1(c) shows the out-of-plane vibrational displacement amplitude distribution of the LC lens driven by a continuous sinusoidal signal of 50 V peak-to-peak at the 35 kHz resonance frequency. A 12 × 12 mm2 measurement area at the center of the lens was scanned by a laser-Doppler vibrometer (NLV2500, PI Polytech, Waldbronn, Germany), and the vibrational amplitude was normalized. The tilt angle θ was measured along only one line in the radial direction of the lens under the same driving condition, shown by the black line a–a', ranging over r = 0–4 mm (r = 0 corresponds to the center of the lens). This was because the axisymmetric vibration mode would induce an axisymmetric orientation of LC molecules. 12) Figure 2 shows changes in the transmitted light intensity with respect to the incident angle φ for r = 1.7 mm. From Eqs. (1), (2), the theoretical curve was determined by least-squares fitting to the experimental results (0.93 correlation coefficient), enabling an estimate of θ because it was the only unknown parameter. The transmitted light intensity increased and decreased periodically with φ, and θ of the LC molecules at r = 1.7 mm was estimated to be 80°. The dips in the transmitted light intensity at φ = 14°, 28°, and 39° were not as pronounced as in the theoretical results. This might have been because the 2 mm beam width of the incident light was too large considering the spatial gradients of the transmitted light intensity distributions and θ. Hence, the laser beam passed through the LC molecules with slightly different tilt angles, and the measurements were average values within the beam width. This effect increased with φ, resulting in larger discrepancies between the experimental and theoretical curves. Measurement precision would thus be improved with better focusing of the beam spot. Additionally, the distribution of θ in the thickness direction of the LC layer in the optical path affected the measurements. The orientation force resulting from the alignment films acting on the molecules in the central region in the thickness direction of the LC layer was smaller than that for the molecules near the alignment films. Hence, the stiffness and θ vary in the thickness direction (50 μm thick LC layer) compared with those in typical LC devices.

Fig. 2. (Color online) Transmitted light intensity through the LC lens at r = 1.7 mm versus angle φ of the incident light. The LC lens was driven at a continuous sinusoidal signal of 50 V peak-to-peak at 35 kHz.
Download figure:
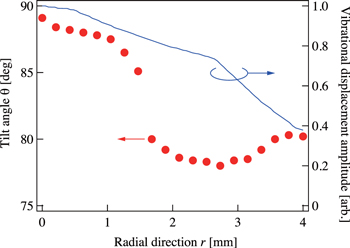
Standard image High-resolution imageThe tilt angle θ along the radial direction of the lens (r = 0–4 mm) was measured via crystal rotation with ultrasound excitation under the same driving condition (50 V peak-to-peak at 35 kHz, Fig. 3). The left and right vertical axes refer to θ and the vibrational amplitude, respectively. The change in θ from the initial vertical orientation (θ = 90°) was small near the center region of the lens (r = 0–1 mm), which corresponded to the vibrational loop position at a large vibrational amplitude, and it increased between the vibrational loop and nodal positions (r = 1.5–4 mm) and was maximized at r = 2.5–2.7 mm. This indicated that the LC molecular orientation was changed by the acoustic radiation force, which were a function of the spatial gradient of the sound pressure distribution; and distribution correlated with the vibrational distribution in the lens. The same trend of LC molecular orientation was observed previously. 12) The sharp change in θ at r = 1.5–1.7 mm was possibly attributed to the fact that the initial molecular orientational in the home-made LC lens did not perfectly align to 90° over the entire lens. For an input of 50 V peak-to-peak, the maximum change in θ from its initial vertical orientation was 12° (θ = 78° at r = 2.7 mm).
Fig. 3. (Color online) Distributions of the tilt angle θ of the LC molecules (left, red) and the vibrational displacement amplitude (right, blue) versus the radial direction in the LC lens in the case with the input voltage of 50 V peak-to-peak at 35 kHz.
Download figure:
Standard image High-resolution image
In summary, the molecular orientation of molecules in an LC lens during ultrasound excitation was determined. The distribution of the molecular tilt angle θ in the lens was measured quantitatively via the crystal rotation method. Large spatial gradients of the vibrational distribution in the lens-induced large changes in θ. Therefore, the molecular orientation was changed by the acoustic radiation force.
Acknowledgments
This work was partly supported by a KAKENHI Grant-in-Aid (No. 19H02056 and 22H01391) from the Japan Society for the Promotion of Science (JSPS), and the Casio Science Promotion Foundation. We thank Edanz (https://jp.edanz.com/ac) for editing a draft of this manuscript.