
Abstract
The aim of this study is to hydrogenate the magnesium oxides using microwave excited hydrogen plasma. Magnesium hydride (MgH2) is important for a regeneration of sodium borohydride (NaBH4) which is attracting attention for a regeneratable powdered hydrogen carrier. In the plasma processing, a hydrogen radical (H*) and ion (H+) will contribute to the hydrogenation of magnesium oxides. However, high temperature at the hydrogenated magnesium surface will cause dehydrogenation. Therefore, we investigated the effect of hydrogen ion dose and sample temperature T in the plasma treatment. As a result of XPS analysis, it was found that MgO was reduced into magnesium by the hydrogen ion dose. The reduced magnesium will support the hydrogenation. As a result of Raman spectroscopy, it was found that hydrogenation and growth of hydrogenated magnesium on the surface of the magnesium oxides require the ion and radical dose and T suppression.
Export citation and abstract BibTeX RIS
1. Introduction
Hydrogen is expected as a sustainable energy. There are various hydrogen sources such as fossil fuels, natural energy and biomass. 1) However, hydrogen is a flammable gas at normal temperature and pressure. Therefore, hydrogen applications require safe, efficient and compact hydrogen carrier. Generally, hydrogen can be carried as compressed gas, cryogenic liquid, or physically or chemically bonded to appropriate solid-state material. Among these hydrogen carriers, solid-state hydride materials show attractive potentials for high gravimetric capacity, safe, efficient and compact for hydrogen carrier. 1–3) We focused on sodium borohydride (NaBH4) which is attracting attention for a regeneratable and large capacity solid-state hydrogen carrier. NaBH4 is nonflammable and stable powder solid at normal temperature and pressure. The hydrogen storage capacity is 10.8 wt%. Volumetric energy density is 7.5 MWh/m3 which is about 3 times higher than cryogenic liquid hydrogen. Moreover, NaBH4 itself is not harmful. Therefore, it is easy to move and keep as a hydrogen carrier. 4,5) However, NaBH4 takes a cost to commercialize. Fundamentally, almost all of syntheses of NaBH4 are based on converting B–O to B–H bonds which require a large amount of strong reducing agents such as metal Na of alkali metals. 6) To reduce the cost of NaBH4, it is attractive to find a procedure for recycling NaBO2 back to NaBH4. 7–11) NaBO2 is byproduct of dehydrogenation of NaBH4. In the previous research, MgH2 is required as a reducing agent to hydrogenate from NaBO2 to NaBH4. 7,8,11) In the recycling reaction, MgH2 is converted into magnesium oxides which include MgOx , Mg(OH)x and a small amount of magnesium. 10,12,13) However, MgH2 as a reducing agent also takes a production cost. MgH2 can be synthesized by chemical vapor deposition by reacting with vaporized magnesium under highly pressurized hydrogen, ball-milling process with some catalytic metals or thermodynamic equilibrium process. 14–17) The effect of addition of catalytic metals such as Pd promotes the dissociation of hydrogen molecules on the surface of magnesium. 18) In this study, we attempt to supply the dissociated hydrogen atom such as hydrogen ion (H+) and radial (H*) by using low-temperature microwave excited hydrogen plasma for hydrogenation of magnesium oxides. In the plasma processing, hydrogen ion and radical will contribute to the reduction and hydrogenation of magnesium oxides. However, the dehydrogenation as hydrogen molecules from the hydrogenated magnesium surface will occur simultaneously. Moreover, the dehydrogenation will be also dependent on the surface temperature of the hydrogenated magnesium. In the plasma treatment, the surface temperature will be affected by hydrogen ion dose which is amount of the irradiated hydrogen ion to the sample. The amount of ion dose is calculated by the product of the hydrogen ion flux Γi and treatment time t. In this experiment, the Γi was controlled using a ground metal mesh electrode. The aim of this study is to reveal the effect of the hydrogen ion dose and sample temperature in the hydrogen plasma treatment to synthesize MgH2 from magnesium oxides characterized by X-ray photoelectron spectroscopy (XPS) and Raman spectroscopy.
2. Experimental methods
An oxidized magnesium (Mg) plates (126-0207, KENIS LIMITED, Japan) was treated by a surface-wave hydrogen plasma excited by a microwave. The schematic diagram of surface-wave plasma apparatus is shown in Fig. 1. The plasma reactor consisted of a cuboid vacuum chamber (700 mm in width, 175 mm in height and 370 mm in depth) with a microwave launcher (120 mm in diameter) and 2.45 GHz microwave generator. In the surface-wave plasma discharge operation, microwaves damp exponentially below the quartz plate where the electron density generally exceeds the cutoff density. 19–21) The sample was placed on a grounded stainless steel sample holder mounted in front of a microwave launcher. The gap distance z between microwave launcher and sample was adjusted for 60, 80 and 115 mm. The microwave power, gas pressure and gas flow rate were kept constant at 500 W, 9–15 Pa and 100 sccm, respectively. The hydrogen ion dose which is amount of the irradiated hydrogen ion to the sample was controlled by Γi and t. The Γi was controlled by adjusting the sample position z from the plasma source where is quartz plate on microwave launcher and by using a ground metal mesh electrode. In the process of Γi control, the mesh electrode (SUS304, 100 lines/inch, 0.1 mm in diameter of a wire) was installed 5 mm above the sample. The schematic diagram of the effect of mesh electrode is shown in Fig. 2. The charged particles will be trapped by mesh electrode, and the electrically neutral particles, i.g. H2 and H*, can pass through the mesh by a diffusion process. 22) This means that H*/H+ ratio is higher by using mesh electrode. In this paper, the treatment with mesh electrode was defined as the mesh treatment, and the treatment without mesh electrode was defined as the direct treatment. The hydrogen ion dose was calculated by the product of t and Γi at z. The Γi was measured with a single Langmuir probe technique. 23) The tip of Langmuir probe was a tungsten wire with a length of 5 mm and a diameter of 0.6 mm. In the Langmuir probe measurement, the probe was connected to a Keithley 2400 Series SourceMeter to apply a voltage and to capture the current from the plasma. After sweeping the voltage, plasma parameters were calculated by exporting the voltage and current data array into self-made calculation program. The sample temperature during the plasma treatment was measured with a thermocouple installed on a back surface of a MgO pellet (H-10, TATEHOMAG, Japan). The sample temperature was controlled only by irradiating with hydrogen plasma. After the plasma treatment, nitrogen gas was introduced at about 103 Pa into the vacuum chamber, and samples were cooled by gas convection. The samples were preserved in a vacuum desiccator (∼6.7 × 10⁻² Pa) until analysis to prevent the air exposure effects. The chemical characterizations of samples were analyzed by X-ray photoelectron spectroscopy (XPS) and Raman spectroscopy. In the XPS (AXIS ULTRA DLD, SHIMADZU) analysis, X-ray source was monochromatic AlKα (1486.6 eV) and operated at 15 kV and 10 mA. The spectra were collected at 20 eV pass energy and 0.1 V/step energy resolution. Typical vacuum level during measurement was in the order of 10–7 Pa. The spectra were referenced to the 285.0 eV C 1 s level to eliminate the charge effect. In the Raman spectroscopy (NRS-7100, JASCO) analysis, Raman spectra were collected in the backscattering geometry at room temperature. The excitation wavelength, laser power, spectrum range, exposure time and the number of the accumulation were 532 nm, 11.3 mW, 200–1400 cm−1, 30 s and 3 times, respectively. Before the analysis of Raman spectroscopy, the system was calibrated with the Raman peak of Si at 520.45 cm−1. The surface area of MgH2 nucleus synthesized on oxidized Mg plate was determined from the results of 2D Raman mapping analysis by using ImageJ. 24) The spatial resolution of surface scanning, spectrum range, exposure time and the number of the accumulation of Raman mapping analysis were 1 μm, 924–1364 cm−1, 2 s and 2 times, respectively.
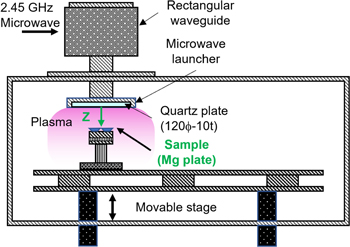
Fig. 1. (Color online) The schematic diagram of surface-wave plasma apparatus.
Download figure:
Standard image High-resolution image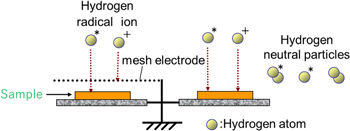
Fig. 2. (Color online) The schematic diagram of the effect of the mesh electrode.
Download figure:
Standard image High-resolution image3. Results and discussion
3.1. Characterization of plasma treatment conditions
To characterize the treatment condition of the hydrogen plasma, the Γi which is obtained from the ion saturation current density was measured with a Langmuir probe. The sample temperature T during the plasma treatment was measured with a thermocouple. Figure 3 shows the spatial distribution of the hydrogen ion saturation current density Jis compared between the direct treatment and the mesh treatment, without and with a mesh electrode, respectively. The gas pressure of hydrogen was 15 Pa. The measured Jis, which is proportional to the plasma density when the electron temperature is constant, exponentially decreased along with the z-axis perpendicular from the microwave launcher. By using mesh electrode, Jis decreased because some charged particles were trapped. In this experiment, the sample was put at z = 60, 80, 115 mm from the microwave launcher. The plasma density at z = 80 and 115 mm was a three-quarters and a half of the density at z = 60 mm, respectively.
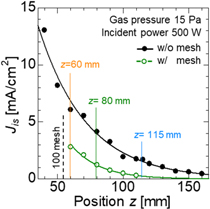
Fig. 3. (Color online) The spatial distribution of the hydrogen ion saturation current density Jis compared between the direct treatment and the mesh treatment.
Download figure:
Standard image High-resolution imageFigure 4 shows the T of Mg oxides at z = 60, 80 and 115 mm during the plasma treatment compared between the direct treatment and the mesh treatment. The T increased with t and Γi . After t = 30 min, T was almost in equilibrium. Focusing on the condition in the same t and z of the direct treatment and the mesh treatment, the T using mesh electrode was reduced by about 20 °C compared to the direct treatment. The hydrogen ion flux to the sample surface is suppressed by the mesh electrode, but neutral particles pass through the mesh electrode. Therefore, the hydrogen ion contributes to increasing T on the sample surface by the effect such as ion bombardment. Considering the results of Jis and T measurement shown in Figs. 3 and 4, the samples were treated by the plasma with the condition of hydrogen ion dose listed in Table I.

Fig. 4. (Color online) The temperature T of Mg oxides during the plasma treatment compared between the direct treatment and the mesh treatment.
Download figure:
Standard image High-resolution imageTable I. The direct and mesh treatment conditions of hydrogen ion flux Γi , hydrogen ion dose and treatment temperature T corresponding to the sample position z and the treatment time t.
| Position z [mm] | Treatment time t [min] | Hydrogen ion flux Γi [×1016 cm−2 s−1] | Hydrogen ion dose [×1019 cm−2] | Sample temperature T [°C] | |||
|---|---|---|---|---|---|---|---|
| Direct | Mesh | Direct | Mesh | Direct | Mesh | ||
| 60 | 10 | 4.2 | 1.7 | 2.5 | 1.0 | 219 | 199 |
| 20 | 5.0 | 2.1 | 250 | 232 | |||
| 30 | 7.6 | 3.1 | 258 | 240 | |||
| 80 | 10 | 2.7 | 0.8 | 1.6 | 0.5 | 177 | 153 |
| 20 | 3.2 | 0.9 | 206 | 184 | |||
| 30 | 4.9 | 1.4 | 217 | 197 | |||
| 115 | 10 | 1.1 | 0.2 | 0.7 | 0.1 | 131 | 120 |
| 20 | 1.3 | 0.2 | 155 | 141 | |||
| 30 | 2.0 | 0.3 | 162 | 149 | |||
Figure 5 shows the dependence of T at t = 30 min on the hydrogen ion flux compared between the direct treatment and the mesh treatment. The T increased with the hydrogen ion flux. In the mesh treatment, the relative amount of radical incident on the sample increases when compared with the same ion flux, and the H*/H+ ratio irradiated to the sample becomes high. Therefore, the T with the mesh treatment was higher than the direct treatment. The hydrogen radical also contributes to increasing T around 26 °C by chemical reaction such as hydrogenation and reduction. Theoretically, hydrogen radical generated by the dissociation due to inelastic collision with electrons has and carries an energy of 2.2 eV/atom. 25) The mass of plasma treated samples decreased by 0.46% on average. It is speculated that oxygen atoms in the sample surface were volatilized by reduction or replaced with hydrogen atoms.
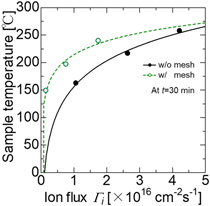
Fig. 5. (Color online) Dependence of T at t = 30 min on the hydrogen ion flux compared between the direct treatment and the mesh treatment.
Download figure:
Standard image High-resolution image3.2. Characterization of hydrogenated Mg by plasma
Figure 6 shows XPS spectra in Mg 2p region of hydrogen and Ar plasma treated Mg oxides. In the XPS analysis, the peaks of MgO, Mg(OH)2 and metal Mg, which was assigned at the binding energy of 50.25, 49.5 and 48 eV, 26–29) were considered. The surface oxidized Mg before plasma treatment was composed of amorphous Mg(OH)2 and MgO. 30–32) In the plasma treatment, the samples were placed at z = 60 mm where the Γi was 4.2 and 1.7 × 1016 cm−2 s−1 without and with mesh electrode, respectively. Hydrogen radical flux is considered to be same at the same z. As the results of hydrogen plasma treated sample compared to the untreated sample, MgO peak decreased and Mg(OH)2 or MgHx peak appeared. However, it is difficult to distinguish between Mg(OH)2 and MgHx from XPS measurements. The intensity of metal Mg peak increased with t in the hydrogen plasma treatment. Moreover, the samples were treated by not only hydrogen plasma but also Ar plasma in which chemically reactive species do not exist. In the Ar plasma treatment, the sample surface is only affected by Ar ion irradiation and bombardment. The metal Mg peak did not appear in Ar plasma treatment. This means that MgO was reduced into metal Mg by the chemically reactive species in hydrogen plasma. Furthermore, the metal Mg peak shifted to the high energy side with increasing t of the direct treatment which is higher Γi . Therefore, the peak shift of metal Mg peak was caused by hydrogen ion dose. It is speculated that this peak shift means that the electron density around the Mg atom decreases by the defective binding such as Mg–(OH)x and Mg–Hx . The Mg peak intensity of the direct treatment was higher than the mesh treatment. This means that the reduction of Mg oxides into metal Mg will progress with Γi , or the metal Mg will appear from the dehydrogenation of the MgH2 as H2 molecules by hydrogen radical or increasing T by the hydrogen ion dose. The dehydrogenated MgH2 due to increasing T is converted into Mg which is reported by Nogita et al. 33) The bulk MgH2 was dehydrogenated at about 370 °C and 0.01 Pa, while synthesized MgH2 by hydrogen plasma was dehydrogenated at about 256 °C and 0.2–0.5 Pa. 34,35) It is speculated that the reduction and oxidation will be simultaneously caused by increasing the hydrogen ion dose.

Fig. 6. (Color online) The XPS spectra in Mg 2p region of hydrogen and Ar plasma treated Mg oxides.
Download figure:
Standard image High-resolution imageTo help understanding the hydrogenated Mg such as MgH2 and Mg(OH)2 by hydrogen plasma, the samples were analyzed by Raman spectroscopy. Figure 7 shows the Raman spot characterized spectra of hydrogen plasma treated and untreated Mg oxides with each Γi . The position of spot analysis was set to where seems to be MgH2 nucleus by optical micrographs (OM) installed in the NRS-7100. The size of Raman laser spot was 1 μmf. Figure 8 shows the OM images of Raman spot position in hydrogen plasma treated samples under the treatment conditions selected from in Fig. 7(a). Kondo et al. reported the MgH2 nucleus at initial state of hydrogenation was formed as granular and scattered. 36) As shown in Fig. 7, the Mg oxides before the plasma treatment consisted of Mg(OH)x at 275 cm−1 and MgO at 595 and 1096 cm−1. 37–39) The Raman shift of Mg(OH)2 was assigned at 257 cm−1 corresponding to Raman active phonons Eg. 40) The Raman shifts of MgH2 have three peaks at 311, 953 and 1281 cm−1 corresponding to Raman active phonons B1g, Eg and A1g, respectively. 40,41) As shown in Fig. 7(a) obtained from the direct treatment for 10 min, the Mg oxides was converted into Mg(OH)x , MgHx , MgH2 and finally Mg(OH)2 with increasing Γi . At the lowest Γi treatment, which is z = 115 mm, Γi = 1.1 × 1016 cm−2 s−1 and T = 131 °C shown in Fig. 7(a), the Raman shifts of 365 and 375 cm−1, which are corresponding to MgHx and Mg(OH)x , respectively, were observed. As an increase in Γi , MgH2 peaks appeared at Γi = 2.7 × 1016 cm−2 s−1, and then MgH2 disappeared at Γi = 4.2 × 1016 cm−2 s−1. The Raman shifts of 257 and 344 cm−1, which are corresponding to Mg(OH)2 and MgHx , respectively, were observed at the highest Γi = 4.2 × 1016 cm−2 s−1 and T = 219 °C. Interestingly, the peak at 365 or 344 cm−1 which are correspond to MgHx appeared with increasing Γi . It is speculated that MgHx at 365 cm−1 observed at Γi = 1.1 × 1016 cm−2 s−1 is formed from an intermediate such as Mg(OH)x by hydrogen plasma, and MgHx at 344 cm−1 observed at Γi = 4.2 × 1016 cm−2 s−1 is formed as a defected MgH2. Matović et al. reported the Raman shift of 344 cm−1 is related to interaction with independent point defects of MgH2 by Ar ion dose which causes the ion bombardment to MgH2. 37) It is speculated that MgH2 is dehydrogenated into Mg(OH)2 and MgHx at 344 cm−1 with increasing T due to Γi . Mg(OH)2 at 257 cm−1 will be generated by the reaction of reactive surface such as defect created by the ion bombardment with moisture in the air or by-products such as H2O produced from the reduction of Mg oxides. In addition, the structure of plasma treated sample did not change in any sample after about 48 h of air exposure.

Fig. 7. (Color online) The Raman spectra of hydrogen plasma treated and untreated Mg oxides with each hydrogen ion flux Γi at the sample position z. Figures 7(a) and (b) show the direct treatment of t = 10 min and 30 min. Figures 7(c) and (d) show the mesh treatment of t = 10 and 30 min.
Download figure:
Standard image High-resolution image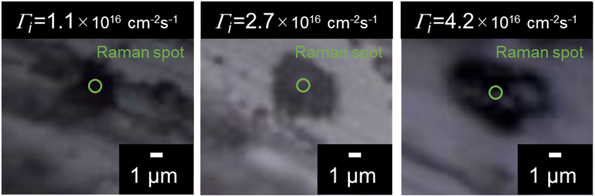
Fig. 8. (Color online) The optical micrographs of Raman spot characterization position in hydrogen plasma treated samples under the treatment conditions selected from Fig. 7(a) (Fig. 8(a) z = 115 mm, Fig. 8(b) z = 80 mm, Fig. 8(c) z = 60 mm).
Download figure:
Standard image High-resolution imageAs shown in Fig. 7(b) obtained from the direct treatment for 30 min, the Mg oxides was converted into MgH2 and finally MgHx and Mg(OH)2 with increasing Γi . As an increase in t from 10 min to 30 min shown in Figs. 7(a) to 7(b), Mg(OH)x and MgHx at 365 cm−1 were converted into MgH2 at the lowest Γi = 1.1 × 1016 cm−2 s−1, and MgH2 was converted into Mg(OH)2 and MgHx at Γi = 2.7 × 1016 cm−2 s−1. Therefore, the hydrogen ion dose affects the hydrogenation into MgH2 from Mg oxides and also the dehydrogenation into Mg(OH)2 and MgHx from MgH2. Figures 7(c) and 7(d) show the Raman spectra of the mesh treatment for 10 and 30 min, respectively. As shown in Fig. 7(c) obtained from the mesh treatment for 10 min, the Mg oxides was converted into Mg(OH)x , MgHx and MgH2 with increasing Γi . At the highest hydrogen ion flux treatment with Γi = 1.7 × 1016 cm−2 s−1, MgH2 peaks was still observed and more clearly than the treatment with Γi = 0.8 × 1016 cm−2 s−1. As discussed in Figs. 7(a) and 7(b), it is speculated that the dehydrogenation of MgH2 is not only reduction by hydrogen ions but also an increase in T. However, T also increases with the hydrogen radical in the discussion of Fig. 5. In the plasma treatment with same Γi between the direct treatment and the mesh treatment in Figs. 7(a) and 7(c), the hydrogen radical flux of the mesh treatment is relatively higher than the direct treatment. The Mg(OH)x and MgHx at Γi = 1.1 × 1016 cm−2 s−1 in Fig. 7(a) were converted into MgH2 at Γi = 0.8 × 1016 cm−2 s−1 in Fig. 7(c). Therefore, it is speculated that hydrogen radical also affects the hydrogenation of Mg oxides. As shown in Fig. 7(d) obtained from the mesh treatment for 30 min, the Mg oxides was converted into MgH2 and Mg(OH)2 with increasing Γi . This tendency was similar to the result for 10 min shown in Fig. 7(a). Compared to the treatment in the same hydrogen radical flux at z = 115 mm in Figs. 7(b) and 7(d), the MgH2 peaks of the direct treatment in Fig. 7(b) was more clearly. It means that MgH2 nucleus becomes high density by the higher ion flux treatment.
Figure 9 shows the condition map of plasma treated samples at z and t axis with isolines of T and the hydrogen ion dose Γi t by the direct and the mesh treatment. The experimental conditions in which Raman peaks (311, 953 and 1281 cm−1) corresponding to MgH2 are observed by the same measurement method as Fig. 7 are plotted as blue squares. The gray squares indicate the experimental conditions in which Mg(OH)x was observed at 257 cm−1 or 275 cm−1 in Raman spectroscopy. MgH2 nucleus at initial state of hydrogenation appeared under the experimental conditions with Γi t range of 1.3–3.2 × 1019 cm−2 and 0.2–2.1 × 1019 cm−2 for the direct and the mesh treatment, respectively. Excessive ion and radical irradiation cause the increase in sample temperature and accelerates the dehydrogenation of MgH2. MgH2 was not observed when the sample temperature was higher than about 200 °C. The minimum temperature for producing MgH2 is also important conditions. In this experiment, the minimum temperature required to produce MgH2 was about 150 °C. Therefore, the hydrogenation was caused by the synergistic effect of T and ion does, and which are expected to be optimized.
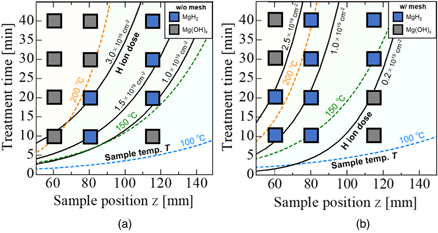
Fig. 9. (Color online) The condition map of plasma treated samples in the sample position z and treatment time t axis with isolines of sample temperature T and the hydrogen ion dose by (a) direct treatment and (b) mesh treatment.
Download figure:
Standard image High-resolution imageFigure 10 shows the 2D Raman mapping characterization in growth of the hydrogenated Mg nucleus by hydrogen plasma treatment at z = 80 mm. The spatial resolution of the Raman mapping analysis was 1 μm. The scanned area in Fig. 10(b) was 100 μm2, and others were 49 μm2 which were optimized in the range of 36–100 μm2 for the size of synthesized MgH2 nuclei which position were searched by OM images. In the mapping measurements, the peak intensity of MgH2 at a Raman shift of 953 cm−1 was divided into mapping colors with a maximum peak intensity of red and a minimum intensity of black. The maximum peak intensity depended on the plasma treatment condition and the relative value of the maximum peak intensity is indicated above the scale bar. Considering the S/N ratio in the measurement, the MgH2 nucleus area was identified as yellow and higher color part in the mapping measurement image. As shown in Fig. 10, MgH2 nucleus area was expanded with Γi t. The largest MgH2 nucleus area in all treatment conditions was obtained at z = 80, t = 20 min and Γi t = 3.2 × 1019 cm−2 of the direct treatment shown in Fig. 10(b). The largest MgH2 nucleus area on the oxidized Mg surface was 14.9 μm2 estimated from the image analysis by using ImageJ. 24)

Fig. 10. (Color online) The 2D Raman mapping characterization of the hydrogenated Mg by hydrogen plasma treatment at z = 80 mm. Figure 10(a) shows the direct treatment of t = 10 min. Figure 10(b) shows the direct treatment of t = 30 min. Figure 10(c) shows the mesh treatment of t = 10 min. Figure 10(d) shows the mesh treatment of t = 30 min.
Download figure:
Standard image High-resolution imageFigure 11 shows the relationship between the MgH2 nucleus area on the oxidized Mg surface and the hydrogen ion dose. The MgH2 nuclei were observed around 150 °C–200 °C. The MgH2 nucleus area increased with increase in hydrogen ion dose in the direct and the mesh treatment. The straight line in Fig. 11 is obtained by the least squares method of the direct treatment plot, which means that the area of the nucleus is proportional to the hydrogen ion dose. The growth rate of MgH2 nucleus will correlate with hydrogen ion dose. It is speculated that the MgH2 nucleus area on the oxidized Mg surface was expanded by hydrogen ion dose to the Mg which reduced by the hydrogen plasma. Pranevicius et al. reported that the MgH2 conversion under low-temperature condition from Mg requires the hydrogen diffusion into the bulk with not only high hydrogen ion flux irradiation but also thermal diffusion process. 42) The problem of the MgH2 nucleus growth from Mg is a low hydrogen diffusivity in MgH2. 36,43) The hydrogen transport processes at grain boundaries, such as sample surface defects, are activated under high hydrogen ion flux irradiation. 42,44) As a result of XPS analysis shown in Fig. 6, Mg oxides were reduced by hydrogen plasma with increasing the hydrogen ion dose. Hydrogen is transported by the defects which is formed by the high hydrogen ion dose to the reduced Mg oxides. Interestingly, the MgH2 nucleus area of the mesh treatment which is higher H*/H+ ratio was larger than that of the direct treatment in the lower hydrogen ion dose range under ∼2 × 1019 cm−2. MgH2 nuclei were synthesized in the range of Γi t and T shown in Fig. 9. As shown in Figs. 4 and 5, both of hydrogen ion and radical contribute to increasing T. Therefore, in this low hydrogen ion dose range, thermal dehydrogenation will be avoided, and growth of MgH2 nuclei by hydrogen ion or radical will be observed. It is speculated that the hydrogen radical is also contributed to the nucleation and growth of MgH2 by diffusing at grain boundaries along with hydrogen ion. MgH2 nuclei were synthesized in the range of Γi t and T shown in Fig. 9.

Fig. 11. (Color online) The relationship between the MgH2 area on the oxidized Mg surface and the hydrogen ion dose.
Download figure:
Standard image High-resolution image
4. Conclusions
The Mg oxides were hydrogenated into MgH2, and the effect of the hydrogen ion dose and T were investigated by XPS and Raman spectroscopy analysis. The hydrogen ion dose was controlled by the Γi and t. The hydrogen ion flux was also controlled by using a ground metal mesh electrode and the sample position z which is the distance from the microwave launcher. The effects of a ground metal mesh electrode are to suppress the ion flux and allow neutral particles to pass the mesh electrode. The synthesized MgH2 nucleus at initial state of hydrogenation appeared under the experimental conditions with Γi t range of 1.3–3.2 × 1019 cm−2 and 0.2–2.1 × 1019 cm−2 for the direct and the mesh plasma treatment, respectively. Excessive ion and radical irradiation cause the increase in sample temperature and accelerates the dehydrogenation of MgH2 into Mg(OH)2 and MgHx . MgH2 was not observed when the sample temperature was higher than about 200 °C and lower than about 150 °C. In the Γi t range of the synthesized MgH2, the MgH2 nucleus area increased with increase in Γi t. Interestingly, the MgH2 nucleus area of the mesh plasma treatment was larger than that of the direct treatment in the lower hydrogen ion dose range under ∼2 × 1019 cm−2. It is speculated that the nucleation of MgH2 is mainly affected by hydrogen ion, and growth of nucleated MgH2 is mainly affected by the hydrogen radical. Eventually, a large MgH2 is expected to be synthesized on the surface of the Mg oxides by suppressing the T and increasing the hydrogen ion and radical dose.