
Abstract
For the clinical application of high-intensity focused ultrasound (HIFU), improvement in monitoring and guidance methods is necessary to enhance the treatment accuracy. Among the ultrasonic imaging techniques, thermal strain imaging has a potential to estimate temperature change based on the linear relationship between the thermally induced strain and temperature change via a tissue-dependent coefficient. In this study, the coefficient was experimentally measured and the temperature rise induced by the HIFU irradiation was estimated based on the measured coefficient in a tissue mimicking material phantom. The temperature rise estimated using the measured coefficient and that simulated based on a bioheat transfer equation showed a good agreement when the spatial averaged effect in the elevational direction was considered. The exponential decay time constants also agreed well within the range of measurement.
Export citation and abstract BibTeX RIS
1. Introduction
High-intensity focused ultrasound (HIFU) is a minimally invasive modality for cancer treatment, in which ultrasound generated outside a body is focused on a target tumor. In the focal region, localized temperature rise of 20 °C–60 °C leads the target tissue to coagulative necrosis. 1–4) HIFU treatment has a great advantage in that it does not require a surgical incision, but the treatment region cannot be seen with the naked eye in return. 5,6) In order to ensure the treatment safety and efficacy, it is required to estimate the temperature rise in situ, and confirm whether the desired temperature rise is achieved in the target tumor and the intervening and surrounding tissues are not damaged unintentionally.
In clinical cases, magnetic resonance imaging (MRI) based on the temperature dependence of magnetic resonance frequency shift has been widely used for a noninvasive three-dimensional thermometry. 7,8) The major drawback of MR thermometry is lack of real-time capability with its temporal resolution of 0.3 fps, 9) which makes it difficult to instantly cope with the unexpected troubles. In contrast, an ultrasound-guided HIFU system has been developed with relatively high-speed ultrasonic imaging technology using unfocused transmission such as plane and diverging waves. 10,11) The technology makes it possible to capture the phenomena in the order of milliseconds such as shear wave propagation and cavitation bubbles, 12,13) which are useful information for HIFU treatment.
Thermal strain (TS) imaging has been proposed as one of the ultrasound applications to predict a temperature change in a noninvasive manner.
14–18) In a HIFU treatment, a temperature rise causes the time shift of radio-frequency (RF) signals due to thermal expansion and change in the sound speed of tissue. The gradient of the time shift multiplied by the speed of sound is called thermal strain, and is proportional to the temperature change via a tissue-dependent coefficient of 
The objective of this paper is to investigate a quantitative validity of temperature rise estimated by TS imaging. We preliminarily reported a relation between estimated temperature rise using a literature value of  and simulated temperature rise.
19) In this paper, the tissue-dependent coefficient was measured through experiments heating a phantom, and the temperature rise was estimated using the measured value of
and simulated temperature rise.
19) In this paper, the tissue-dependent coefficient was measured through experiments heating a phantom, and the temperature rise was estimated using the measured value of  Numerical simulation of temperature based on a biological heat transfer equation was also performed using the experimentally determined absorption coefficient. The quantitative validity of the temperature rise estimated from measurement was examined by comparing with the results from the temperature simulation. As shown in Fig. 1, the content includes three experiments and a simulation.

Fig. 1. (Color online) Outline of the study.
Download figure:
Standard image High-resolution image2. Materials and methods
2.1. Thermal strain (TS) imaging
The temperature rise induced by HIFU irradiation results in temporal shifts of RF-echo signals. The temporal shift originates from two physical phenomena: thermal expansion of the propagation medium and local change in its speed of sound, which correspond to a physical and apparent shift, respectively. The temperature change  is expressed with a linear coefficient of the thermal expansion
  and that of the temperature dependence of sound speed
  as
as

where  is the speed of sound at the initial temperature,
  is a time-shift on the echo at a depth z. The model can be applied to a limited temperature change within a range where the temperature dependence of sound speed is approximated to be linear. In addition, the coefficient
  and
and  were assumed to be constant with respect to depth z in a uniform tissue. The typical value of
  ranges from
  to
to  for water bearing tissue around body temperature, and is at least an order of magnitude larger than the coefficient of thermal expansion.
20–22) All experiments used a tissue mimicking material (TMM) phantom produced based on the IEC60601-2-37, whose mass fractions and acoustic parameters are shown in Tables I and II. As for the TMM phantom, the coefficient
for water bearing tissue around body temperature, and is at least an order of magnitude larger than the coefficient of thermal expansion.
20–22) All experiments used a tissue mimicking material (TMM) phantom produced based on the IEC60601-2-37, whose mass fractions and acoustic parameters are shown in Tables I and II. As for the TMM phantom, the coefficient  is assumed to be
  in the temperature range of 23 °C–37 °C, calculated from the temperature coefficient of 2.1 m s−1 K−1 as reported on the acoustic properties of an IEC agar-based TMM phantom.
23) The coefficient
in the temperature range of 23 °C–37 °C, calculated from the temperature coefficient of 2.1 m s−1 K−1 as reported on the acoustic properties of an IEC agar-based TMM phantom.
23) The coefficient  is regarded as
  as an approximation of water
24) considering that 83% of the phantom is composed of water
as an approximation of water
24) considering that 83% of the phantom is composed of water ![$\left[\alpha \left(z\right)=0.084\times {10}^{-3}\,{{\rm{K}}}^{-1}\right]$](https://content.cld.iop.org/journals/1347-4065/61/SG/SG1062/revision2/jjapac5d15ieqn18.gif) 25) and 11% of glycerol [
25) and 11% of glycerol [ ]
25) as shown in Table I.
]
25) as shown in Table I.
Table I. Mass fractions of the TMM phantom.
| Component | Mass fraction (%) |
|---|---|
| Purified water | 82.95 |
| Glycerol | 11.21 |
| Agar | 3.02 |
| Aluminum oxide (3 μm) | 0.94 |
| Aluminum oxide (0.3 μm) | 0.88 |
| Silicon carbide | 0.53 |
| Benzalkonium chloride | 0.47 |
Table II. Acoustic properties of TMM phantom (Nominal value).
| Parameter | Value | |
|---|---|---|
| Speed of sound | (m s−1) | 1540 |
| Thermal conductivity | (W/m/K) | 0.58 |
| Specific heat capacity | (J/kg/K) | 3800 |
| Specific gravity | — | 1.050 |
| Attenuation coefficient | (dB/m/MHz) | 50 |
2.2. Calibration of the tissue-dependent coefficient
Figure 2 shows the experimental setup for the measurement of the tissue-dependent coefficient  of the phantom. A rectangular (outer dimensions of 95 mm × 55 mm × 20 mm) phantom (OST TMM3S-125) was fixed in an acrylic tank filled with water. It was filled in a polyethylene film bag with zipper to prevent leaching of glycerol during a prolonged experiment. The temperature inside the phantom was varied at six different steps from approximately 20 °C–41 °C by heating the water in the tank with a throw type heater and stirring the heated water. At each temperature step, ultrasound imaging was performed when the temperature of the water measured by a thermometer (HORIBA OM-51) and that of inside the phantom measured by a thermocouple (CHINO SCHS1-0) almost coincided. The thermocouple was connected to a data logger (GRAPHTEC midi LOGGER GL900) and recorded at a sampling frequency of 500 Hz. For strain measurement, a phased array imaging probe (Hitachi Aloka Medical UST-52105, driven at a center frequency of 3.47 MHz) was placed 49 mm above the phantom surface and connected to a programmable ultrasound imaging system (Verasonics Vantage 256). RF data were acquired with 10 plane waves steered at angles ranged from −6° to 6° at a sampling frequency of 13.89 MHz. Ten consecutive in-phase/quadrature (IQ) data were spatially compounded in constructing as a frame. By applying a 2D autocorrelation method between the reference and each post-heating frame, five displacement maps were obtained from the phase difference at the center frequency determined based on the frequency spectrum of the IQ data.
26,27) The parameter setting used for 2D autocorrelation is shown in Table III. The axial slope of the displacement was divided by the temperature rise measured by the thermocouple to calculate the tissue dependence coefficient
of the phantom. A rectangular (outer dimensions of 95 mm × 55 mm × 20 mm) phantom (OST TMM3S-125) was fixed in an acrylic tank filled with water. It was filled in a polyethylene film bag with zipper to prevent leaching of glycerol during a prolonged experiment. The temperature inside the phantom was varied at six different steps from approximately 20 °C–41 °C by heating the water in the tank with a throw type heater and stirring the heated water. At each temperature step, ultrasound imaging was performed when the temperature of the water measured by a thermometer (HORIBA OM-51) and that of inside the phantom measured by a thermocouple (CHINO SCHS1-0) almost coincided. The thermocouple was connected to a data logger (GRAPHTEC midi LOGGER GL900) and recorded at a sampling frequency of 500 Hz. For strain measurement, a phased array imaging probe (Hitachi Aloka Medical UST-52105, driven at a center frequency of 3.47 MHz) was placed 49 mm above the phantom surface and connected to a programmable ultrasound imaging system (Verasonics Vantage 256). RF data were acquired with 10 plane waves steered at angles ranged from −6° to 6° at a sampling frequency of 13.89 MHz. Ten consecutive in-phase/quadrature (IQ) data were spatially compounded in constructing as a frame. By applying a 2D autocorrelation method between the reference and each post-heating frame, five displacement maps were obtained from the phase difference at the center frequency determined based on the frequency spectrum of the IQ data.
26,27) The parameter setting used for 2D autocorrelation is shown in Table III. The axial slope of the displacement was divided by the temperature rise measured by the thermocouple to calculate the tissue dependence coefficient 
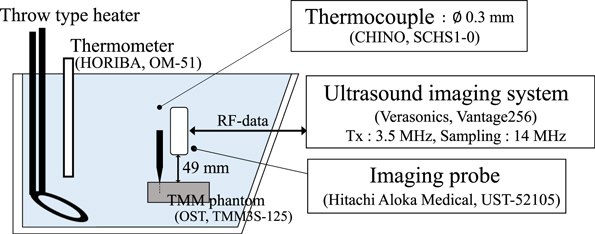
Fig. 2. (Color online) Schematic of the experimental setup on the calibration of the tissue-dependent coefficient.
Download figure:
Standard image High-resolution imageTable III. Parameter setting of 2D autocorrelation method.
| Lateral window size | Lateral search region | Axial window size | Axial search region | |
|---|---|---|---|---|
| Exp. 2.2 | 2.2 mm | ±0.87 mm | 2.0 mm | ±2.4 mm |
| Exp. 2.3 | 1.3 mm | ±0.43 mm | 3.7 mm | ±0.43 mm |
2.3. Estimation of temperature rise induced by HIFU irradiation
The temperature rise induced by HIFU irradiation was estimated using the measured values of  As shown in the Fig. 3, experiments were performed in an acrylic tank containing degassed and deionized water (saturation concentration of dissolved oxygen of 20%–30%) at room temperature. A cylindrical (57 mm in diameter and 70 mm in height) phantom (OST TMM3S-0150D) was placed to contain the HIFU focal spot. The mass fractions and acoustic properties of the phantom are the same as those of the TMM3S-125 model described above. On the side wall of the tank, a 256-element two-dimensional-array HIFU transducer (120 mm in focal length and 120 mm in outer diameter) was installed, connected to a 128-channel staircase voltage driving system (Microsonic HIFU EU9144-2), and driven at a frequency of 1 MHz. In the central hole of the HIFU transducer, a phased array imaging probe (Hitachi Aloka Medical UST-52105) was fixed and controlled by a programmable ultrasound imaging system (Verasonics Vantage 256) to drive at a center frequency of 3.47 MHz and acquire RF echo signals.

Fig. 3. (Color online) Schematic of the experimental setup on the temperature change estimation induced by HIFU irradiation.
Download figure:
Standard image High-resolution imageFigure 4 shows the sequence of HIFU exposure and RF data acquisition in this experiment.
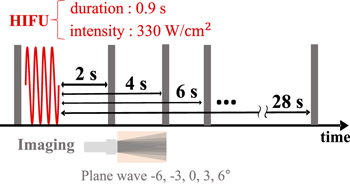
Fig. 4. (Color online) Ultrasonic exposure sequence of the temperature change estimation induced by HIFU irradiation.
Download figure:
Standard image High-resolution imagePrior to inducing the temperature rise, reference RF data were acquired with 5 plane waves steered at angles of −6°, −3°, 0°, 3°, and 6° at a sampling frequency of 13.89 MHz. After that, HIFU was irradiated to induce temperature rise of several degrees in Celsius, with a constant duration of 0.9 s at an intensity of 330 W cm−2. To obtain frames to be compared, RF data were collected from 2 to 28 s after the end of HIFU irradiation. The consecutive IQ data at five angles were acquired and compounded to construct a frame. The displacement distributions were calculated in the same way as described in Sect. 2.2 with parameter setting shown in Table III. 26,27) As shown in Fig. 5, each displacement map was spatially differentiated along the axial direction, and smoothed using a 1D Savitzky–Golay and a 2D Gaussian filter.

Fig. 5. (Color online) Procedure for calculating thermal strain distribution.
Download figure:
Standard image High-resolution image2.4. Determination of the absorption coefficient
In order to estimate the absorption coefficient of the phantom, the temperature rise induced by HIFU irradiation was directly measured with a thermocouple. The experiment was performed in the experimental setup described in Fig. 6. A thermocouple with a diameter of 0.3 mm was inserted at the point where the temperature rise with HIFU duration of 0.9 s was maximum. The temperature measured by the thermocouple was recorded at a sampling frequency of 500 Hz through the data logger. A low-pass filter with a cutoff frequency of 5 Hz was applied to reduce the noise. The method used for data analysis is explained in the next subsection.
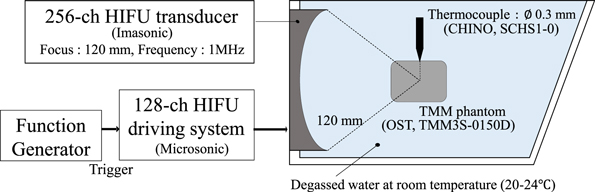
Fig. 6. (Color online) Schematic of the experimental setup on the determination of the absorption coefficient.
Download figure:
Standard image High-resolution image2.5. Compensation of the viscous heating artifact
With regard to the measurement of temperature rise shown in Fig. 6, a tip of thermocouple was placed in an ultrasound field, so the artifact associated with viscous heating was no longer negligible, which occurred at an interface between a thermocouple and the surrounding tissue by the relative motion between them. 28) The time constant of thermal diffusion of viscous heating is known to be much shorter than that of heating due to ultrasonic absorption of tissue, and the contribution of the latter to the temperature rise becomes dominant certain time after the HIFU irradiation. In order to separate the temperature rise into the ultrasonic absorption and viscous heating components, the measured temperature rises were fitted by using the least-squares method. 29,30) The fitting model of temperature rises were simulated by HITU simulator, where a wide-angle Khokhlov–Zabolotkaya–Kuznetsov and bioheat transfer equations are solved for the pressure and temperature distribution, respectively. 31) The computational domain was divided into three layers along the depth, and the phantom (Material 2) was assumed to be sandwiched between two water domains (Materials 1 and 3) with parameter settings as shown in Table IV. The fraction of attenuation due to absorption in water was set to be 0 to neglect the heat generation in water. For a viscous heating model, a minute heat source of cylinder with 0.2 mm in diameter and 0.2 mm in height was assumed at the position of the thermocouple. The percentage of absorption in attenuation in the TMM phantom, which is shown in material 2 in Table IV was varied so that the standard deviation in four results with HIFU durations of 0.2, 0.4, 0.6, and 0.9 s should be the smallest.
Table IV. Parameter setting of HITU simulator.
| Parameter | Material 1 | Material 2 | Material 3 | |
|---|---|---|---|---|
| Sound speed | (m s−1) | 1520 | 1540 | 1520 |
| Mass density | (kg m−3) | 1000 | 1050 | 1000 |
| Attenuation coefficient | (dB/m/MHz) | 0.217 | 50 | 0.217 |
| Fraction due to absorption | — | 0 | varied | 0 |
| Exponent of attenuation power law | — | 2 | 1 | 2 |
| Nonlinear parameter | — | 3.5 | 4.5 | 3.5 |
| Heat capacity | (J/kg/K) | 4180 | 3800 | 4180 |
| Thermal conductivity | (W/m/K) | 0.55 | 0.58 | 0.55 |
| Perfusion rate | (kg/m3/s) | 0 | 0 | 0 |
3. Results
3.1. Calibration of the tissue-dependent coefficient
Figures 7(a)–7(e) show displacement distribution maps with five different temperature conditions. The temperature rise  = 3.9 °C, 9.2 °C, 12.3 °C, 17.5 °C, and 21.5 °C from left to right. In the displacement maps, the imaging ultrasound was irradiated downward, and positive displacement indicates the upward shift. The slope of the displacement was calculated for each line in the depth direction for a portion of the depth as shown in Figs. 7(f)–7(j), and averaged value was taken as the thermal strain at the temperature rise. Figure 8 shows the measured thermal strain as a function of temperature rise inside the phantom for three different samples. A red line represents a linear approximation passing through zero. According to the slope of the fitting line, the averaged tissue-dependent coefficient was estimated as
  within the range of measurement, which was close to the literature values of
  (water) and
  K−1 (TMM phantom).

Fig. 7. (Color online) Set of (a) displacement distributions and (b) corresponding thermal strain plots of five different temperature rise.
Download figure:
Standard image High-resolution image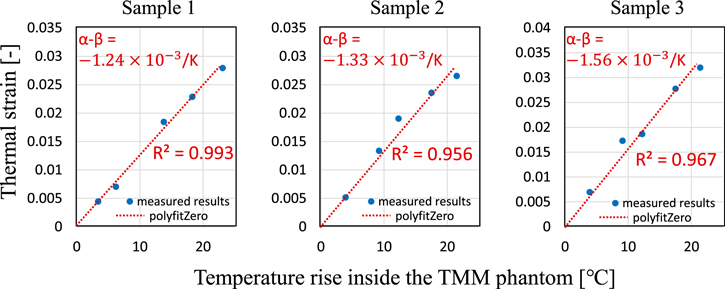
Fig. 8. (Color online) Averaged thermal strain as a function of temperature rise inside the TMM phantom.
Download figure:
Standard image High-resolution image3.2. Determination of the absorption coefficient
Figure 9 shows the temperature rise measured by the thermocouple with HIFU durations of 0.2, 0.4, 0.6, and 0.9 s (n = 3). The red dash and black solid lines represent the measured temperature rise and the fitting result of the simulation, respectively. The green and blue solid lines show the temperature rise components from ultrasonic absorption and viscous heating, respectively, the sum of which gives the fitting result. From the result that the fraction of absorption in attenuation was 0.9 with the smallest standard deviation of the coefficient, the absorption coefficient of the TMM phantom was estimated to be 0.45 dB cm−1 MHz−1 in this experiment. The standard deviation of the coefficient was 7.9% for four HIFU durations. The subsequent simulations of temperature rise were conducted using the absorption coefficient of 0.45 dB cm−1 MHz−1.
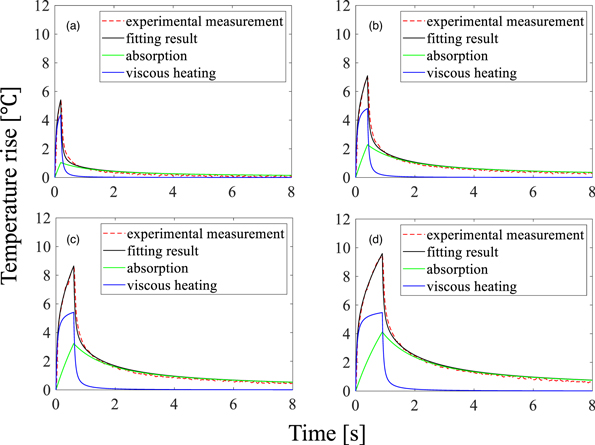
Fig. 9. (Color online) Temperature changes measured by thermocouple and fitting results with a HIFU duration of (a) 0.2, (b) 0.4, (c) 0.6 and (d) 0.9 s (n = 3).
Download figure:
Standard image High-resolution image3.3. Estimation of the temperature rise induced by HIFU irradiation
Figure 10(a) shows a set of displacement distribution maps acquired at 2–28 s after the end of HIFU irradiation, and Fig. 10(b) shows corresponding cross-correlation maps. The displacement at and below the focal point has positive value, which means that the tissue in the region was displaced upward. As shown in Fig. 10(b), the correlation was lower at and behind the heated region. Although the correlation is the lowest at 2 s from the end of HIFU irradiation, it is improved to more than 0.995 at 28 s from the end of HIFU irradiation. Figure 10(c) shows a set of thermal strain maps acquired at 2–28 s after the end of HIFU irradiation. The position with a maximum absolute value of thermal strain agreed well with the geometric focal depth of 70 mm in the images. Moreover, it is observed that the thermal strain distribution slightly expanded to the front and lateral regions with lapse of time due to the thermal conduction.
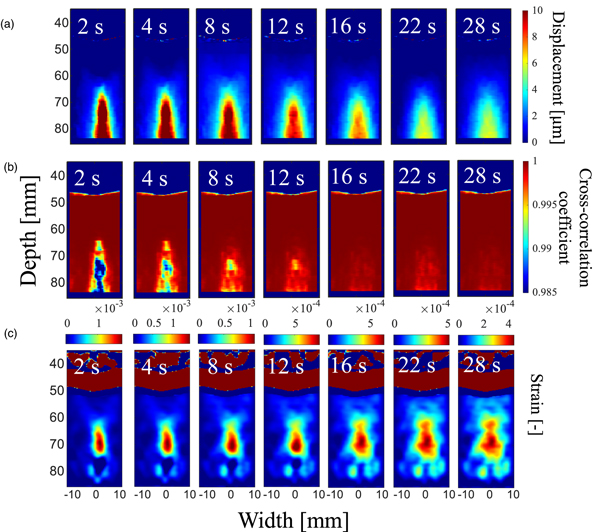
Fig. 10. (Color online) Sets of (a) displacement, (b) correlation coefficient, and (c) thermal strain distributions after 2–28 s from the end of HIFU irradiation.
Download figure:
Standard image High-resolution imageIn order to quantitatively evaluate the temperature rise induced by HIFU irradiation, the temperature rise was obtained from the measured thermal strain using the measured value of  into Eq. (1). Figure 11 shows a comparison between the estimated and simulated temperature rises over time from the end of HIFU irradiation. The estimated temperature rise (n = 9) was averaged in ROI (Lateral: −3.4–6.4 mm, Axial: 65–70 mm), and simulated temperature rise was also averaged in the corresponding ROI. The black solid line represents the estimated temperature rise with measured value of
  The error bars show the standard deviation. As for simulation results, the red solid line shows the temperature rise averaged in the same ROI for the estimation, and the blue solid line shows the temperature rise considering the point spread function (PSF) in the elevational direction. As shown in Fig. 12, the simulated temperature was convoluted with the PSF in the elevational width of 3.5 mm, which is close to the full width half maximum of the elevational PSF. The estimated temperature rise based on the measured value of
  shows good agreement with the simulated temperature rise. The agreement was even better when the spatially averaged effect owing to the size of PSF was considered.

Fig. 11. (Color online) Estimated (black line) and simulated (red and blue line) temperature rise as a function of elapsed time.
Download figure:
Standard image High-resolution image
Fig. 12. (Color online) Consideration of spatial averaged effect in elevational direction for simulated temperature rise.
Download figure:
Standard image High-resolution image
4. Discussion
The tissue-dependent coefficient was estimated in the range of −(1.56–1.24)  for three different samples. The average value was slightly larger than the literature value of
  The difference from the literature value may be attributed to the measurement error of the displacement distribution and the variation of the mass fractions of each sample. The effect of the variability in the three samples on the estimated temperature change was about ±13%.
In the following experiment, the temperature rise generated by HIFU irradiation was estimated. As shown in Fig. 11, the temperature rise estimated from the measured coefficient of  and that simulated by considering the spatial averaging effect in elevational direction show a similar trend of exponential decrease, and the time constants well agreed within the range of measurement. This means that the measured temperature rise distribution was underestimated owing to the spatially averaged effect of the imaging PSF. In addition, the contribution of the spatial averaging effect became less dominant after the lapse of sufficient time because the temperature distribution was broadened due to heat conduction. Though yet, further study is needed to determine what extent the averaging effect of thermal strain distribution is required to be taken into account. If these are clarified, a deconvolution processing of the images may achieve more accurate temperature estimation, even with a sharp temperature distribution. It should be noted that the 3D heat conduction equation was solved in the temperature simulation, but the thermal strain was calculated based on the ultrasonically observed displacement only in the beam axis direction, and the thermal expansion in the other directions was not captured. However, the effect of the thermal expansion coefficient is less dominant on the thermal strain in the TMM phantom, and the contribution of thermal expansion to the quantitative discrepancy between the experimental and simulation results is considered to be small.
5. Conclusions
In this paper, the ultrasonic estimation of the temperature rise induced by HIFU irradiation was quantitatively evaluated through comparison with simulated temperature rise. The tissue-dependent coefficient of the TMM phantom was experimentally determined as  as the average value of three samples, which is slightly larger than the literature value. In the following experiment, we estimated the temperature rises from the end of HIFU irradiation by applying the TS imaging. The result demonstrates that the estimated temperature rise averaged in ROI using the measured value of
  shows good agreement with the simulated temperature rise in consideration of the spatial averaged effect in the elevational direction.
Acknowledgments
This work was partially supported by a Grant-in-Aid for Scientific Research (No. 20H04555) from the Japan Society for the Promotion of Science.