
Abstract
Scanning acoustic microscopy (SAM) is a useful observational tool in cellular study as non-invasive living observation is feasible, unlike in conventional optical microscopy. In a previous study, cell morphological changes were successfully visualized using acoustic impedance measurements. These acoustic impedance changes correspond to cell elasticity, mainly reflecting changes in the cytoskeleton. In this study, we evaluate the elastic changes in murine breast cancer cell C127I during mitosis. C127I cells were cultured to ∼75% confluency before measurement, using a transducer with a central frequency of 320 MHz. Dynamic changes during mitosis were successfully mapped using SAM and confirmed by laser confocal microscopy. Cells in prometaphase, anaphase, and telophase, which could previously only be confirmed through immunostaining, were successfully visualized using SAM. This suggests that SAM is capable of distinguishing cells in different mitotic phases based on the changes in acoustic impedance.
Export citation and abstract BibTeX RIS

Content from this work may be used under the terms of the Creative Commons Attribution 4.0 license. Any further distribution of this work must maintain attribution to the author(s) and the title of the work, journal citation and DOI.
1. Introduction
Breast cancer is one of the most common causes of cancer death in females. Although current approaches to treating breast cancer are improving, the mortality rate and number of confirmed diagnoses are increasing year on year, making it one of the most prevalent cancers other than colorectal cancer. 1) In addition, there is a delay in both the detection and treatment of breast cancer in developing countries. 2) This means that more and more females are diagnosed and have to live with breast cancer. Furthermore, cancer treatments are usually burdensome and stressful, greatly affecting the quality of life of patients. Therefore, developing a better pathological diagnosis tool could be useful in enhancing the precision and accuracy of treatment.
Our study proposes scanning acoustic microscopy (SAM) as an effective tool to study murine breast cancer cells during the mitotic phase. SAM has several advantages in cellular study. First, living observation is feasible as the acoustic wave generated from the transducer in order to map the cells is non-invasive. 3–13) Next, the dynamics of cellular morphology correspond with the cell elasticity and could give us new insight into the changes in cellular mechanical properties which are often overlooked. 6,9–11,13,14) These benefits are unattainable with current techniques for studying breast cancer, which often involve invasive methods such as biopsy.
As the cell cycle progresses, the growing cell goes into mitosis for cell division. This is a phenomenon known as cell proliferation. One of the hallmarks of cancer cells is high proliferation rate, making it the main target of most cancer studies. 15) Hence, understanding the cell morphology behind this phenomenon is vital as it is easily overlooked because most studies focus on molecular biological and genetic alterations.
The aim of this study is to evaluate the elastic changes of murine breast cancer cells during the mitotic phase using SAM. The most common cancer therapy is chemoradiotherapy before surgical removal. The drugs used will arrest the cancer cells in the mitotic phase as the cells are more sensitive to the treatment from both the drugs and radiation, and hence enhance the success rates in surgery and patients' survival chances. However, less is known about the morphological alteration of cancer cells during this stage. Therefore, mapping the morphological changes and understanding these changes may help us in the development of a better diagnosis tool to identify cancer and tumorous cells.
2. Experimental methods
2.1. Breast cancer cell culture
Immortalized C127I cell line (EC90060504-F0), which is an epithelial tumor cell line derived from murine mammary tumor, was purchased (DS Pharma Biomedical Co. Ltd., Japan). The cell was seeded on a polystyrene (PS) film dish (Honda Electronics Co. Ltd., Japan) as described previously. 6,9,10,13) Briefly, the cell was cultured at an initial density of 7000 ∼ 15 000 cells cm−2 and incubated at 37 °C in a 5% CO2 atmosphere. The cell was proliferated in culture media containing Dulbecco's Modified Eagle's Medium nutrient mixture F-12 (DMEM/F-12) supplemented with 10% immobilized fetal bovine serum and 1% Kanamycin (Wako Pure Chemical Industries). The cell culture was subjected to acoustic impedance measurement by SAM once it reached ∼75% confluency.
2.2. Scanning acoustic microscopy
SAM as used in this study employed the measurement system described previously. 3–10) Briefly, the PS film dish containing the cell culture was placed above the transducer, which has a central frequency of 320 MHz [Fig. 1(a)], and the reflection signals were received by the same transducer. Pure water (sound speed = 1480 m s−1, mass density = 1000 kg m−3) was used as a coupling medium for the measurement. Acoustic pulse waves, spreading from 100 ∼ 450 MHz were used to scan the cell in the x- and y-directions using a mechanical stage. The image generated for one observation consists of 200 × 200 points (x- and y-resolution) and a waveform size (t-resolution) made up of 200 samples, sampled with an interval of 125 ps. The specimen was subjected to waveform acquisition eight times for noise reduction by averaging. 13)
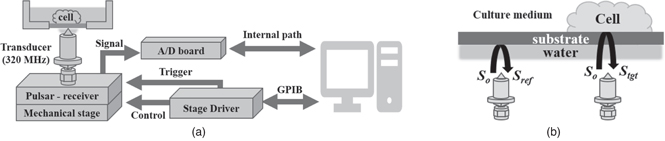
Fig. 1. Schematic diagram of the SAM, showing (a) the setup of the measurement system and (b) the calibration of acoustic impedance. 16)
Download figure:
Standard image High-resolution imageFigure 1(b) illustrates the signals used for calculation of the acoustic impedance as described in a previous paper. 16) The reference signal, denoted by Sref, is the reflection signal obtained from the interface between the substrate, which is the PS film, and the water, while the target signal, denoted by Stgt, is the signal obtained from the interface between the substrate and the cell. They can be represented as:

where Ztgt, Zref, Zsub, and S0 are the acoustic impedances of the target, reference, substrate, and transmitted signal, respectively. Although S0 is not obtainable from measurement, it can be calculated as

Hence, the acoustic impedance of the target substance, Ztgt, can be calculated based on the above equation and represented as:
where Zsub and Zref are the acoustic impedances of the substrate (2.46 MN·s m−3) and cultured medium (1.52 MN·s m−3), respectively. Data processing was performed using a laboratory virtual instrument engineering workbench (LabVIEW, National Instrument).
2.3. Immunocytochemistry and image analyses
In this experiment, mitochondria were stained by incubating living cells with MitoTracker™ Orange CMTMRos (mitotracker, 0.5 μM, Invitrogen, USA). After acoustic impedance measurement, the cell culture was washed with phosphate buffered saline solution (PBS) and fixed using 4% paraformaldehyde/PBS at room temperature for 15 min. The cells were then washed with 0.1% Triton X 100/PBS, then rinsed with PBS before incubation for 1 h in blocking solution (5% goat serum/PBS) at room temperature. The cells were again washed with PBS before being incubated with primary antibodies overnight at 4 °C. The primary antibodies used in this study were actin (Abcam, United Kingdom, diluted in 1:1000) 17) for actin filaments, lamin A/C (Abcam, diluted in 1:100) 18) for nuclear envelopes, and PhH3S10 (Invitrogen, USA, diluted in 1:1000) 19) to distinguish cells in different mitotic phases, followed by secondary antibodies Alexa-Fluor-488-conjugated goat anti-mouse immunoglobulin G (IgG) (Invitrogen, USA, diluted in 1:1000), fluorescein isothiocyanate (FITC)-conjugated goat anti-rabbit IgG (Proteintech, USA, diluted in 1: 1000), and Texas-Red-conjugated goat anti-rabbit IgG (Invitrogen, USA, diluted in 1:1000), incubated overnight at 4 °C. Finally, the cells were incubated with 4,6-diamidino-2-phenylindole dihydrochloride (DAPI, Wako Pure Chemical Industries, Japan, diluted in 1:1000) 19) solution for 15 min at room temperature to identify the cell nucleus. Fluorescent images were captured using confocal laser microscope A1 (Nikon) with an objective lens with 20× magnification, scan size = 2048 pixel, scan speed = 0.125 frame/sec, and with image acquisition performed eight times to obtain a clearer image by averaging. For DAPI imaging, excitation wavelength = 403.2 nm; for lamin A/C and actin imaging, excitation wavelength = 486.8 nm; for PhH3S10 and mitotracker imaging, excitation wavelength = 561.5 nm.
The area occupied by the cell nucleus was determined using Fiji. 20) Further, the circularity and roundness of that area were also calculated. The data were recorded as mean ± standard deviation. A total of 10 cells were subjected to this data inquisition.
3. Results
3.1. Acoustic impedance measurement using SAM successfully mapped C127I cells in different mitotic phases.
C127I cells were mapped using SAM once the cell culture was ∼75% confluent, and the results of the observation are shown in Fig. 2. Cells in different mitotic phases such as prometaphase, anaphase, and telophase, shown by white circles within the figure, were successfully captured. Further, as described previously, the changes observed using SAM acquisition reflect the changes in cell elasticity. The strength of the cytoskeleton (1.64 MN·s m−3) is strongly associated with the cell elasticity and, hence, the higher acoustic impedance region surrounding the cell. The lower acoustic region (1.61 MN·s m−3) recorded within the cells implied that it was the cell nucleus, as the description of the cell nucleus during mitosis was consistent with our results.

Fig. 2. (Color online) Acoustic impedance measurement of mapped C1267I cells in different mitotic phases. White circles within the acoustic impedance profiles indicate cells in the corresponding mitotic phase as mentioned. Scale bar = 50 μm. 16)
Download figure:
Standard image High-resolution image3.2. Immunocytochemical analyses confirmed the significant morphological changes of C127I cells in different mitosis phases.
Immunocytochemical analyses were carried out to confirm the results obtained from SAM acquisition. In this study, several antibodies were used to confirm the changes in different organelles during mitosis. DAPI confirmed the position and size of the cell nucleus during mitosis (Fig. 3 and Fig. 4). Most cell nuclei were located at the center of the cell, and the size got bigger or doubled as the cell underwent mitosis in order to form two daughter cells. PhH3S10 confirmed the cells were in mitosis as this protein is only expressed during chromatin condensation as the parent cell divides into two daughter cells, distributed around the cell nuclei (Fig. 3). On the other hand, immunostaining of actin confirmed the structural changes of the actin filament during mitosis (Fig. 3). As part of the cytoskeleton that maintains the cell morphology, they underwent dynamic changes during mitosis to allow cytokinesis. The fibrous structures observed in the prometaphase gradually switch from a fibrous to a globular state.
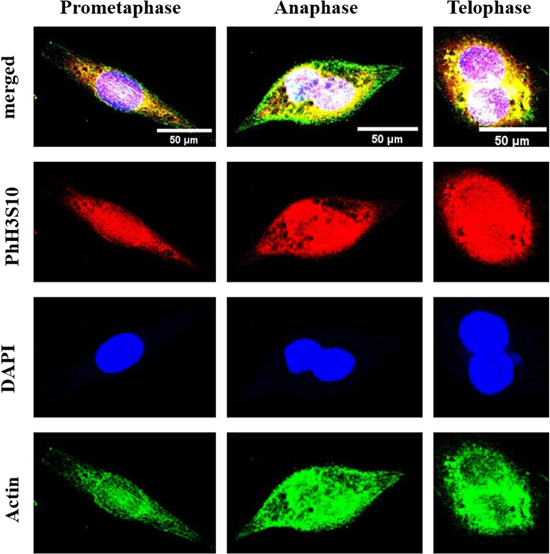
Fig. 3. (Color online) Laser confocal microscopy confirmed C127I cells in different mitotic phases. Red: cells in mitosis (PhH3S10), blue: cell nucleus (DAPI), and green: actin filament (actin). The cell morphological changes were similar to those observed using SAM. Scale bar = 50 μm. 16)
Download figure:
Standard image High-resolution image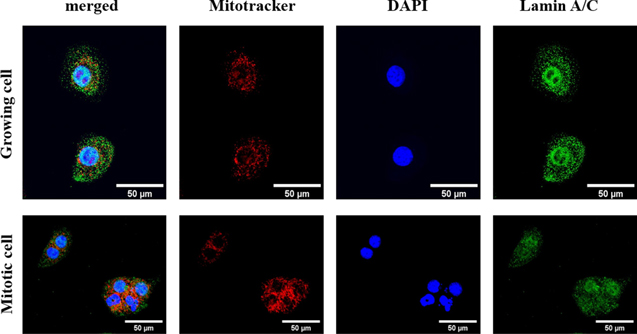
Fig. 4. (Color online) Laser confocal microscopy confirmed that the nuclear envelope vanished during mitosis and mitochondria dispersed around the cell nuclei. Red: mitochondria (mitotracker), blue: cell nucleus (DAPI), and green: lamin A/C (nuclear envelope). The cell morphological changes were similar to those observed using SAM, and the position of the cell organelles altered when they underwent mitosis. Scale bar = 50 μm.
Download figure:
Standard image High-resolution imageThe nuclear envelope is also a target in this study, and the alteration during mitosis was confirmed by lamin A/C immunostaining. Growing cells that had not entered mitosis had intact nuclear envelopes. However, in mitotic cells, the nuclear envelope disintegrated to allow the release of the chromatin as the cell divides (Fig. 4). Mitotracker staining was employed to identify the alteration of the mitochondria within the growing cell and the mitotic cell. Figure 4 shows that mitochondria dispersed around the cell nucleus in both the growing cell and the mitotic cell.
Table I shows that the area around the cell nucleus is higher in SAM compared to confocal laser microscopy. Further, the circularity and roundness of the cell nucleus is different in SAM and confocal laser microscopy.
Table I. Comparison of the area circularity and roundness of the nucleus as observed using SAM and confocal laser microscopy. Data were reported as mean ± standard deviation.
| Observation method | SAM | Confocal laser microscopy |
|---|---|---|
| Area (μm2) | 296.52 ± 55.71 | 117.77 ± 40.09 |
| Circularity | 0.83 ± 0.09 | 0.67 ± 0.23 |
| Roundness | 0.72 ± 0.15 | 0.76 ± 0.13 |
4. Discussion
As the rates of cancer mortality and morbidity increase over time, it is necessary to re-evaluate the current techniques to allow for a more efficient strategy in cancer treatment. Although the utilization of ultrasound in the biomedical field is common in tissue and organ study, it is less commonly applied in cellular study. 21–27) In this study, we have focused on the development of a living observational tool that utilizes ultrasonic waves to map alterations at a cellular level. Living observation is essential in the development of a novel pathological diagnosis tool as this reduces the invasive procedures that are still frequently used in cancer diagnosis. SAM was employed in this study to trace the morphological changes in murine breast cancer cell C127I during mitosis.
Briefly, a cell that enters mitosis will enlarge in size as the genetic material doubles to prepare the cell for splitting into two daughter cells. This is known as interphase. The cell nucleus and the nuclear envelope break down to allow the chromosomes to gather around the midline during prometaphase. The chromatid pairs that queue along the midline are then pulled by the spindle fibers into opposite ends of the cells in anaphase. As mitosis progresses, the chromosomes decondense, the spindle fibers dissociate, and then the nuclear membrane and cell nucleus start to reform. This phase is known as telophase and the cell will undergo cytokinesis as it splits into two identical daughter cells. 28,29) In other words, all cell organelles are involved in these dynamic changes. As the cell building materials undergo swift morphological changes, the mechanical properties of the cell must also undergo rapid changes. In our previous report, we showed that cell elasticity contributes to the major changes in the acoustic impedance value, as SAM mapped the cells by interpreting the reflection signals coming from the cytoskeleton. 5,7,8,11,12,30,31) While conventional optical microscopy also provides us with information on the cell morphology, SAM was able to provide us with the changes of the acoustic impedance value of cells upon drug treatment, which is infeasible in optical microscopy. 6,9,10,13) This indicates that SAM has the potential to provide more information in cell study as compared to optical microscopy.
In our previous paper we shifted our focus onto the other organelles, mainly the cell nucleus. 16) This is because the cell nucleus is the largest cell organelle in eukaryotic cells. Considering the size of the cell nucleus, we hypothesized that it also contributes to the changes of acoustic impedance as observed in our previous study. There have been many attempts to measure the acoustic impedance of the cell nucleus over the years. 14,32–35) However, the results of those studies are not conclusive as the cellular dynamic changes might alter the mechanical properties of the cell nucleus, which is less discussed. Our results showed that SAM was capable of capturing living cancer cells in different mitotic phases, shifting from rounded shape to dumbbell shape. Moreover, these changes do not only match the description of cells under different mitotic phases, but also display different acoustic impedance regions within one cell, particularly a lower acoustic impedance region enclosed by a higher acoustic impedance region, which implies a cytoskeleton as illustrated in Fig. 5. This suggested that upon mitosis, as the cell organelles within the cell deconstructed for redistribution, these dynamic changes can be measured using SAM. 17,36)

Fig. 5. (Color online) Cell morphological changes of C127I cells in different mitotic phases. Similarities in cellular observation were confirmed between the general depiction of mitosis and the acoustic impedance profiles using SAM. This suggested that SAM can be utilized to map living cells and their dynamic changes.
Download figure:
Standard image High-resolution image
Immunocytochemical analyses were carried out to confirm different cell organelles that play an important role in mitosis, namely the cell nucleus (DAPI), actin filament (actin), nuclear envelope (lamin A/C), mitochondria (mitotracker), and histone (PhH3S10). DAPI immunostaining showed that in the growing cell there is only one cell nucleus, whereas the cell nuclei in mitotic cells are bigger (prometaphase), or doubling in size (anaphase and telophase). This result is similar to the one observed in SAM as the lower acoustic impedance region in prometaphase had a bigger surface area, while there were two rounded lower acoustic impedance regions within a cell for cells under anaphase or telophase. The nuclear envelope and mitochondria that disintegrated when cells progressed from prometaphase to anaphase and then to telophase were seen to disperse around the nucleus as shown in Fig. 4. It is important to distinguish the changes of other organelles, excluding the cell nucleus during mitosis, because this dispersion might contribute to the changes we observed in the acoustic impedance as shown in Fig. 2. This is because, to date, less is known about the acoustic impedance of the cell nucleus although it takes up most of the space within the cell. Indeed, our results revealed that the area of the region mentioned above was greater in SAM compared to in confocal laser microscopy (Table I). The circularity and roundness also varied (Table I), which suggests that the region that we hypothesized as the cell nucleus in SAM might consist of mitochondria dispersed around it.
PhH3S10 was used to trace the mitotic phase. Phosphorylation of histone is known to occur during mitosis and meiosis as the chromatin condense. Therefore, expression of PhH3S10 helps us pinpoint at which stage the cell is during mitosis. 19) Expression of PhH3S10 is obvious in prometaphase as the chromatin condensed to allow the splitting. This result is consistent with previous reports. 37–39) Moreover, PhH3S10 expression is evident in anaphase and telophase as the cell is coming close to the end of mitosis. This suggests that PhH3S10 plays an important role in initiating the condensation and decondensation of chromatin during mitosis, making it a suitable marker to cross-confirm the cell captured using SAM.
However, there are limitations in our current methodology. First, it is hard to label the cell in SAM to allow comparison with laser confocal microscopy. Our current result did not show the same cell for comparison in both SAM and laser confocal microscopy. The PS film dish culture vessel has a surface area of 3.2 cm2, making it hard to label the cell for comparison. Thus, it is extremely hard to prepare a specimen to compare the results of the exact same cells when measured using SAM and confocal laser microscopy. Next, the cell morphology might have changed when the cells were fixed by 4% paraformaldehyde. Cell fixation prior to immunocytochemistry allows cell permeabilization for antibodies to access the intracellular structure. Therefore, if the cell morphology altered at this stage, it is going to get more difficult to label the cell for comparison. Furthermore, although mitosis only took about an hour to finish, the growing cancer cell in other stages of the cell cycle took a longer time (14–16 h) to complete. In addition, cancer cells tend to have enlarged nuclei, or to house more than one nucleus within a single cell. Thus, cells in different stages which were mapped by SAM might be hard to distinguish, as growing cells, mitotic cells in interphase, and splitting cells after cytokinesis look similar. Cell cycle synchronization drugs which arrest growing cells in a specific cell cycle might be useful in order for us to label the cell for comparison in the future. Overall, our results showed that SAM is a useful tool that allows living observation of cells in different mitotic phases.
5. Conclusions
Our current results have demonstrated that SAM is capable of distinguishing between cells in different mitotic phases based on the changes of acoustic impedance. This result was confirmed using laser confocal microscopy, and SAM is proven to be more useful than conventional techniques as living observation is possible. Further work is necessary to label cells for comparison and observe the mentioned alteration in three dimensions to better understand the cellular behavior of cancer cells.
Acknowledgments
This work was supported, in part, by the Japan Society for the Promotion of Science (JSPS) KAKENHI (grant numbers 21K12643, 20K12621, 15H04017), Health and Labour Sciences Research Grant 16770039, and the Adaptable and Seamless Technology Transfer Program through Target-Driven R&D (A-STEP) (grant number JPMJTM19YJ).