
Abstract
Sonochemistry is an effective method for the initiation or enhancement of the chemical reactions by ultrasound in a wide range of applications. In this study, the efficiency of a sonochemistry transducer, defined as the ratio of ultrasonic power to electrical power, was investigated for different materials and the thicknesses of the vibration plate in the frequency range 22 kHz–2 MHz. The ultrasonic power was measured by calorimetry. To eliminate the influence of reflected waves, the transducer was attached to the side of a cylindrical vessel. The transducer with a stainless steel vibration plate was more efficient than those with vibration plates of acrylonitrile butadiene styrene plastic or chloroprene rubber. The efficiencies of the transducers also increased with decreasing thickness of the vibration plates. Langevin-type transducers were less efficient than the disk-type transducers.
Export citation and abstract BibTeX RIS
1. Introduction
Sonochemistry, which uses ultrasound in water to induce or enhance chemical reactions, has been applied to synthesis, 1–6) decomposition, 7–9) dispersion, 10–12) aggregation, 13,14) agitation, 15) extraction, 16) cleaning, 17,18) atomization, 19–22) CO2 capture and storage, 23,24) and wastewater treatment. 25)
The performance of a sonochemical reactor can be evaluated through dosimetry measurements of the amount of substance in the reacted material. Some common dosimetry techniques are the Fricke method, potassium iodide (KI), porphyrin derivatives, and fluorescence. 26,27) The sonochemical efficiency (SE) defines the ratio of the amount of substance in the reacted material to the ultrasonic energy input to the sample. 26) The SE is usually determined by the KI method, and can be increased by optimizing ultrasonic frequency 26,28) and the liquid height 29) in a reactor. Ultrasonic power, which is the ultrasonic energy per unit time, is used to study the frequency dependence of chemical reactions by ultrasonic irradiation. 30) Meanwhile, the transducer performance is generally evaluated by the electromechanical coupling factor 31) and the vibration velocity of the transducer relative to the voltage applied to the transducer. 32) Because sonochemistry often uses high electric power, enhancing the energy efficiency of the sonochemical reaction (defined as the ratio of the amount of substance in the reacted material to the electric energy applied to the ultrasonic transducer) is important for practical applications of sonochemistry. Here we define the transducer efficiency as the ratio of the ultrasonic energy to the electric energy applied to the transducer. The energy efficiency of the sonochemical reaction is then obtained by multiplying the transducer efficiency by the SE. Note that the transducer efficiency differs from the electromechanical coupling factor. 33) In the field of sonochemistry, where vessels of various shapes are used, it is recommended that the ultrasonic power be determined by calorimetry. 26,27) The transducer efficiency is also determined by calorimetry. 29,30) When the liquid height of the sample was low and the reflected wave from the water surface was strong, or when the quenching phenomenon of the chemical reaction occurred, the transducer efficiency decreased. 29,30) Therefore, the transducer efficiency is affected by the reflected wave. The transducer efficiency without the influence of reflected waves is defined as the true efficiency of the transducer. The true efficiency of the transducer is effective for the development and the evaluation of the transducer.
Except for calorimetry, the true efficiency of the transducer can also be determined by balance 34,35) and the load test methods. 36,37) The balance method is specified by the National Measurement Institute of Japan (NMIJ) for the use of 1 mW–15 W of electric power in the frequency range of 0.5–20 MHz. 38) The load test method is specified by the Japanese Industrial Standards (JIS) for Langevin-type transducers in the frequency range of 10–100 kHz. 37) In sonochemistry, both Langevin and flat plate type transducers are used in the frequency range of 20 kHz–5 MHz. The transducer is driven by an electric power in the range of 0–200 W. In this study, the true efficiency of the transducer was investigated by calorimetry. In order to obtain the true efficiency of the transducer by calorimetry, the reflected wave from the water surface or wall must be prevented from re-entering the transducer. 39) For this purpose, a method in which the radiating surface of the transducer and water surface are nonparallel has been reported. 39) In addition, Uchida et al. measured the ultrasonic power using a device in which a transducer was attached to the side of a cylindrical vessel to block the reflected waves, and reported that the difference from the value obtained by the balance method was within 5%. 40) The authors also used a similar vessel to measure the ultrasonic power in the frequency range of 400 kHz–2 MHz and to determine the transducer efficiency. 41)
This study aims to obtain the true efficiency of the transducers for sonochemistry at various frequencies using a device with transducers attached to the sides of a cylindrical vessel. For comparison, the same transducer was attached to the bottom of a vessel used in a previous study, and the transducer efficiency was determined. In order to develop a highly efficient transducer, the effect of different vibration plate materials and thicknesses on the true efficiency of the transducer was investigated in the frequency range of 22 kHz–2 MHz.
2. Experimental methods
2.1. Apparatus
The structures and photographs of vessels A and B are shown in Figs. 1 and 2, respectively. Vessel A, which was used in a previous sonochemical experiment, 42) circles cooling water through a double structure with an inner diameter of 56 mm. Vessel B with an inner diameter and height of 180 and 160 mm, respectively, was used to obtain the true efficiency of the transducer. The inner wall and the bottom of the vessel are made of stainless steel SUS304, and the thickness is 1 mm, which is shorter than the wavelength. For insulation, the outside of the inner wall and the underside of the bottom have air layers with 10 mm of thickness, and the outside of the air layer and the upper side have expanded polystyrene 40 mm of thickness. The transducer (Honda Electronics) was a circular piezoceramic device with a circular vibration plate, which was attached to the bottom of vessel A or the side of vessel B using waterproof rubber and screws. The diameters of piezoceramic device and vibration plate were 50 and 100 mm, respectively. The frequency of the transducer was varied as 200, 300, 400, 500, 750, 1000, and 2000 kHz. The vibration plate material was SUS304 stainless steel, acrylonitrile butadiene styrene (ABS) plastic or chloroprene rubber (CR rubber). The thickness of the vibration plates was also changed. A Langevin-type multi-frequency transducer (HEC45242M, Honda Electronics, diameter = 45 mm) was operated at frequencies of 22, 43, 98, and 129 kHz. Langevin-type single-frequency transducers (HEC4528, HEC4540, Honda Electronics, diameter = 45 mm) were operated at 28 or 40 kHz. These transducers were air cooled by a fan.

Fig. 1. (Color online) (a) Structure and (b) photograph of vessel A.
Download figure:
Standard image High-resolution image
Fig. 2. (Color online) (a) Structure and (b) photograph of vessel B.
Download figure:
Standard image High-resolution imageThe experimental apparatus was set up as described in a previous paper. 42) The effective electric power applied to the transducer was calculated from the voltage applied to both ends of the transducer, which was measured by an oscilloscope (TDS3014B, Tektronix) and the current of the transducer measured by a current probe (TCP202, Tektronix). In some cases, a matching circuit was inserted between the transducer and the power amplifier. The effective electric power was maintained constant by an electrical control system (Honda Electronics). This system read the effective electric power from the oscilloscope and sent it to the personal computer via the general-purpose interface bus (GPIB). The optimal output voltage from the signal generator was sent by the personal computer to the signal generator via the GPIB to maintain steady effective electric power.
2.2. Measurements
The ultrasonic power (energy input to the sample per unit time) was determined by calorimetry. The temperature of the sample in the vessel was measured using a platinum resistor (pt100, Netsushin) and a thermometer (NR500, Keyence). The sample was ultrapure water (Milli-Q Reference & Elix Essential UV5, Merck). The ultrasonic power PU was calculated as

where ΔT/Δt is the rate of the temperature rise, Cp is the specific heat capacity of water (4.18 J·g−1·K−1), and M is the mass of water. The temperature rise rate was determined from the temperature change at the initial stage of ultrasonic irradiation or the temperature change between the pre-start and post-end of ultrasonic irradiation. 40) Before the ultrasonic irradiation, the sample temperature was 298 ± 0.1 K and the sample was saturated with air. The resolution of the temperature measurement is 0.02 K. Room temperature during measurement is 298 ± 1 K.
3. Results and discussion
To investigate the effect of reflected waves in each vessel, a sinusoidal voltage with 10 periods of pulses was applied to the transducer at a frequency of 500 kHz. Figures 3(a) and 3(b) show the time variations of the voltage at both ends of the transducer on vessels A and B, respectively. Pulses were applied at 0 ms in Fig. 3. The waveforms shown at 0.11, 0.22, 0.33, and 0.44 ms in Fig. 3(a) are reflected waves from the water surface. In Fig. 3(b), these reflected waves were not observed. Therefore, the ultrasonic power can be measured without reflected waves with the use of vessel B.
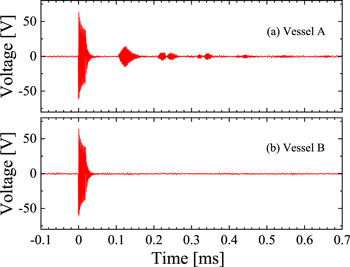
Fig. 3. (Color online) Time variation of the voltage at both ends of the transducer on (a) vessel A and (b) vessel B. Here, a pulse voltage was applied to the transducers.
Download figure:
Standard image High-resolution imageFigure 4(a) plots the relationship between the effective electric power applied to the transducer at 500 kHz and the ultrasonic power input to the sample on vessel A. The sample volumes were 50 and 150 ml. The vibration plate was composed of stainless steel with 1 mm of thickness. As the effective electric power increased, the ultrasonic power first increased and then suddenly dropped before resuming the increasing trend. The drop occurred at 75 and 130 W for sample volumes of 50 and 150 ml, respectively. To clarify the cause of the sudden decrease in ultrasonic power, the reaction rate of I3 − (determined by the KI method 26)) was plotted as a function of the effective electric power [see Fig. 4(b)]. As the effective electric power increased, the reaction rate rose to a maximum and then dropped. The drop point was the effective electric power at which the ultrasonic power decreased in Fig. 4(a). This phenomenon, whereby increasing the electric power suddenly lowers the reaction rate, is called the quenching of a chemical reaction. 30,43–45) Quenching introduces nonlinearity into the relationship between the electric and ultrasonic powers. This nonlinearity occurs because cavitation bubbles are not generated by quenching and the heat generated from vibrations of bubbles is reduced. Thus, by measuring the relationship between the effective electric power applied to the transducer and the ultrasonic power input to the sample, we can estimate the electric power at which quenching occurs. Below the quenching effective electric power, the ultrasonic power is proportional to the effective electric power. The proportionality constant, defining the gradient of the ultrasonic power with respect to the effective electric power, is defined as the transducer efficiency. Performing the calculation, the transducer efficiencies were determined as 54% and 63% for sample volumes of 50 and 150 ml, respectively. Note that the transducer efficiency decreased with decreasing sample volume. The authors attributed this result to waves that were reflected from the water surface and returned to the transducer. When the volume of the sample was small (i.e. the liquid height was low), the transducer efficiency decreased because the intensity of the transmitted waves to the transducer (which constitute part of the reflected waves) were larger and the energy dissipation within the transducer was increased. Figure 4(a) also shows the relationship between the effective electric power and the ultrasonic power for vessel B, which contained 3500 ml of the sample. The effective electric power was proportional to the ultrasonic power in the range 0–200 W. In the absence of reflections, the transducer efficiency increased to 93%. The transducer efficiency on vessel B was determined as the true efficiency of the transducer. As the temperature of the transducer after the ultrasonic irradiation was lower than the water temperature, the effect of the heat generated by the transducer is negligible.
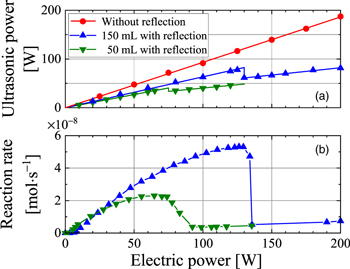
Fig. 4. (Color online) (a) Ultrasonic power obtained by calorimetry and (b) reaction rate of I3 − obtained by the KI method, plotted as functions of electric power applied to the transducer.
Download figure:
Standard image High-resolution imageFigure 5 compares the efficiencies of the transducers with vibration plates made from different materials (stainless steel, ABS plastic or CR rubber) with different thicknesses. All transducers were operated at 500 kHz. When the vibration plate was SUS304 with 0.1 mm of thickness, the true efficiency of the transducer was 95%. This value was consistent with that measured by the balance method. Regardless of material, the true efficiency of the transducer decreased with increasing thickness of the vibration plate. The transducer has dielectric and elastic losses. As the thickness of the vibration plate increases, the elastic losses increase and the true efficiency of the transducer decreases. Meanwhile, the transducer with the stainless steel vibration plate was more efficient than the transducers with ABS plastic and CR rubber vibration plates. In the case of stainless steel, the true efficiency of the transducer was measurable when the effective electric power applied to the transducer reached 200 W. In contrast, the ABS plastic vibration plate was damaged at 75–150 W and in the transducer with a CR rubber vibrating plate, the piezoceramic was damaged at 125–200 W. Increasing the thickness of the vibration plate lowered the effective power at which the transducer was broken. This trend can be explained by the higher ultrasonic absorption capacity of ABS plastic and CR rubber than of stainless steel, meaning that the generated heat was dissipated in the vibration plate. Therefore, these vibration plates cannot handle the high ultrasonic power required in sonochemistry.
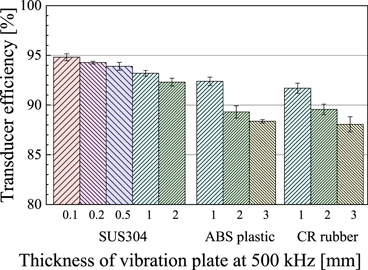
Fig. 5. (Color online) Effects of material composition and thickness of the vibration plate on the transducer efficiency at 500 kHz.
Download figure:
Standard image High-resolution imageFigure 6 compares the efficiencies of transducers with stainless steel vibration plates of different thicknesses operated at different ultrasonic frequencies. Except at 200 kHz, the true efficiency of the transducer decreased with increasing thickness of the vibration plate. When the vibration plate was 0.1 mm of thickness, the true efficiency of the transducer decreased with increasing frequency. This occurred because at higher frequencies, the piezoceramic is thinner and the vibrations of the transducer are affected by thickness of the vibration plate. At 200 kHz, the true efficiency of the transducer was probably reduced, because coupled vibrations of the thickness and harmonics of the radial occur. In future work, the authors will optimize the shape and frequency of the transducer to increase its efficiency. At 750 kHz, 1 MHz, and 2 MHz, the plate with 0.1 mm of thickness achieved higher transducer efficiency than a plate with a thickness of half a wavelength (λ/2) of ultrasound in stainless steel.
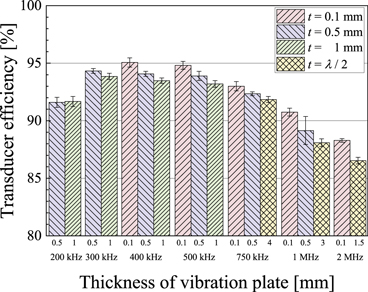
Fig. 6. (Color online) Effects of thickness of vibration plate and ultrasonic frequency on the transducer efficiency with a stainless steel vibration plate.
Download figure:
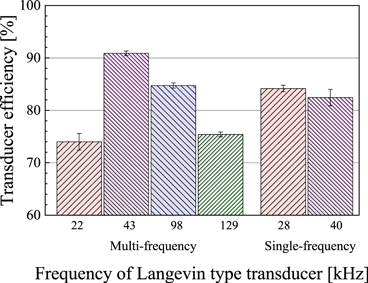
Standard image High-resolution imageFigure 7 compares the efficiencies of multi-frequency and single-frequency Langevin-type transducers. The vibration plate was 2 mm of thickness and made of stainless steel. At all frequencies, the efficiencies were lower than those of the disk-type transducers. Improving the efficiency of Langevin-type transducers is a challenge for the future.
Fig. 7. (Color online) Efficiencies of multi-frequency and single-frequency Langevin-type transducers.
Download figure:
Standard image High-resolution image
4. Conclusions
Calorimetric measurements were carried out in the frequency range 22 kHz–2 MHz using a cylindrical vessel with a transducer attached to the side of the vessel, and the true efficiency of the transducer was obtained. The vibration plates made of stainless steel were more efficient than those made of ABS plastic and CR rubber. The true efficiency of the transducer increased with increasing thickness of the vibration plate. The true efficiency of the transducer was reduced at 200 kHz. The disk-type transducers were notably more efficient than Langevin-type transducers at lower frequencies.
Measuring the true efficiency of the transducer attached to the side of a cylindrical vessel is a valid evaluation method for the future development of high-efficiency transducers. In order to obtain a more accurate true efficiency of the transducer, we plan to investigate the effect of the heat generated by the transducer and to calibrate the electric power using thermal converters and other methods. In future work, the authors also plan to compare the results of this study with those obtained by the balance method and other methods at high electric power.