
Abstract
To achieve fine visualization of the peripheral microvascular networks, we have developed a photoacoustic (PA) microscope equipped with a four-channel annular array transducer. The quality of PA images processed with delay-and-sum (DAS) method is degraded by off-axis signals. Thus, to achieve higher image quality for the PA microscope, this study evaluated the efficacy of the five coherence factor weighting methods: coherence factor, sign coherence factor, phase coherence factor, circular coherence factor, and vector coherence factor. Using PA signals acquired from a 100 μm microtube and the skin microvessels, we generated PA images with DAS and one of the weighting methods, and quantitatively evaluated the image quality by calculating the sharpness, contrast ratio, and contrast-to-noise ratio. The results showed the phase coherence factor and the vector coherence factor methods were more effective to clearly visualize the microvascular structure, in terms of vessel sharpening and noise suppression performances, than the other methods.
Export citation and abstract BibTeX RIS
1. Introduction
Morphological observation of the peripheral microvascular network is known as a promising diagnostic method for detecting subtle changes in systemic hemodynamics and evaluating inflammation in skin and joints. 1–3) Microvessels in the dermis have a diameter of several tens of micrometers, 4) and to visualize these superficial microvessels, it is necessary to establish imaging techniques with high spatial resolution and selective extraction of blood vessels. On this topic, photoacoustic (PA) imaging has gathered much attention as it is capable of selectively visualizing those micro-scale blood vessels. 5,6) PA imaging is an imaging technique that uses the PA effect, which is a phenomenon that occurs when a laser beam is irradiated on tissue and the optical absorbers (e.g. hemoglobin) in the tissue adiabatically expand and generate ultrasound waves. Due to the principle, PA imaging has shown excellent tissue selectivity that can visualize specific substances by selecting the wavelength of the laser light. 5,6)
As an implementation of PA imaging, PA microscopy (PAM) is a modality that achieves a high spatial resolution. On the basis of the determination of the lateral resolution, PAM is classified into optical-resolution PAM (OR-PAM) and acoustic-resolution PAM (AR-PAM). 5,6) In OR-PAM, the lateral resolution is determined by the optical focus width, which is typically over 10 times smaller than the acoustic focus, and is about 5–10 μm, while the maximum penetration depth is limited to about 1 mm. In AR-PAM, wider optical beams are emitted and the lateral resolution is determined by the acoustic focus width. Thus, the spatial resolution is about 45 μm, while the maximum penetration depth of AR-PAM also increases to about 3 mm that can investigate the human cutaneous microvessels at up to 2 mm in depth.
Our research group has developed a novel AR-PAM system equipped with a four-channel annular array transducer to achieve visualization of cutaneous microvascular networks with an increased depth-of-field (DOF). Conventionally, a single concave transducer has been widely used for AR-PAM systems to achieve a fine acoustic focal width and a high spatial resolution. However, the focal length of a single concave transducer is fixed by the shape of the transducer, which limits the DOF and results in a blurred image outside the focal range. In contrast, the annular array transducer can solve this problem. The annular array transducer used in our system consists of four ring-shaped concentric concave elements so that it can improve the DOF by applying the delay-and-sum (DAS) method. 7,8) Nevertheless, the DAS method sometimes results in blurred images when signals from the off-axis cause the phase difference of the received signals. 9)
As a solution, the coherence factor (CF) weighting may be used in addition to the DAS method as it has effectively suppressed such off-axis signals in the adaptive beamforming in the signal processing of ultrasound imaging systems. 9–12) In our recent report, 11) we applied the CF weighting to the beamformed data acquired with the annular array PAM and evaluated the efficacy of the method for improving the image quality of microvascular imaging. We showed that the CF weighting was effective to sharpen microvessels, while it might excessively suppress the entire signal intensity. The CF weighting characterizes the coherency of the signals among different channels by their intensity. However, since the acoustic waves generated by the PA effect only have a sound pressure about two orders in magnitude lower than that used in general ultrasound imaging, 6) it was suggested that the intensity-based CF weighting and lower SNR affected the accuracy of incoherent suppression.
To overcome the problem, in addition to the CF method, we further considered four coherence factors: sign coherence factor (SCF), phase coherence factor (PCF), circular coherence factor (CCF), and vector coherence factor (VCF). The SCF was expected to be effective for PA imaging because it binarizes the phase of the signal, which would eliminate the intensity difference of the signal. 9,13–15) The PCF, CCF, and VCF were selected as they are calculated based on the phase differences among the signals, and those coherence factors were expected to suppress the incoherent components more effectively than the CF. 13–18)
This study applied those coherence factor weighting methods, the CF and four other coherence factors, to the PA data of a blood vessel phantom and the skin microvessels acquired with the annular array PAM and quantitatively evaluated the efficacy of each weighting method in suppressing off-axis signals as well as sharpening the images.
2. Imaging system and signal processing methods
2.1. Experiment setup
The PA micro-imaging system used in this study (HadatomoTM Z WEL5200 prototype developed in a joint effort by Tohoku University and Advantest Corporation) consisted of a PA transmitter/receiver unit with a laser optical fiber placed in the center of an annular array transducer, an XY stage that allows mechanical two-dimensional scanning in an imaging field, and a unit for control and signal processing as shown in Fig. 1.

Fig. 1. (Color online) The PA micro-imaging system used in this study (HadatomoTM Z WEL5200 prototype developed in a joint effort by Tohoku University and Advantest Corporation). (a) Outside appearance of our system. (b) Block diagram of our system.
Download figure:
Standard image High-resolution imageThe annular array transducer had a concave surface with a geometric focus of 6 mm and a center hole (ϕ1 mm) for the laser outlet. The concave geometry was divided into four ring-shaped PZT elements (a center frequency of 60 MHz  20%) with a minimum diameter of 1 mm and a maximum diameter of 6 mm as shown in Fig. 2. The Nd:YAG laser was selected to irradiate 532 nm pulsed beams at a repetition rate of 1 kHz and a pulse width of 1.2 ns. The emitted pulse energy was measured to be 16 μJ pulse−1. While the PA transmitter/receiver unit was raster-scanned by the XY stage, an event of emitting a laser pulse and receiving PA signals was repeatedly performed to acquire the three-dimensional distribution of the optical absorbers in the imaging field. In each receiving event, the PA waves generated at the object by the laser irradiation were received by each element of the annular array transducer and recorded at a sampling frequency of 500 MHz.
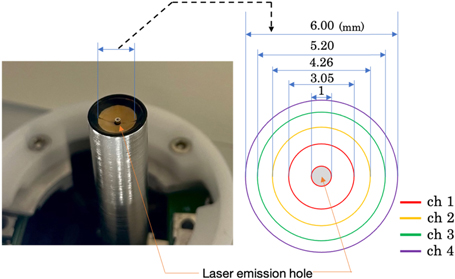
Fig. 2. (Color online) The annular array transducer.
Download figure:
Standard image High-resolution imageThe theoretical axial resolution of our AR-PAM system,  is determined by the receiving bandwidth
  of the ultrasonic transducer and is expressed by the following equation,
5,6)
of the ultrasonic transducer and is expressed by the following equation,
5,6)

where  is the speed of sound. Also, the theoretical lateral resolution of AR-PAM system,
  is expressed by the following equation,
5,6)
is expressed by the following equation,
5,6)

where  is the numerical aperture of the ultrasonic transducer, and
  is the center frequency in the receiving bandwidth. According to these equations, the theoretical axial and lateral resolutions were calculated as 56.1 and 36.2 μm, respectively.
The obtained PA signals were first beamformed with a DAS algorithm (described in Sect. 2.2) and then the beamformed signals were weighted by a coherence factor method to suppress the off-axis signals (described in Sect. 2.3). In Sects. 2.2 and 2.3, the description focuses on a set of channel-domain PA signals acquired in one receiving event. Subsequently, in Sect. 2.4, the processing was applied to PA signals at each XY position in the mechanical scanning field and the B-mode and C-mode images were generated. All signal processing and visualization were performed on MATLAB (Ver. 2020b, Mathworks).
2.2. Delay-and-sum (DAS) beamforming
First, the signals received by each element were converted to complex analytic signal data by the Hilbert transform as follows,

where  is a series of analytic signal of nth channel,
  is the signal received by the nth element at
  seconds after laser irradiation, and Hilbert(
 ) is the Hilbert transform operator that generates the quadrature signal of the input in-phase signal.
Second, for the nth element of the annular array transducer, the delay time  has to be taken into account to receive a signal from an optical absorber at depth
  and expressed by the following equation,
19)
and expressed by the following equation,
19)

where  is the average radius of the nth element, and
  is the geometric focus. In this study, the speed of sound was respectively set as 1480 m s−1 for the phantom study and 1530 m s−1 for the skin microvascular imaging.
20) The delay time
is the geometric focus. In this study, the speed of sound was respectively set as 1480 m s−1 for the phantom study and 1530 m s−1 for the skin microvascular imaging.
20) The delay time  considers only the one-way delay of the PA signal since the time the laser reaches the object is negligible.
Third and finally, the receive beamforming was performed by synthesizing the PA signal  from the depth
  from the PA signals obtained from each channel using the following formula,

2.3. Coherence factor weighting
Essentially, DAS beamforming enhances in-phase PA signals among active elements by summing time-delayed channel-domain signals; however, since the pulsed laser broadly irradiates the target area, PA signals from other than the imaging axis (off-axis signals) may interfere with some of the channel-domain signals. Coherence factor weighting techniques have been proposed to suppress those off-axis signals by taking the coherency and phase differences among the signals to be summed in DAS process. Here, at each beamformed depth  the time-delayed signal value of nth channel (
 ) can be expressed as,

To compute a coherence factor for each beamformed depth, four complex values were extracted from each channel PA signal. Five coherence factor methods tested in this study (coherence factor, sign coherence factor, phase coherence factor, circular coherence factor, and vector coherence factor) were described in the following sections. Each coherence factor method derives its coherency index that takes values between 0 and 1.
2.3.1. Coherence factor (CF)
The CF is the ratio of the energy of the coherent component to the energy of the entire received signal, and is defined as follows, 9–12)

where  is the number of the element (
 in this paper).
2.3.2. Sign coherence factor (SCF)

2.3.3. Phase coherence factor (PCF)
The instantaneous phase  of the signal acquired by each element is defined as follows,
13–15)
of the signal acquired by each element is defined as follows,
13–15)

The PCF is based on the measurement of the instantaneous phase dispersion of a delayed signal, assuming that the signal phase is distributed in the ![$\left(-\pi ,\,\left.\pi \right]\,\right.$](https://content.cld.iop.org/journals/1347-4065/61/SG/SG1047/revision2/jjapac4684ieqn23.gif) interval, and is defined as follows,
13,14)
interval, and is defined as follows,
13,14)

where  () is the standard deviation operation. The standard deviation of phases is normalized to the standard deviation of the uniform distribution between
  and
and  (
( ).
).
2.3.4. Circular coherence factor (CCF)
The CCF is a weighting function that considers the phase of the signal as a circular distribution and is defined as follows, 14,16)

where  () is the variance operation. Since the phase of the signal is regarded as circular, discontinuities around
  can be avoided.
2.3.5. Vector coherence factor (VCF)
The VCF is a function that weights the phase difference of a signal by defining a unit vector in the complex plane, and is defined as follows, 17,18)
The VCF method measures the concentration of the phases; if all the phases are aligned, the VCF is 1, and if they are uniformly distributed within the unit circle, the VCF is 0. As well as the CCF method, discontinuities around  can be avoided.
2.4. Three-dimensional signal processing and visualization of PA signals
The aforementioned DAS and coherence factor calculations for PA signals acquired in a receiving event were repeatedly performed for the data acquired at each horizontal position (x, y) during the two-dimensional mechanical scanning. As a result, a three-dimensional beamformed PA signal data  and a coherence factor matrix
  which was derived from one of five coherence factor methods, were achieved. Finally, a weighted PA signal data
  can be expressed as follows,
here,  symbol denotes the element-wise multiplication.
The weighted PA signal data was visualized in B-mode and C-mode by applying the maximum amplitude projection (MAP) method. The B-mode MAP image shows the maximum amplitude received from an arbitrary range of positions at the corresponding axial position (y, d). Similarly, the C-mode MAP image shows the maximum amplitude received from an arbitrary range of depths at the corresponding horizontal position (x, y). In this study, the maximum amplitude values projected on a selected plane were normalized by the maximum value of each image, and then color-encoded in the decibel scale.
3. Experiments
3.1. Phantom study
For objective and quantitative evaluation of the efficacy of the five types of coherence factors on MAP images, a blood vessel phantom was made by filling a 100 μm inner diameter PFA microtube with red ink mimicking blood. The inner diameter of the phantom was set as to resemble a representative size of the skin microvasculature.
4) PA imaging was performed in water by acquiring data from a blood vessel phantom attached to a spacer (Fig. 3). The spacer was fixed in front of the tip of the annular array transducer, and the distance between the phantom and the tip of the transducer was set to be 5.0, 5.5, 6.0 (geometric focus), 6.5, and 7.0 mm. The image size was 3.0  6.0 (
6.0 ( ) mm in B-mode and 6.0
  6.0 (
6.0 ( ) mm in C-mode, and the step widths in the vertical and horizontal axes were 30
  15 (
15 ( ) μm.
) μm.

Fig. 3. (Color online) A blood vessel phantom made by filling a 100 μm inner diameter PFA microtube with red ink.
Download figure:
Standard image High-resolution imageIn each B-mode and C-mode MAP image, the phantom diameter visualized by each method was calculated as the average of the widths of the phantom within −6 dB of the maximum intensity value in each Y-axis. The sharpening ratio by applying each coherence factor method to the DAS beamformed signals was calculated by the following formula

where  represents one of the images applied by each coherence factor method.
3.2. Microvascular imaging of human skin
To evaluate the efficacy of the five coherence factor methods on in vivo imaging, we performed PA imaging of cutaneous microvessels on the inner forearm of a healthy male in his 20 s. In the B-mode image, the image size was 3.0 × 9.0 ( ) mm and the measurement depth was 4.0–7.0 mm from the transducer. In the C-mode image, the image size was 9.0 × 9.0 (
 ) mm and the measurement depth was 0.2–2.0 mm from the surface of the skin (5.29–7.00 mm from the transducer) to exclude the melanin in the epidermal layer. The focal point was set at the center of the dermal layer (1.1 mm from the skin surface). The step widths in the vertical and horizontal axes were 60 × 30 (
 ) μm.
) μm.
In each C-mode MAP image, the vessel of interest was set as a blue line, and the full width at half maximum (FWHM) of the vessel was calculated by Gaussian fitting. The sharpening ratio of the target vessel by applying each coherence factor method was calculated by the same Eq. (15).
As indices of image quality improvement, the contrast ratio (CR) and the contrast-to-noise ratio (CNR) were defined as the following, 21–25)


where  and
and  are mean amplitude of the signal from vessel and noise, and
  and
and  are the variance of vessel signal and noise, respectively. In the generated images, we confirmed that the signal from the microvessels had a signal intensity of approximately −15 dB or higher. Hence, the above equation was calculated by thresholding the signals, assuming that the intensity above −15 dB are the signals of blood vessels and the other values are the noise.
4. Results
4.1. Phantom study
As one of the results of the phantom study, the images generated when the phantom was 5.0 mm away from the annular array are shown in Fig. 4. Figure 5 also shows the visualized phantom diameters in each MAP image of the phantom study visualized at all depths. Furthermore, Table I shows the sharpening ratio by applying each coherence factor method to the DAS beamformed signals.
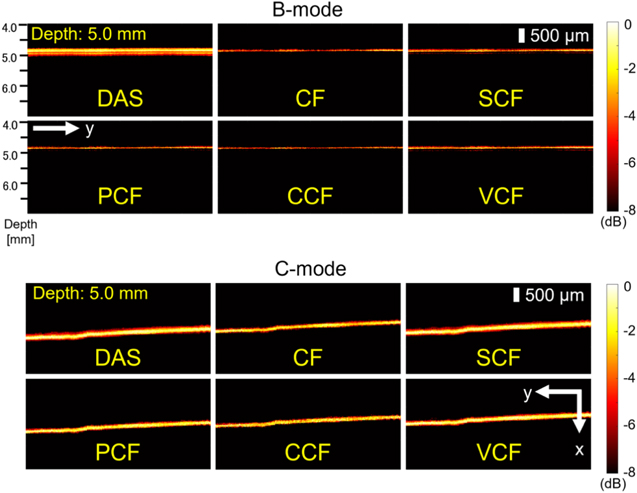
Fig. 4. (Color online) The B-mode and C-mode images generated when the phantom was 5.0 mm away from the annular array.
Download figure:
Standard image High-resolution image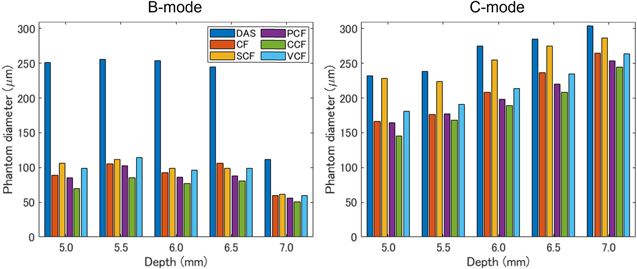
Fig. 5. (Color online) The measured phantom diameters in the B-mode and C-mode MAP images of the 100 μm tube placed at 5.0, 5.5, 6.0, 6.5 and 7.0 mm from the transducer.
Download figure:
Standard image High-resolution imageTable I. The sharpening ratio by applying each coherence factor method to the DAS beamformed signals of the phantom study.
| Sharpening ratio (%) B-mode/C-mode | |||||
|---|---|---|---|---|---|
| Depth (mm) | 5.0 | 5.5 | 6.0 | 6.5 | 7.0 |
| CF | 64/28 | 59/26 | 63/24 | 57/17 | 46/13 |
| SCF | 58/2 | 56/6 | 61/7 | 60/3 | 45/5 |
| PCF | 66/29 | 60/25 | 66/28 | 64/23 | 50/16 |
| CCF | 72/37 | 67/29 | 70/31 | 67/27 | 55/19 |
| VCF | 61/22 | 55/19 | 62/22 | 60/17 | 46/13 |
In the B-mode image, the phantom image visualized with the DAS method was thicker than the original diameter, especially at depths of 5.0–6.5 mm, which was more than twice as thick as the original diameter of 100 μm. In contrast, all types of coherence factors showed a high effect of sharpening. However, in the case of the CCF method, the diameter of the phantom was thinner than 100 μm at all depths. At a depth of 7.0 mm, the diameter of the visualized phantom was thinner than the original diameter when several types of coherence factors were applied.
In the C-mode image, the phantom image visualized with the DAS method was thicker than the original diameter, which was more than twice as thick as the original diameter of 100 μm, similar to the B-mode. On the other hand, the effects of sharpening by all types of coherence factors were confirmed at all depths. The CCF method showed the highest sharpening effect as well as B-mode. However, the effect of sharpening by the SCF method was small than the other coherence factors. The width of the phantom visualized by C-mode tended to be thicker in the deeper position.
4.2. Microvascular imaging of human skin
Figure 6 shows the B-mode images generated by imaging microvessels with each method applied. Figure 7 shows closeup images of the area enclosed by the yellow square in each B-mode image. In the image generated by the DAS method, the entire signal intensity was high, thus the vascular structure was unclear. On the other hand, the images generated by applying several types of coherence factors to the DAS method showed that the entire signal intensity was suppressed and the structure of the blood vessels could be clearly seen. However, in the image generated by applying the CCF method, the visualized vessel structure was partially discontinued (the white arrow in Fig. 7).
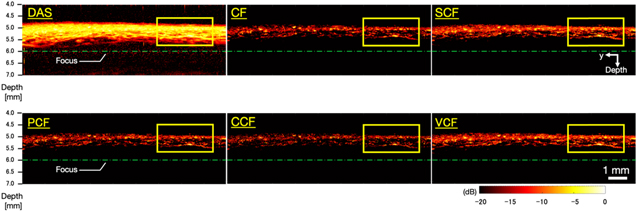
Fig. 6. (Color online) The B-mode images generated by imaging microvessels with each method applied.
Download figure:
Standard image High-resolution image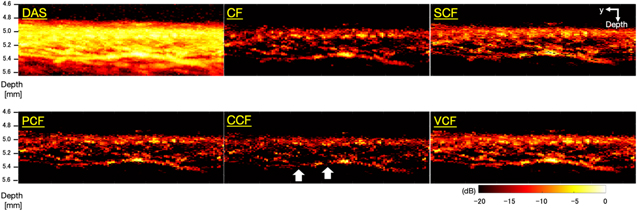
Fig. 7. (Color online) Magnified images of the yellow square regions in the microvessels B-mode images (Fig. 6).
Download figure:
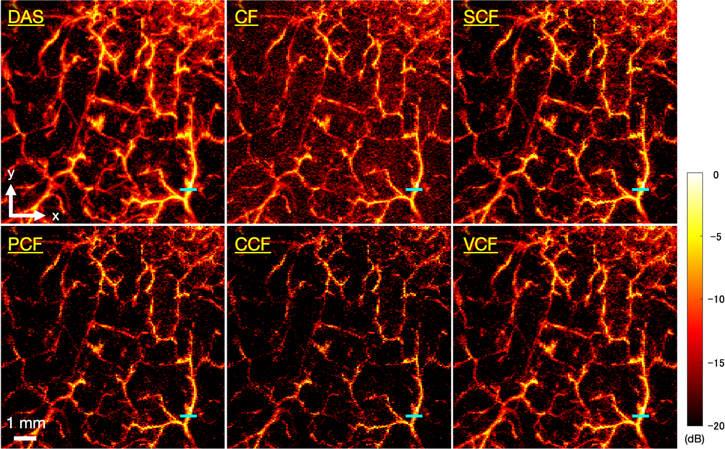
Standard image High-resolution imageFigure 8 shows the C-mode images of microvessels generated by each method. In the image generated by the DAS method, the running of the vessels was clear, but the vessels were visualized as being spread out. Table II shows the FWHM of the target vessel indicated by the blue line, the sharpening ratio by applying each coherence factor method to the DAS beamformed signals, and the CR and CNR calculated for each image. It could be seen that all types of coherence factors had the effect of sharpening the target vessel. In particular, the PCF method and the VCF method showed more than 20% sharpening effect and the CCF method showed 31% sharpening effect. However, in the image which applied the CF method, the CR decreased and the noise was emphasized compared to the other method. There was no significant change in the CNR between each type of coherence factor compared to the DAS method. The image obtained by applying the CCF method showed the highest CR and CNR, but the continuity of the vessels was partially lost, resulting in a rough image.
Fig. 8. (Color online) The C-mode images of microvascular imaging generated by each method.
Download figure:
Standard image High-resolution image
Table II. The FWHM of the target vessel indicated by the blue line, the sharpening ratio by applying each coherence factor method to the DAS beamformed signals, and the CR and CNR calculated for each image of microvascular imaging.
| FWHM (μm)/Sharpening ratio (%) | CR (dB) | CNR | |
|---|---|---|---|
| DAS | 233/− | 7.76 | 0.84 |
| CF | 205/12 | 6.51 | 0.88 |
| SCF | 210/10 | 8.32 | 0.86 |
| PCF | 173/26 | 9.46 | 0.92 |
| CCF | 159/31 | 10.4 | 0.93 |
| VCF | 185/21 | 8.67 | 0.89 |
5. Discussion
In this study, we evaluated the effect of applying five types of coherence factors on DAS beamformed signals to improve the image quality by performing phantom study and microvascular imaging. Before discussing the characteristic effects of the five coherence factors tested in this study, we discuss the results of the phantom study and microvascular imaging of human skin.
5.1. Phantom study
In the phantom study, the improvement effect for image quality by applying the five coherence factors was evaluated by calculating the sharpening ratio of the phantom diameter at different imaging depths. In the B-mode and C-mode MAP images of the phantom study, the results suggested that the five coherence factors had a high effect of sharpening. However, in the B-mode MAP images at a depth of 7.0 mm, the phantom diameter visualized by applying the DAS method suddenly decreased and was confirmed to be around 100 μm. This may be attributed to the decrease in SNR of the PA signal in the deep region due to laser attenuation. In particular, the depth of 7.0 mm is deeper than the acoustic focal length of 6 mm, which is affected by both the influence of the laser attenuation and the decrease in the receiver sensitivity outside of the ultrasound focal length. Therefore, it is suggested that the phantom was not properly reconstructed due to the rapid degradation of signal reception sensitivity caused by these factors.
In the C-mode MAP images of the phantom study, the visualized phantom diameters were found to be larger than the true diameter at all depths and they were increased according to the depth. The reason for the lineally overestimation may be the linear degradation of the resolution and the measurement error due to the mechanical scanning. In the former case, the DAS method made the focal length variable, resulting in a linear change in the phantom diameter with a small  at deeper depths. In the latter case, the original phantom diameter is approximately three pixels in size, which means that the phantom is visualized at a depth of 5.0 mm with a spread of two or three pixels at both edges of the phantom. This indicates that the phantom was overestimated due to the measurement error caused by the mechanical scanning.
5.2. Microvascular imaging of human skin
In microvascular imaging of human skin, we qualitatively and quantitatively evaluated the effects of applying five coherence factors to improve the image quality by calculating the sharpening ratio, CR, and CNR. In the same way as the phantom study, it was confirmed that the five coherence factors had a sharpening effect on the target vessel in the C-mode MAP images. The CR increased in the four coherence factors applied images and suggested an improvement in image quality except for the CF.
However, in the microvascular imaging of human skin, where the measurement range was set to 0.2–2.0 mm depth from the surface to match the thickness of the dermis layer, the maximum depth of evaluable blood vessels was only about 0.7 mm from the surface (about 5.8 mm from the annular array transducer) due to the absorption and scattering of laser in the tissue. Since the penetration depth of the laser varies depending on the optical characteristics and tissue structure of the target object, it is necessary to evaluate the imaging performance of this system in more detail using a small animal model, which is expected to enable imaging with higher penetration depth.
In this paper, we also qualitatively discussed the continuity of blood vessels. As the reason for the discontinuity of blood vessels, it can be considered that there are influences such as differences in hemoglobin concentration, blood vessels structures, etc. However, in vascular imaging, the correct vascular image is unknown, and it cannot be determined that it is the original vascular running even if the continuity of blood vessels is confirmed. In the future, it will be necessary to establish a method to quantitatively evaluate the continuity of blood vessels.
5.3. Comparative investigation of coherence factor weighting methods
Since the CF method quantifies the phase difference of the signal by the ratio of the coherent energy to the total energy of the received signal, the phase differences among the channel-domain signals were not considered accurately. In addition, each element of the annular array transducer used in this system had different sensitivity. Consequently, in the case of vascular imaging, the signal in both vessels and the background area was excessively suppressed, resulting in noise-enhanced images. Hence, the CF method was not suitable for our system.
The SCF method is a weighting function that binarizes the phase of the signal. The results of the phantom study indicated that the SCF method was effective in sharpening for B-mode images, but not effective in sharpening for C-mode images. The results in Sect. 4.2 showed that the SCF method improved the CR value of the images, suggesting that the method was effective for noise suppression against C-mode, but not for sharpening. In addition, the SCF method might cause local variations due to the phase binarization process, so that the PCF, CCF, and VCF methods were more advantageous for this system. Instead, the SCF method may be an effective method for devices that perform real-time imaging because the computational complexity of the SCF method is relatively lower than that of other coherence factors due to the phase binarization.
The CCF method had the highest effect of sharpening than the other methods in both phantom study and microvascular imaging, indicating that was the most sensitive method to phase differences. However, in the B-mode MAP images of the phantom study, the diameter of the phantom was thinner than 100 μm at all depths. Furthermore, in microvascular imaging of human skin, the continuity of the vessels was partially lost, resulting in a rough image. That was because even a small phase difference could cause excessive signal suppression in the CCF method for transducers with a small number of elements, such as the annular array transducer used in this system. In particular, in the case of microvascular imaging, the system was more influenced by the noise from the surrounding tissue, which might cause excess phase differences. 26,27) The CCF method might have a positive effect on multi-element transducers because of its high sensitivity in capturing the phase differences.
The results in Sects. 4.1 and 4.2 suggested that the PCF and VCF methods were effective methods for sharpening and noise suppression for our system. In a previous study, 18) the PCF method was reported to have no advantage over the CCF and the VCF methods as it assumes that the phase of the signal is between −π and +π, and a phase discontinuity near ±π may cause artifacts in the image. Nevertheless, such problem was not confirmed in our system performing MAP visualization, suggesting that both the PCF and the VCF methods were effective in suppressing noise components and clearly visualizing the vascular structure. In the future, it is necessary to evaluate the effects of the PCF and the VCF methods more precisely using a variety of in vivo data.
6. Conclusions
In this study, we quantitatively evaluated the efficacy of five coherence factor weighting methods on improving the image quality of an annular array PAM. Each coherence factor method was tested by acquiring PA data from a microtube phantom and the cutaneous microvasculature both in B-mode and C-mode.
In the phantom study, the diameter of the visualized microtube in B-mode and C-mode was sharpened by applying any coherence factor, and the effect was significant especially in B-mode. Among the coherence factor methods applied in this study, the CCF method had the largest sharpening effect in B-mode, but the phantom diameter was visualized thinner than the original diameter in B-mode. In addition, the SCF method had a small effect of sharpening for C-mode images.
In microvascular imaging, the evaluated vessel was found to be sharpened by from 10% to 31% depending on the type of coherence factor applied to the data. The PCF and the VCF method were more effective in suppressing noise components and clearly visualizing the vascular structure than the other coherence factors.
In conclusion, among the five coherence factors tested in this study, the PCF and the VCF methods were more effective to clearly visualize the microvascular structure in terms of vessel sharpening and noise suppression performances. In the future, the DAS and PCF/VCF methods will be used to visualize the frequency-dependent anatomical vascular structure. 28–30)