
Abstract
The elastic modulus of tissue as a useful biomarker of disease detection can be quantitatively evaluated based on shear wave speed (SWS) measurements in shear wave elastography. Although the longitudinal wave speed (LWS) is also expected to be a promising biomarker for disease detection, the elasticity is not always dominant because the LWS is affected by the bulk modulus. In other words, LWS and SWS may reflect different tissue properties. Therefore, in this study, based on the improvement in LWS measurement, the relationship between the composition of a phantom mixed with agar and glycerol and ultrasonically measured LWS and SWS was investigated. The LWS had a good sensitivity in detecting glycerol, while the SWS had a good sensitivity in detecting agar. The calculated Poisson's ratio had a better sensitivity in detecting agar. In conclusion, a simultaneous measurement of LWS and SWS may help identify the tissue composition.
Export citation and abstract BibTeX RIS
1. Introduction
The elastic modulus of tissue as a useful biomarker of disease detection can be quantitatively evaluated based on shear wave speed (SWS) measurements in shear wave elastography (SWE). The longitudinal wave speed (LWS), also referred to as the speed of sound (SOS), is also expected to be a promising biomarker of disease detection. 1–4) For example, the LWS correlates with the elasticity and water content of cartilage tissues. 5–7) Therefore, methods of measuring and imaging the LWS have been studied. Ultrasonic computed tomography (CT) 8) and reflective CT 9) are typical examples. A multi-modal method that combines magnetic resonance imaging and pulse-echo ultrasound has been proposed as a direct measurement method for the LWS in vivo. 10–12) The SOS distribution of tissue sections using an acoustic microscope was also visualized with a high resolution. 13) In particular, there are many trials with respect to methods using the backscattered wave because handheld probes are available as well as the SWE technology and are suitable for clinical application. 14–27) Verification of the usefulness of LWS as a biomarker is an important research topic as with the establishment of an accurate measurement of LWS. Because the LWS is affected by the bulk modulus, water content, and molecular level factors, the effect of stiffness is not always dominant. Therefore, the LWS and SWS may reflect different tissue properties, and thus a simultaneous measurement of LWS and SWS may help identify the tissue composition.
So far, using a phantom with a composition containing glycerol and agar, we evaluated whether the LWS may reflect a different composition from that for the SWS. Although the SWS could not be used to discriminate the glycerol weight concentration contained in the phantom, the LWS could discriminate the glycerol weight concentration. 28) Conversely, although the LWS could not be used to discriminate agar weight concentration, the SWS could discriminate agar weight concentration. 29) However, these were preliminary studies using phantoms with three limited types of compositions. Experimental studies using phantoms with a wide range of compositions have not been carried out. In addition, the influence of the measurement accuracy of LWS and SWS has not been investigated and comparison to reference values has not been carried out.
Therefore, in this study, to verify the hypothesis that ultrasonically measured LWS and SWS reflect different composition information, experiments using phantoms with a wide range of compositions with respect to LWS and SWS measurements were carried out. After improving the measurement accuracy of LWS so that a wide range of LWS can be measured, the LWS and SWS were ultrasonically measured for 21 combinations of agar and glycerol weight concentrations contained in cylindrical phantoms intended for isotropic wave propagation. The Poisson's ratio was also calculated and the feasibility of identifying compositions by these indices was investigated. The correctness of each measurement of LWS and SWS was confirmed by comparison to the LWS and Young's modulus separately measured in cut-out samples. The novelty of this study is that the simultaneous measurement of LWS and SWS was realized based on the improvement in the measurement accuracy of LWS and its usefulness was verified by a phantom experiment.
2. Materials and methods
2.1. Phantom preparation and measurement setup
Table I shows the compositions of the agar-glycerol phantoms. 21 cylindrical homogeneous phantoms (diameter: 80 mm, height: 80 mm) were prepared by combining agar (24440-1250, Junsei Chemical Co., Ltd., Japan) and glycerol (17029-70, Kanto Chemical Co., Inc., Japan). The weight concentration of agar was determined primarily to change the stiffness or SWS, while the weight concentration of glycerol was determined primarily to change the LWS. A 0.4-wt% polyethylene powder (10239, Avocado Research Chemicals Ltd., UK) was uniformly mixed as a scatterer in all phantoms.
Table I. The compositions of the agar-glycerol phantoms. 21 cylindrical homogeneous phantoms were prepared by combining agar and glycerol. A 0.4-wt% polyethylene powder was uniformly mixed as a scatterer in all phantoms.
| Compositions | Weight concentration (wt%) |
|---|---|
| Agar | 1.3, 1.7, 2.1, 2.8, 3.4 |
| Glycerol | 0, 10, 20, 30, 40 |
| Polyethylene powder | 0.4 |
Figure 1 shows the setup of the phantom experiment to ultrasonically measure the LWS and SWS. A homogeneous agar-glycerol phantom was placed on a sound absorber with a thickness of 10 mm, and then a linear array probe (L7-4, Philips, USA; 5.2 MHz, 128 channels, element pitch: 0.298 mm) for the LWS and SWS measurements was placed on the upper surface of the phantom. Using an ultrasound research platform (Vantage 64LE, Verasonics, USA), push pulses for the shear wave generation were transmitted and channel data for the LWS and SWS measurements were collected. The temperature inside the phantom at the time of measurement was 26.3 ± 0.1 °C. The measurement procedure used in the experiment was as follows.
- (1)SWS measurement by push pulse transmission (6 times).
- (2)LWS measurement by horizontally inserting a wire with a diameter of 0.65 mm at a depth of approximately 20 mm (6 times).
- (3)Cut out a sample (50 mm × 50 mm × 15 mm).
- (4)LWS measurement by a pulse transmission method (reference value).
- (5)Density measurement using a specific gravity meter (reference value).
- (6)Young's modulus measurement by a compression test (reference value).
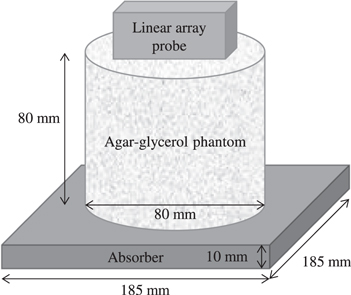
Fig. 1. The setup of the phantom experiment to ultrasonically measure the LWS and SWS. A homogeneous agar-glycerol phantom was placed on a sound absorber with a thickness of 10 mm, and then a linear array probe for the LWS and SWS measurements was placed on the upper surface of the phantom.
Download figure:
Standard image High-resolution image2.2. SWS measurement
As shown in Fig. 2(a), a single push pulse with a frequency of 5.2 MHz and duration of 192 μs (= 1000 cycles) was transmitted toward a geometric focal depth of 15 mm by exciting 32 central elements of the L7-4 probe at 39.5 V. The focal depth of 15 mm corresponds to the conversion distance when a value of 1540 m s−1 was assumed. Subsequently, the propagation of shear waves was visualized by transmitting plane waves and tracking particle displacements within a region of interest (ROI) with a width of 24 mm and height of 15 mm. The pulse repetition interval (PRI) between tracking frames was set to 100 μs. 30) As shown in Fig. 2(b), the position and time of the peak of the shear wave were tracked along the direction perpendicular to the propagation direction of the push pulse. Finally, the SWS was measured using the time of flight (TOF) method, 31,32) which calculates the proportionality coefficient between the travel time and travel distance, as shown in Fig. 2(c).

Fig. 2. (Color online) SWS measurement based on the TOF method. (a) A single push pulse with a frequency of 5.2 MHz and duration of 192 μs (= 1000 cycles) was transmitted toward a geometric focal depth of 15 mm (which corresponds to the conversion distance when a value of 1540 m s−1 was assumed) by exciting 32 central elements of the L7-4 probe at 39.5 V. Subsequently, shear waves were generated and tracked at a PRI of 100 μs within an ROI with a width of 24 mm and a height of 15 mm. (b) The position and time of the peak of the shear wave were tracked along the direction perpendicular to the propagation direction of the push pulse. (c) Determination of SWS based on the proportionality coefficient between the travel time and travel distance.
Download figure:
Standard image High-resolution image2.3. LWS measurement
The LWS was measured using the Focusing method used in previous studies.
33) However, as there was a measurement error due to the horizontal misalignment between positions of the central element and wire target,
33) it was not possible to measure the LWS with a uniform accuracy for a wide range of LWS. Therefore, in this study, a minor improvement in correcting this misalignment was added. Figure 3 shows the geometrical positional relationship between the channel element and wire target. When the wire is not directly under the central element, the LWS measurement is performed by adding the variable  to determine the position of the virtual central element. The delay time with this added
  is
is
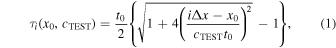
where  is the appearance time of the wire echo received in the central element,
  is the channel number,
  is the element pitch,
  is the test value of the LWS (test LWS), and
  is the delay time given to the
  th channel. As shown in Eq. (2), the envelope of the aperture synthesis wave of the channel RF data
  corrected for the time delay with
  is then calculated. In the time range of
  including the appearance time of the wire target echo, (

 ), which results in the maximum amplitude of the envelope of the aperture synthesis wave, is searched. Finally, at this time
  is determined as the estimated value
  of the LWS.

where  is the number of all channels and
  is the operation to calculate the envelope. The LWS was measured by varying the test LWS from 1300 to 1800 m s−1 in increments of 1 m s−1.
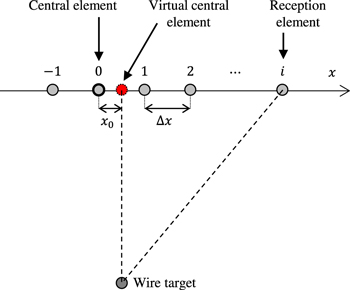
Fig. 3. (Color online) The geometrical positional relationship between the channel element and wire target in the improved Focusing method.
Download figure:
Standard image High-resolution image2.4. Reference parameter measurements
For comparison, the LWS, density, and Young's modulus of the cut-out samples were measured. The LWS of the sample was measured using a method based on the pulse transmission method. 34) The density was measured using a specific gravity meter (MD-300S, Alpha Mirage, Japan) based on Archimedes' principle. The density of water was assumed to be 1 g cm−3. Young's modulus was measured by a compression test using a universal testing machine (AG-500NX, Shimadzu, Japan). Using a circular compressor with a diameter of 50 mm and load cell with a load capacity of 500 N and resolution of 1/1000, the slope of the force-displacement line was calculated when the sample was compressed at a crosshead speed of 1 mm min−1. Young's modulus was then calculated based on the dimensions of the cut-out sample.
3. Results
3.1. SWS
Figure 4 shows the SWS measurement process for each combination of agar and glycerol weight concentrations. Figures 4(a) and 4(b) show snapshots of the shear wave propagation inside the ROI shown in Fig. 2(a) at 0.5 ms after the push pulse was transmitted. Figure 4(a) compares the propagation distances of the shear wave with respect to the weight concentration of agar, while Fig. 4(b) compares the propagation distances of the shear wave with respect to the weight concentration of glycerol. The red circle indicates the position of the peak amplitude of the shear wave propagating from the focal point on the horizontal blue line. The contrast of these shear wave images differs between phantoms because the peak amplitude of the shear wave decreases owing to the effects of the distance attenuation corresponding to the weight concentration of agar and absorption corresponding to the weight concentration of glycerol. As the weight concentration of agar increases, the propagation distance at 0.5 ms increased and the SWS was expected to increase. However, there was no remarkable difference in the propagation distance with respect to the weight concentration of glycerol. Figures 4(c) and 4(d) show the relationship between the travel time and travel distance of the shear wave. In Fig. 4(c), the slope increased as the agar weight concentration increased under a constant glycerol weight concentration, whereas, in Fig. 4(d), the slope seemed to be independent on the glycerol weight concentration under a constant agar weight concentration.

Fig. 4. (Color online) The SWS measurement process for each combination of agar and glycerol weight concentrations. (a) and (b) show snapshots of the shear wave propagation inside the ROI shown in Fig. 2(a) at 0.5 ms after the push pulse was transmitted and they compare the propagation distances of the shear waves with respect to the weight concentrations of agar and glycerol, respectively. The red circle indicates the position of the peak amplitude of the shear wave propagating from the focal point on the horizontal blue line. (c) and (d) show the relationship between the travel time and travel distance of the shear wave and they compare the slopes of the linear lines with respect to the weight concentrations of agar and glycerol, respectively.
Download figure:
Standard image High-resolution imageFigure 5 summarizes the relationship between the measured SWS and each weight concentration of agar and glycerol. The SWS measurement was repeated six times. The mean and standard deviation were calculated and are presented by error bars. As shown in Fig. 5(a), the SWS increased according to the weight concentration of agar, while the SWS was almost constant with respect to the weight concentration of glycerol, as shown in Fig. 5(b). Figure 5(c) compares the SWS converted from the Young's modulus  using Eq. (3) and measured SWS. The Poisson's ratio was assumed to be 0.5. The results of Fig. 10, described later, were used as the density
  Both were in good agreement, which confirms that the SWS was reasonably measured.


Fig. 5. (Color online) The relationship between the measured SWS and each weight concentration of agar and glycerol. The SWS measurement was repeated six times. The mean and standard deviation are presented by error bars. (a) The relationship between the SWS and weight concentration of agar. (b) The relationship between the SWS and weight concentration of glycerol. (c) compares the SWS converted from the Young's modulus using Eq. (3) and measured SWS.
Download figure:
Standard image High-resolution image3.2. LWS
Figure 6 shows the LWS measurement process for each combination of agar and glycerol weight concentrations. Figures 6(a) and 6(b) show the Focusing maps obtained on the right side of Eq. (2). The horizontal axis shows the test LWS  while the vertical axis shows the range of
 ![$\left[{T}_{1},{T}_{2}\right]$](https://content.cld.iop.org/journals/1347-4065/61/SG/SG1023/revision2/jjapac45d5ieqn22.gif) at time
at time  Figure 6(a) shows the Focusing map with respect to the weight concentration of agar, while Fig. 6(b) shows the Focusing map with respect to the weight concentration of glycerol. The redder part in the Focusing map corresponds to a larger amplitude of the aperture synthesis wave, while
  which exhibits the maximum amplitude, corresponds to
  Figure 6(c) shows the maximum aperture synthesis wave with respect to the change in the agar weight concentration under a constant glycerol weight concentration, while Fig. 6(d) shows that with respect to the change in the glycerol weight concentration under a constant agar weight concentration. Contrary to the case of SWS, the LWS hardly changed when the agar weight concentration changed, while the LWS tended to change significantly when the glycerol weight concentration changed.
Fig. 6. (Color online) The LWS measurement process for each combination of agar and glycerol weight concentrations. (a) and (b) show the Focusing maps obtained on the right side of Eq. (2), with respect to the weight concentrations of agar and glycerol, respectively. The horizontal axis shows  and the vertical axis shows the range of
 ![$\left[{T}_{1},{T}_{2}\right]$](https://content.cld.iop.org/journals/1347-4065/61/SG/SG1023/revision2/jjapac45d5ieqn27.gif) at time
at time  The redder part in the Focusing map corresponds to a larger amplitude of the aperture synthesis wave. (c) and (d) show the maximum aperture synthesis waves with respect to the changes in the agar and glycerol weight concentrations, respectively.
Download figure:
Standard image High-resolution imageFigure 7 summarizes the relationship between the measured LWS and each weight concentration of agar and glycerol. The LWS measurement was repeated six times. The mean and standard deviation were calculated and are presented by error bars. As shown in Fig. 7(a), the LWS was almost constant with respect to the weight concentration of agar, while the LWS increased in proportion to the glycerol weight concentration, as shown in Fig. 7(b). Figure 7(c) compares the values to the LWS reference value measured using the pulse transmission method. Both were in good agreement, which confirms that the LWS was reasonably measured.

Fig. 7. (Color online) The relationship between the measured LWS and each weight concentration of agar and glycerol. The LWS measurement was repeated six times. The mean and standard deviation are presented by error bars. (a) The relationship between the LWS and weight concentration of agar. (b) The relationship between the LWS and weight concentration of glycerol. (c) compares the values to the LWS reference value measured using the pulse transmission method.
Download figure:
Standard image High-resolution image3.3. Effect of measurement accuracies of SWS and LWS
Figure 8 compares the measured SWS and LWS when (agar, glycerol) = (1.3 wt%, 0 wt%), (2.1 wt%, 0 wt%), and (1.3 wt%, 20 wt%). The error bar represents the standard deviation, i.e. the measurement error, for six measurements. This comparison was carried out because the effects of measurement errors must be considered in assessing the detectability of difference in composition by each index (SWS and LWS). Figure 8(a) shows the detectability of differences in agar and glycerol weight concentrations by the SWS. There was a significant difference in agar weight concentration, but not in glycerol weight concentration. Figure 8(b) shows the detectability of the difference in agar weight concentration and glycerin weight concentration by the LWS. Conversely, there was no significant difference in agar weight concentration, but there was a significant difference in glycerol weight concentration.

Fig. 8. The comparisons of the measured SWS and LWS when (agar, glycerol) = (1.3 wt%, 0 wt%), (2.1 wt%, 0 wt%), and (1.3 wt%, 20 wt%). The error bar represents the standard deviation, i.e. measurement error, for six measurements. (a) shows the detectability of difference in agar and glycerol weight concentrations by the SWS. (b) shows the detectability of difference in agar weight concentration and glycerin weight concentration by the LWS.
Download figure:
Standard image High-resolution image3.4. Calculation of the Poisson's ratio
The Poisson's ratio can be calculated using both LWS and SWS. The feasibility of identifying the compositions of the phantom by calculating the Poisson's ratio was evaluated. The Poisson's ratio ν was calculated by

Figure 9 shows the results of the calculated Poisson's ratio. Figure 9(a) shows the results of the difference in the agar weight concentration, while Fig. 9(b) shows the results for different glycerol weight concentrations. The Poisson's ratio tended to decrease as the agar weight concentration increased and increased as the glycerol weight concentration increased. However, Poisson's ratio seemed to be more sensitive to the agar weight concentration.
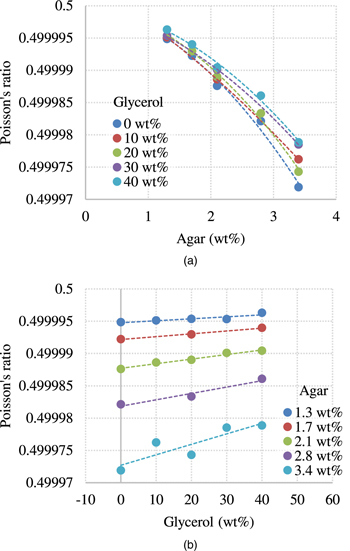
Fig. 9. (Color online) The results of the calculated Poisson's ratio. (a) shows the results of the difference in the agar weight concentration. (b) shows the results for different glycerol weight concentrations.
Download figure:
Standard image High-resolution image4. Discussion
As shown by the results in Figs. 5 and 7, the changes in LWS and SWS with respect to changes in agar and glycerol weight concentrations had the opposite trend. The sensitivity to changes in agar weight concentration was higher for the SWS, while the sensitivity to changes in glycerol weight concentration was higher for the LWS. As shown in Fig. 9, the Poisson's ratio also appeared to be sensitive to changes in agar weight concentration. Table II shows the rates of change in the LWS, SWS, and Poisson's ratio per unit weight concentration of agar and glycerol, which confirm the above trend. As shown in Fig. 8, the detection sensitivity to the composition needs to be evaluated in consideration of the measurement accuracy of the LWS and SWS. As a result, while the LWS measured by the Focusing method did not have the ability to discriminate the agar weight concentration, it had the ability to discriminate the glycerol weight concentration. Moreover, while the SWS measured by the TOF method did not have the ability to discriminate the glycerol weight concentration, it had the ability to discriminate the agar weight concentration. The Poisson's ratio was superior in discriminating the agar weight concentration. Therefore, the hypothesis that ultrasonically measured LWS and SWS reflect different composition information was verified by a demonstration using agar-glycerol phantoms.
Table II. The rate of change in the LWS, SWS, and Poisson's ratio per unit weight concentration of agar and glycerol.
| LWS | SWS | Poisson's ratio | |
|---|---|---|---|
| Agar | 1.95 | 3.31 | 9.2 × 10 −6 |
| Glycerol | 4.68 | 2.42 × 10 −3 | 8.2 × 10 −8 |
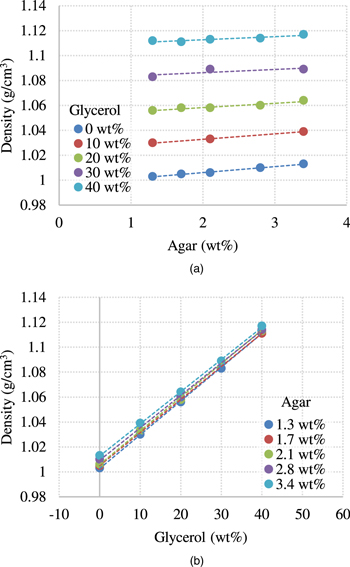
The origins of these results are discussed below. Figure 10 shows the results of density measurements. Figure 10(a) shows the change in density with changes in the agar weight concentration under a constant glycerol weight concentration, while Fig. 10(b) shows the change in density with changes in glycerol weight concentration under a constant agar weight concentration. As the weight concentration increased, the density increased. However, because the density acts as a denominator of LWS and SWS, it is not likely that the density provides a positive correlation with the results shown in Figs. 5 and 7.
Fig. 10. (Color online) The results of density measurements. (a) shows the change in density with changes in the agar weight concentration under a constant glycerol weight concentration. (b) shows the change in density with changes in glycerol weight concentration under a constant agar weight concentration.
Download figure:
Standard image High-resolution image
As shown in Fig. 8, although the addition of glycerol clearly increased the LWS, no significant effect on SWS was observed. Budelli et al. analyzed low-frequency shear waves (center frequency: 300 Hz) using glycerol-added phantoms and reported that, although 10% glycerol had a higher loss modulus than that of 0% glycerol, there was no significant difference between the SWS measurements. 35) For the dispersion curve widely used in the viscoelasticity analysis of SWE, 32) the contribution of viscosity to SWS is small in the low-frequency region of the shear wave. Therefore, in the case of the measurement error of SWS, it may be reasonable that no significant difference appears between SWSs in the media with and without viscosity. The maximum frequency of the shear wave generated in this study was approximately 400 Hz, which is consistent with the results of Budelli et al. In other words, the viscosity of glycerol may have a smaller effect than that of the variation of SWS measured by the TOF method.
Another possibility is that the difference in composition affects LWS and SWS. It is considered that the agar-glycerol phantom used in this study has a structure in which the structural strength is maintained by the cross linking of agar and the space between the crosslinks is filled with water and glycerol. If the shear wave does not propagate in water and glycerol, the SWS may be mainly determined by the composition of the agar. In addition, the content of glycerol in phantoms containing glycerol has almost no effect on the Young's modulus. 36) The LWS may be affected by agar, glycerol, and water, while the LWS in a large-volume solvent portion may become dominant.
According to the above discussion, the LWS and SWS may reflect different tissue properties and thus a simultaneous measurement of LWS and SWS may be useful to identify the tissue composition.
In conventional elastography, tissues are assumed to be solid with elasticity or viscoelasticity. However, some tissues exhibit poroelasticity. Poroelastic materials are materials in which the deforming solid matrix is saturated with fluid. Simultaneous measurements of LWS and SWS may provide useful diagnostic information for such tissues. In addition, Konofagou et al. introduced the Poisson's ratio as an index to evaluate the poroelasticity of tissues. 37) Although they calculated the Poisson's ratio from the ratio of axial and lateral strain components under static deformation, it may be challenging to carry out a stable calculation using real data. On the other hand, as shown in Fig. 9, the Poisson's ratio calculated from the LWS and SWS seems to be stably obtained reflecting the composition. Therefore, the Poisson's ratio may also provide useful diagnostic information.
5. Conclusions
The LWS measured by the Focusing method did not have the ability to discriminate the agar weight concentration, while it had the ability to discriminate the glycerol weight concentration. In addition, the SWS measured by the TOF method did not have the ability to discriminate the glycerol weight concentration, while it had the ability to discriminate the agar weight concentration. The Poisson's ratio obtained by the simultaneous measurement of LWS and SWS was superior in discriminating the agar weight concentration. The hypothesis that ultrasonically measured LWS and SWS reflect different composition information was verified by a demonstration using agar-glycerol phantoms. Furthermore, the relationship between the phantom composition and measured LWS and SWS suggested that the simultaneous measurement of LWS and SWS may be useful in identifying the tissue composition. In the future, we will verify the clinical merits of simultaneous measurement of LWS and SWS by ex vivo experiments using animal tissues such as liver tissues.
Acknowledgments
This work was partly supported by JSPS KAKENHI (Grant No. 19H04494).