
Abstract
This study evaluates the accuracy of demodulated sound measurements using a condenser microphone in the near field of a parametric loudspeaker system. Microphones with different sensitivities placed at incidence angles of 0° and 90° were used to measure demodulation frequency components without special acoustic filters. The measured components were compared with theoretical predictions. The results show that the measured sound pressure using microphones placed at 0° was up to several tens of decibels larger than the theoretical predictions and significantly inaccurate in the near field. This was due to the nonlinear response of the microphone, which had high sensitivity at primary sound frequencies, inducing spurious signals. This result suggests that using a microphone with low sensitivity at primary sound frequencies placed at an appropriate angle that reduces sensitivity improves parametric sound measurement accuracy.
Export citation and abstract BibTeX RIS
1. Introduction
The radiation of finite-amplitude primary ultrasound waves, such as ultrasound with two or more frequency components or modulated by a low-frequency signal, produces higher harmonic and low-frequency components as secondary waves due to the nonlinearity of the medium. This low-frequency sound, called demodulated or parametric sounds, is not directly radiated from the sound source. It increases accumulatively with the propagation of primary waves, similar to the situation for an end-fire array antenna. A parametric acoustic array 1) based on this phenomenon has sharp directivity compared with that of sound at the same low frequency directly radiated from a sound source with the same aperture size. A parametric acoustic array has been applied to underwater sonar sources 2) and measurements. 3–7)
A parametric array can be applied for audible sound generation in air as a parametric loudspeaker. 8,9) Conventional parametric loudspeakers are used for announcements in public spaces such as train stations and museums to transmit information in a specific direction. Parametric loudspeakers have recently been considered for personal use, such as realizing private sound spaces. 10–12) In addition, the parametric effect has been applied in the development of an omnidirectional audible sound source, 13) and the active use of this effect in a near field has also been investigated. 14)
To develop a parametric loudspeaker system that consists of modulators, power amplifiers, and ultrasonic emitters, we need to evaluate the demodulated sound transformed from primary ultrasound waves using theoretical prediction and measurements. Although many studies 15–20) on parametric loudspeakers have found good agreement between theoretical predictions and measurements, the comparisons were mainly made in the far field of primary ultrasound waves. The sound pressure amplitude of a demodulated sound is ideally 0 Pa at the sound source and small in the near field. It increases accumulatively with the propagation of primary waves. The measured sound pressure is sometimes higher than the theoretical value in the near field. 21–23) However, there is little quantitative data on deviation from the correct values in measurements.
This discrepancy in the near field is thought to be due to spurious signals induced by the nonlinear response of a microphone diaphragm exposed to finite-amplitude ultrasound and that of connected electronic devices and pseudo sounds caused by the acoustic radiation pressure acting on the diaphragm. 21,22,24–31) For example, a condenser microphone transforms the variation of gap distance between the vibrating diaphragm and the backplate into an electrical signal. Assuming that the gap variation is small, the output signal of the microphone is proportional to the sound pressure of the incoming sound wave. However, high-amplitude sound waves break down the linear response of the microphone and thus generate distorted signals. 32) The radiation pressure acting on an object in a sound field is proportional to the acoustic energy density of the incident wave. When modulated ultrasound waves are used, as in parametric loudspeakers, unwanted output signals from a microphone, which are not present in the sound field, may be observed. 21,22)
Unexpected signals can be avoided by adjusting the receiving sensitivity of a microphone depending on the incidence angle of sound waves. 27) Receiving only low-frequency demodulated sound is also effective. This can be realized using an acoustic filter that reduces the reach of finite-amplitude primary ultrasound waves to a microphone. Several acoustic filters have been developed for this purpose, such as a dome shape filter, 24) a plate-type filter, 28) and a phononic crystal with a periodic structure. 25,29) Most of the filters were designed for plane wave incidence and are thus effective in the far field, where the wavefront of primary sound is relatively simple. However, such filters may disturb the complex sound field in near-field regions. As a result, they may not shield the primary components sufficiently. To discuss the effectiveness of the filters, it is necessary to determine how the measured values deviate from the correct values in measurements without the filters. However, this has not been sufficiently studied.
The purpose of this study is to investigate the accuracy of parametric sound measurement. We have already shown the quantitative comparison between experimental and theoretical values in Ref. 23, although we did not discuss the details of measurement error and inaccuracy. In order to discuss the details, in this paper, experimental and theoretical results are compared to evaluate the effects of microphone size, placement, sensitivity, distance from the sound source, and primary sound pressure on the measurement of the demodulation signal. First, we measure the parametric sound fields at several frequencies and sound source pressure conditions with several types of condenser microphones. Then, we calculate the difference between measured and theoretical values (i.e. the measurement error) and the relationship between this difference and the primary sound pressure product to determine the accuracy of the measurements. Finally, we discuss an appropriate microphone for measuring the demodulated sound from a parametric loudspeaker. We investigate measurement accuracy under the assumption that the theoretical values are correct, which is a limitation of this study.
2. Method
2.1. Theoretical prediction
To evaluate the measurement accuracy, we use theoretical prediction as a reference. Many studies 12,15,33–36) have carried out nonlinear sound propagation analyses for generating harmonics and parametric sound. Although the Khokhlov–Zabolotskaya–Kuznetsov equation is often used for theoretical prediction, 15) this equation is only applicable in a field relatively distant from the emitter due to the parabolic approximation of nonlinear sound wave equation. For example, the application for a 130 mm diameter emitter at 40 kHz is valid for a distance greater than 0.24 m away from the emitter.
Since our region of interest included the near field of the emitter in this study, we used a direct numerical solution applicable in the near field for nonlinear sound propagation. The theoretical prediction is based on a numerical simulation with nonlinear full-wave modeling, 12) which includes the conservations of mass, momentum, and entropy, and the equation of state. These equations were coupled and numerically solved in the time domain. The details of numerical simulation is described in Ref. 12.
2.2. Experiment
We measured primary ultrasound waves radiated from an ultrasonic emitter and demodulated audible sounds with several microphones. We compared these measurements with theoretical predictions to evaluate the effects of microphone characteristics on measurement results.
Figure 1 shows the experimental setup used for the sound field measurement. Signals for driving the emitter were generated by an arbitrary waveform generator (NF WF1966) and amplified by a power amplifier (Victor PS-A2002). In order to generate parametric sound at fm = 2, 4, and 6 kHz, the emitter radiated ultrasound at frequencies of fc = 40 kHz and fc + fm

where t is the time and ωc = 2π fc and ωm = 2π fm are the carrier and modulation angular frequencies, respectively. P1s and P2s are the root-mean-square values of sound pressure at fc and fc + fm, respectively.
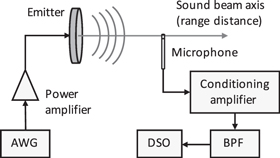
Fig. 1. Experimental setup used for sound field measurement (AWG: arbitrary waveform generator, BPF: band-pass filter, DSO: digital storage oscilloscope).
Download figure:
Standard image High-resolution imageWe used a hexagonal ultrasonic emitter, shown in Fig. 2, that consisted of 127 close-packed ultrasonic sensors (Murata MA40S4S) with a diameter of 10 mm and a resonance frequency of 40 kHz. The diameters of the circumscribed and inscribed circles of the hexagonal emitter are 130 and 112 mm, respectively. The driving voltage of the emitter was adjusted so that the sound pressure of the ultrasounds at fc and fc + fm was 128 dB for low sound pressure condition, or was 133 dB for high sound pressure condition at 0.4 m from the emitter, where the primary sounds had the highest pressure. The estimated sound pressures on the radiation surfaces were P1s = 123 dB and P2s = 125 dB for low sound pressure and P1s = 128 dB and P2s = 130 dB for high sound pressure.

Fig. 2. (Color online) Photograph of the ultrasonic emitter with 127 close-packed ultrasonic sensors.
Download figure:
Standard image High-resolution imageTable I shows the four microphones used in this study, namely a 1/4 inch (6.35 mm) free-field microphone (1/4'' FF; GRAS 40BF), a 1/4 inch pressure-field microphone (1/4'' PF; GRAS 40BP), a 1/2 inch (12.7 mm) free-field microphone (1/2'' FF; Brüel and Kjær 4190), and a 1/2 inch pressure-field microphone (1/2'' PF; Brüel and Kjær 4192). We used these microphones equipped with a protection grid, which affects microphone response in ultrasonic frequency ranges. 37) Microphone sensitivity (frequency response) depends on the incidence angle θinc of sound onto the diaphragm (Fig. 3) (see Fig. A·1). Microphones were placed on the sound beam axis of the emitter at θinc = 0° and 90°. Although dynamic microphones reduce the generation of spurious signals in parametric sound measurements, 38) we used condenser microphones because the sensitivity characteristics are given by the manufacturers, and it is suitable for quantitative measurements.
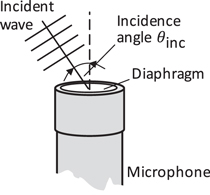
Fig. 3. Incidence angle of the sound wave onto microphone diaphragm. 23)
Download figure:
Standard image High-resolution imageTable I. Microphones used in experiments. The sensitivity is the typical sensitivity at 250 Hz. The frequency range is the frequencies at which the sensitivity variation is within ±1 dB.
| Mic | Size | Field | Manufacture | Mic | Pre- | Sensitivity | Frequency |
|---|---|---|---|---|---|---|---|
| (inches) | type | cartridge | amplifier | (dB re 1 V/Pa) | range (kHz) | ||
| 1/4'' FF | 1/4 | Free field | GRAS | 40BF | 26AC | −48.4 | 0.01–40 |
| 1/4'' PF | 1/4 | Pressure field | GRAS | 40BP | 26AC | −56.5 | 0.01–25 |
| 1/2'' FF | 1/2 | Free field | Brüel and Kjær | 4190 | 2669 | −26.4 | 0.005–10 |
| 1/2'' PF | 1/2 | Pressure field | Brüel and Kjær | 4192 | 2669 | −37.9 | 0.005–7 |
Before the measurements, we calibrated the microphones using a pistonphone (Brüel and Kjær 4220). Preliminary experiments, which measured the sound pressure of audible sounds radiated from a dynamic loudspeaker (see appendix), indicated that the maximum variation for a given microphone was about 0.3 dB. The maximum variability between microphones was about 1.1 dB. The following results include these inaccuracies.
In this study, the following experiments and evaluations were carried out.
2.2.1. Sound field measurement
We measured primary sounds along the sound beam axis of the emitter at fc and fc + fm with 1/4'' PF placed at θinc = 90°, and demodulated sounds at fm with all microphones (see Table I) placed at θinc = 0° and 90°.
The output signal of a microphone was sent to a digital storage oscilloscope (Teledyne LeCroy 4024HD) via a conditioning amplifier (Brüel and Kjær 2690). We applied a band-pass filter with a 700 Hz to 12 kHz passband between the conditioning amplifier and the oscilloscope. The fast Fourier transform function of the oscilloscope was used to extract the primary sound components and low-frequency components at the modulation frequency from the observed signals.
2.2.2. Measurement inaccuracy
To estimate the inaccuracy of the demodulated sound measurements, we compared the measured values with the theoretical values under the assumption that the theoretical values were correct. We define inaccuracy as the ratio (Pmeas − Ptheory)/Pmeas, where Pmeas (Pa) and Ptheory (Pa) are the measured and theoretical values of the modulation frequency components, respectively.
2.2.3. Relationship between measurement error and primary sound pressure product
The measurement error is thought to be caused by the nonlinear response of a microphone exposed to a finite-amplitude of ultrasound. We evaluated the relationship between the measurement error of modulation frequency component Pmeas − Ptheory and the primary sound pressure product P1 P2, where P1 and P2 are the root-mean-square values of measured sound pressures at fc and fc + fm, respectively.
3. Results
3.1. Sound field measurement.
Figure 4 shows the measured and theoretical values of primary ultrasound waves at fc = 40 kHz and fc + fm radiated from the emitter and demodulated sound at fm = 2, 4, and 6 kHz generated from the nonlinear propagation of the primary sound waves. The measured values well agree with the theoretical values of primary ultrasound waves for all sound source pressures and modulation frequencies.

Fig. 4. (Color online) Measured and theoretically predicted sound fields of primary ultrasound at fc = 40 kHz and fc + fm and demodulated sound at fm = 2, 4, and 6 kHz. Angles 0° and 90° are incidence angles θinc of ultrasound onto the microphone diaphragm.
Download figure:
Standard image High-resolution imageThe microphone characteristics affect the low-frequency components at the modulation frequency fm. Overall, the measured values are larger than the theoretical values. For all frequencies, the measured sound pressure at θinc = 0° exceeds that at 90°. The maximum deviation from the theoretical values is 40 dB for 0° and 15 dB for 90° at peak locations (0.13 and 0.4 m) of the primary ultrasound. The deviation becomes small at the dip location (0.2 m). With increasing distance, both measured values approach the theoretical values. The results for 1/2'' PF placed at 0° had the most significant deviation and those for 1/2'' PF placed at 90° were closest to the theoretical values.
The theoretical predictions show that the demodulated sounds are lower for low frequencies and higher for high frequencies. The frequency dependence of measured values for an incidence angle of 90° qualitatively agrees with the theory. However, that tendency is not observed for 0°, and the maximum pressure is almost constant. The constant value is 100 dB for P1s = 123 dB and P2s = 125 dB and 110 dB for P1s = 128 dB and P2s = 130 dB.
3.2. Measurement inaccuracy
Figure 5 shows the inaccuracy (Pmeas − Ptheory)/Pmeas of the modulation frequency component in the measurements, based on the measurements described in Sect. 3.1. A large inaccuracy indicates that the measurement may not be correct. Considering that the measured values exceed the theoretical values, only positive differences are plotted in the figure.
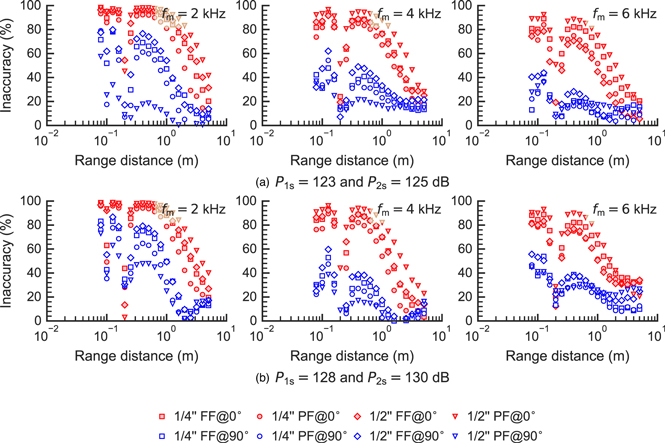
Fig. 5. (Color online) Measurement inaccuracy of modulation frequency component at fm. Angles 0° and 90° are incidence angles θinc of ultrasound onto the microphone diaphragm.
Download figure:
Standard image High-resolution imageThe inaccuracy for a microphone placed at θinc = 0° is close to 100% in the near field (within 1 m) except at the dip location (0.2 m) for all frequencies. Although the inaccuracy for a microphone at 90° is lower than that for a microphone at 0°, it is still high (the maximum inaccuracy is about 80% at fm = 2 kHz). As the distance from the emitter increases to beyond 1 m, the inaccuracy decreases to 20%.
Similar to the sound field measurement, the inaccuracy for 1/2'' PF at 0° is the largest and that for 1/2'' PF at 90° is the smallest.
3.3. Relationship between measurement error and primary sound pressure product
Figures 6 and 7 show the relationship between the measurement error Pmeas − Ptheory and the primary sound pressure product P1 P2 for a microphone placed at incidence angles of θinc = 0° and 90°, respectively, based on the measurements described in Sect. 3.1. The results for low (P1s = 123 dB and P2s = 125 dB) and high (P1s = 128 dB and P2s = 130 dB) sound source pressures are plotted in the figures. Similar to Fig. 5, only positive differences are plotted.
Fig. 6. (Color online) Relationship between measurement error of modulation frequency component at fm and primary sound pressure product for incidence angle θinc = 0°. Closed and open symbols are values for low (P1s = 123 dB and P2s = 125 dB) and high (P1s = 128 dB and P2s = 130 dB) sound source pressures, respectively. Dashed lines are fitting curves proportional to the nth power of the sound pressure product. n = 0.98, 0.94, 1.00, and 0.98 for (a), (b), (c), and (d), respectively.
Download figure:
Standard image High-resolution image
Fig. 7. (Color online) Same as Fig. 6, except for incidence angle θinc = 90°. n = 0.51, 0.44, 0.50, and 0.38 for (a), (b), (c), and (d), respectively.
Download figure:
Standard image High-resolution imageOverall, an increase in the primary sound pressure product increases the measurement error. For the results of 0°, the modulation frequency and sound source pressure have little effect on this error. The results for 90° in Fig. 7 show more variability than those for 0° and are slightly affected by the sound source pressure.
The dashed lines in the figures are fitting curves proportional to the nth power of the sound pressure product P1
P2, that is,  . The obtained n values are shown in Table II. The sound pressure differences for θinc = 0° are proportional to the sound pressure product at n ≃ 1. Those for 90° are proportional to the approximate square root of the sound pressure product at n ≃ 0.5.
Table II. Parameter (n) represents the relationship between measurement error of modulation frequency components and primary sound pressure product. The error is assumed to be proportional to the nth power of the sound pressure product.
| Mic | n | |
|---|---|---|
| θinc = 0° | θinc = 90° | |
| 1/4'' FF | 0.98 | 0.51 |
| 1/4'' PF | 0.94 | 0.44 |
| 1/2'' FF | 1.00 | 0.50 |
| 1/2'' PF | 0.98 | 0.38 |
4. Discussion
The measured sound pressure shown in Fig. 4 and the inaccuracies shown in Fig. 5 show that the incidence angle of the sound onto the microphone affects the measurement of modulation frequency components. Significant differences between measured and theoretical values and inaccuracies are observed at peak positions of the primary sound pressure at 0.13 and 0.4 m. The measurement error for θinc = 0° is much higher than that for 90°. This is caused by exposure to high sound pressure, not differences in the measurement distance in the sound field. This can be explained by the deviation becoming large at the peak locations of the primary sound waves and small at the dip locations. These results indicate that the measurement of the modulation frequency component with a microphone placed at 0° in the near field, especially at locations with a large sound pressure product has significant inaccuracy. In addition, the maximum measurement value for 0° is almost independent of fm in Fig. 4. It is thus possible that the microphones at 0° did not measure any demodulated sound waves in the near field.
One cause of the measurement inaccuracy is the nonlinearity of sound reception, including that of the microphone and connected electronic devices. It is assumed that the nonlinearity of a condenser microphone in measurements of parametric sound is proportional to the incident primary sound pressure product. 26,28,30) The measurement error for an incidence angle of θinc = 0° in Fig. 6 is proportional to the primary sound pressure product whereas that for 90° in Fig. 7 is not. As described later, because the microphone's sensitivity at 0° is several tens of decibels larger than that at 90° at primary sound frequencies, the large vibration of the diaphragm of the microphone placed at 0° induces significant spurious signals in the output. These spurious signals are dominant in the measured signal for 0°, and thus the sound pressure product at the measurement location determines the difference between the measured and theoretical values. This probably also explains why the observed demodulation amplitude at 0° is independent of frequency. For an incidence angle of 90°, because spurious signals are lower than those for 0°, both the pressure product and the distance-dependent demodulation affect the measurement error. As a result, the proportional relationship between the measurement error and the local sound pressure product does not hold. This also affects the variability of the measured values in Fig. 7. There is a possibility that the measurement error caused by the inaccuracy of the microphone sensitivity characteristics in Fig. A·1 affects the measurement of low-pressure waves of the demodulated sound.
Another reason for the inaccurate measurement is the effect of dynamic acoustic radiation pressure on the microphone diaphragm induced by modulated primary ultrasound. Although the radiation pressure affects the measurement with a microphone placed at 0° with respect to the incident sound, pseudo sounds due to the radiation pressure have little effect on parametric sound measurements. 25,26) To confirm this, we estimated the radiation pressure under the conditions of fm = 2 kHz, P1s = 128 dB, P2s = 130 dB, and a distance of 0.4 m. The primary sound pressures for fc and fc + fm at 0.4 m were both 133.7 dB (P1 = P2 = 96.8 Pa). The root-mean-square value of the dynamic radiation pressure for fm on an object with a sound pressure reflection coefficient Rp = 1 is

where ρ0 = 1.2 kg m−3 is the density of the medium (air) and c0 = 340 m s−1 is the speed of sound. The corresponding sound pressure level, namely 80 dB, is lower than the 100–110 dB measured with the microphone at 0° in Fig. 4. Therefore, this effect cannot explain the difference between the measured and theoretical values. The radiation pressure induced by parallel incidence sound on the diaphragm at θinc = 90° is much lower than this value, so the effect is small.
The above discussion suggests that a microphone at 90° to the incident sound more accurately measures the demodulated sound from parametric loudspeakers. In particular, the results for a 1/2 inch pressure-field microphone are close to the theoretical values. The difference between the results obtained at θinc = 0° and 90° is caused by the dependence of the microphone sensitivity on the sound incidence angle. The estimated sensitivity for 1/2'' PF at θinc = 0° for the primary sound frequency is 20 dB higher than that at 90° in Fig. A·1. This means that the displacement of the diaphragm at θinc = 0° is larger than that at 90° for a given sound field and thus induces large distortion in the output due to the nonlinear response.
In this study, we used free- and pressure-field condenser microphones of different sizes. The microphone sensitivity, rather than the difference of sound-field type, may have affected the results. Our results thus experimentally verify that using a microphone with low sensitivity at the primary sound frequency and appropriate placement in a sound field yields accurate measurements. 27)
5. Conclusions
We experimentally evaluated the effects of microphone characteristics on the demodulated audible sound measurements of parametric loudspeakers, especially in the near field of the emitter. The measurements were compared with theoretical values. The results show that the sound incidence angle onto a microphone diaphragm significantly affects the measurements. Results obtained at incidence angles of 0° and 90° were up to 40 dB and 15 dB higher than the theoretical values, respectively. The largest difference between measured and theoretical values was mainly observed within 1 m from the emitter, where the primary sound had high pressure. This measurement error is caused by the spurious signals induced from the nonlinear response of the reception of finite-amplitude primary ultrasound at the measurement location.
Under the considered conditions, we experimentally confirmed that the results obtained by a 1/2 inch pressure-field condenser microphone with low sensitivity at the primary sound frequency placed at an incidence angle of 90° agree with theoretical predictions. However, up to 80% of the measured values were not actual demodulated sound in the near field with high sound pressure.
We used theoretical values as a reference for evaluating measurements because many theoretical analyses have given results that are in reasonable agreement with measurements of nonlinear sound propagation and formed fields. 15,39–41) This may not always be valid. In addition, there is a possibility that the variability of several decibels between the used microphones affected the results.
Precise measurement and numerical analysis of microphone diaphragm vibrations in a finite-amplitude ultrasound field are required. Moreover, the placement angle of a microphone affects the phase and waveform of a pulse-like sound. 42) Further investigations will improve the measurement techniques, such as correction for microphone measurements of distorted waveforms in nonlinear sound propagation, and develop more optimal acoustic filters to evaluate parametric sounds.
: Appendix: Microphone characteristics
The actuator responses and free-field corrected sensitivity of the microphones in Table I for incidence angles of θinc = 0° and 90° given by the manufactures are plotted in Fig. A·1. A higher sound pressure acts on the microphone placed at 0° due to more interference of incident and diffracted sounds compared with that at 90°. The upper limit frequency of the given sensitivities of the 1/2 inch microphones is 20 kHz. The estimated sensitivities of the 1/2 inch microphones obtained from a comparative calibration based on the measurement results of 1/4'' PF at 90° are also shown in the figure.

Fig. A·1. (Color online) Microphone sensitivity. Solid and dashed curves are free-field-corrected sensitivities of the microphones (see Table I) for incidence angles θinc = 0° and 90°, respectively, given by the manufacturers. Thin dotted curves are actuator responses (shown for reference). Closed and open symbols are estimated sensitivities of 1/2 inch microphones at 40 kHz for θinc = 0° and 90°, respectively.
Download figure:
Standard image High-resolution imageTable A·1 shows each microphone's measurement uncertainty obtained from directly radiated audible sound measurements at 2, 4, and 6 kHz for a dynamic loudspeaker (TEAC LS-301) at a distance of 2 m. Microphones were placed at incidence angles of θinc = 0° and 90°, similar to the parametric sound measurements. The standard deviations of 10 repeated measurements are shown as uncertainties. The maximum deviation is about 0.3 dB.
Table A·1. Variation in measured sound pressure for each microphone. The standard deviations of 10 repeated measurements of audible sound for each frequency emitted from a dynamic loudspeaker at a given point are shown.
| Mic | Standard deviation (dB) | |||||
|---|---|---|---|---|---|---|
| 2 kHz | 4 kHz | 6 kHz | ||||
| θinc = 0° | θinc = 90° | θinc = 0° | θinc = 90° | θinc = 0° | θinc = 90° | |
| 1/4'' FF | 0.2 | 0.2 | 0.2 | 0.2 | 0.2 | 0.1 |
| 1/4'' PF | 0.1 | 0.3 | 0.1 | 0.3 | 0.1 | 0.2 |
| 1/2'' FF | 0.2 | 0.2 | 0.2 | 0.2 | 0.2 | 0.1 |
| 1/2'' PF | 0.1 | 0.4 | 0.1 | 0.1 | 0.1 | 0.1 |
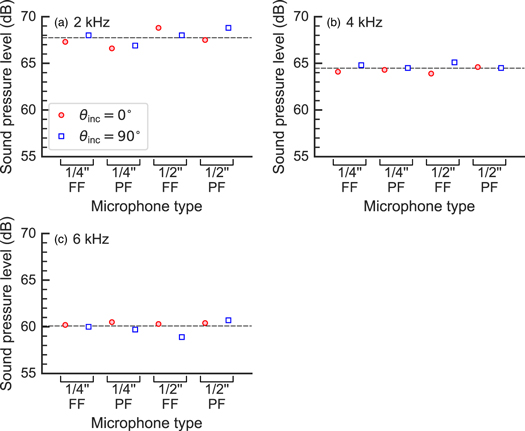
Figure A·2 shows the average values for 10 repeated measurements for each microphone. These variations correspond to the variability of the measured values between microphones. The variation for the measurement at 2 kHz is relatively large, with a maximum of 1.1 dB. Because the variability for each microphone and the variation between microphones are lower than the difference of several tens of decibels in the experiments, the experimental uncertainties did not significantly affect the results of the demodulated sound measurements.
Fig. A·2. (Color online) Variation of measured sound pressure. The average values for 10 repeated measurements of audible sound for each frequency emitted from a dynamic loudspeaker at a given point are shown as symbols. Dashed lines are the average values for each frequency for four microphones and two incidence angles.
Download figure:
Standard image High-resolution image