

Abstract
The effect of atomic hydrogen exposure on hydrogenated amorphous carbon (a-C:H) films was investigated by X-ray photoelectron spectroscopy (XPS). From the dependence of the wide-scan XPS spectra of an a-C:H film on atomic hydrogen exposure, it was shown that the film was etched with an etching rate of 0.2 nm min−1. In addition, by analyzing the C 1s XPS spectra, the coordination of C atoms in the a-C:H film was investigated as a function of the atomic hydrogen exposure and photoelectron emission angle. This indicated that the coordination of C atoms at the surface of the a-C:H film was not influenced by atomic hydrogen exposure. Therefore, we propose that the depth profile of a-C:H films can be measured with no damage using atomic hydrogen etching.
Export citation and abstract BibTeX RIS
1. Introduction
Since amorphous carbon films have interesting properties such as high hardness, a low friction coefficient, and chemical inertness, they have attracted a great deal of attention for a wide range of applications. 1–6) Owing to their properties, amorphous carbon films are mainly used as coatings on industrial products such the magnetic heads and media of hard disk drives, 7–9) machine parts for molds, 10,11) and cutting tools. 12,13) In addition, the effect of X-ray irradiation on amorphous carbon films was studied as they are expected to be used as lubricating coatings in space. 14) It was reported that amorphous carbon films are not etched by X-ray irradiation, 15) while hydrogenated amorphous carbon (a-C:H) films are etched by X-rays. 16) However, materials in space applications are subjected not only to X-rays but also bombardment by hydrogen atoms. Therefore, it is important to investigate the effect of atomic hydrogen exposure on amorphous carbon films. Recently, it was reported that hydrogenated amorphous carbon films are etched on exposure to atomic hydrogen at etching rates dependent on the hydrogen contents of the a-C:H films. 17) However, it is not clear whether the surface electronic structure of amorphous carbon films is influenced by atomic hydrogen exposure.
In this study, the effect of atomic hydrogen exposure on a-C:H films was investigated by X-ray photoelectron spectroscopy (XPS). From the dependence of the wide-scan XPS spectra on atomic hydrogen exposure, it was observed that the a-C:H film was etched by atomic hydrogen. In addition, by analysis of the C 1s XPS spectra, the coordination of C atoms in the a-C:H film was investigated as a function of atomic hydrogen exposure and the photoelectron emission angle. The surface electronic structure of a-C:H films after exposure to atomic hydrogen is discussed based on an analysis of the XPS spectra.
2. Experimental methods
a-C:H films purchased from Nippon ITF Inc. were formed on Si wafers by the RF plasma method at a frequency of 13.56 MHz. The pressure of the hydrocarbon gas was 13.3 Pa during deposition of the a-C:H films. The thickness of the a-C:H films was about 300 nm. The hydrogen concentration of the films was estimated to be 40 at% using the elastic recoil detection analysis method. The a-C:H films were exposed briefly to air and then transferred to the photoelectron analysis chamber for XPS measurements and the atomic hydrogen generation apparatus for atomic hydrogen exposure.
Atomic hydrogen was generated using a catalytic chemical vapor deposition method. 18–20) In the method, hydrogen molecules are decomposed by catalytic cracking on a heated catalyst. A schematic diagram of the atomic hydrogen generation apparatus is shown in Fig. 1. W mesh composed of 0.03 mmφ wire at a density of 30 wires per inch was used as the catalyst and heated at a temperature of about 1700 °C. An Ar (95%) and H2 (5%) gas mixture at a pressure of 10 Pa and flow rate of 100 sccm was used to produce the atomic hydrogen. During atomic hydrogen exposure, the sample temperature measured by a type-K thermocouple was kept below 110 °C by use of a water-cooled sample holder. The distance between the sample and W mesh was 150 mm. Since the atomic hydrogen generation apparatus was connected to the photoelectron analysis chamber through a gate valve, XPS spectra of the a-C:H films after atomic hydrogen exposure were measured without exposing them to air.
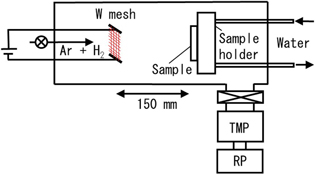
Fig. 1. (Color online) A schematic diagram of the atomic hydrogen generation apparatus.
Download figure:
Standard image High-resolution imageAll XPS measurements were performed on the BL7B end station at the NewSUBARU facility, University of Hyogo. 21) The wide-scan and C 1s XPS spectra were measured as a function of atomic hydrogen exposure with a hemispherical electrostatic spectrometer (VG Scienta R3000) at an emission angle of 45° to the surface normal. In addition, XPS spectra of the C 1s level were also measured at emission angles of 15°, 45° and 75° to obtain the photoelectron emission angle dependence. Mg Kα line (hν = 1253.6 eV) was used as the excitation source. The total energy resolution was about 0.7 and 1.0 eV for the C 1s and wide-scan regions, respectively. All XPS spectra shown in this study were measured at room temperature. The base pressure in the photoelectron analysis chamber was 2 × 10⁻⁸ Pa.
3. Results and discussion
Figure 2 shows the wide-scan XPS spectra of an a-C:H film as a function of atomic hydrogen exposure time. The atomic hydrogen exposure time is indicated beside each spectrum. XPS spectra were normalized by the maximum peak intensity. Before atomic hydrogen exposure, four peaks originating from the C, and O atoms were observed in the XPS spectrum. The four peaks at ∼1000, ∼750, ∼530, and ∼280 eV were assigned to Auger levels for the C KVV and O KLL decay processes and the O 1s and C 1s levels, respectively. 22,23) The observation of peaks at ∼750 and ∼530 eV suggests that O atoms are present on the surface of the a-C:H film. This is due to the exposure of the sample to air after the formation of the a-C:H film. As the atomic hydrogen exposure increased from 10 to 60 min, the intensity of the peaks at ∼750 and ∼530 eV decreased gradually. On further increasing the atomic hydrogen exposure up to 1260 min, no clear change was observed in the XPS spectrum. At 1500 min of exposure, the intensity of the peaks at ∼750 and ∼530 eV increased suddenly while that of the peaks at ∼1000 and ∼280 eV decreased. In addition, two peaks at ∼150 and ∼100 eV appeared. The two peaks at ∼150 and ∼100 eV were assigned to Si 2s and 2p levels, respectively. 22,23) This indicates that the two peaks at ∼150 and ∼100 eV originated from the Si substrate. With further increase of the atomic hydrogen exposure to 1740 min, the intensity of the peaks at ∼750 and ∼530 eV increased and the peaks at ∼1000 and ∼280 eV disappeared. This means that the a-C:H film was etched by atomic hydrogen exposure. From the change in the wide-scan XPS spectra, the etching rate was estimated to be 0.2 nm min−1. In a previous study of the photoresist removal using the atomic hydrogen exposure, 24) hydrocarbon Cx Hy fragments were observed by a quadrupole mass spectroscopy. Therefore, we consider that the a-C:H film decomposed to the hydrocarbon Cx Hy by the atomic hydrogen exposure and then evaporated from the film surface. The evolution of the wide-scan XPS spectrum in Fig. 2 as a function of atomic hydrogen exposure shows the distribution of the chemical composition with depth in the a-C:H film. In other words, the depth profile of the a-C:H film could be revealed by atomic hydrogen etching. In Fig. 3, the relative intensity ratio of the O 1s peak to the C 1s peak (O 1s/C 1s) in the XPS spectrum is plotted as a function of atomic hydrogen exposure time. The O 1s/C 1s relative intensity ratio was 0.7 before atomic hydrogen exposure, and decreased remarkably with increasing exposure up to 60 min. Then, it decreased slowly and was saturated at a value of 0.25 with increasing exposure. These results indicate that the O content was greater at the surface and decreased remarkably with depth in the a-C:H film. However, some O content remained in the film. There are two possibilities as to the origin of the O content in the a-C:H film. One is O atom diffusion from the surface into the a-C:H film. The other is the introduction of O atoms during the formation of the film. At present, we cannot determine the origin of the O content in the a-C:H film with certainty.
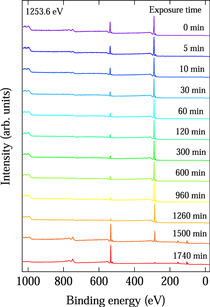
Fig. 2. (Color online) Wide-scan XPS spectra of hydrogenated amorphous carbon film as a function of atomic hydrogen exposure time.
Download figure:
Standard image High-resolution image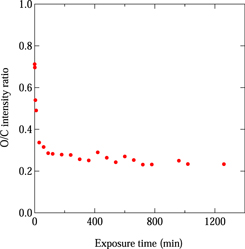
Fig. 3. (Color online) Relative intensity ratio of O 1s peak to C 1s peak as a function of atomic hydrogen exposure time.
Download figure:
Standard image High-resolution imageFigure 4(a) shows the XPS spectra of the C 1s level in the a-C:H film as a function of the atomic hydrogen exposure time. Before atomic hydrogen exposure, a peak at 285 eV with a tail on the higher binding energy side was observed. With increasing exposure, the tail was observed to become smaller while the spectral features of the peak at 285 eV were unchanged. In a previous photoelectron study, the C 1s spectrum at 285 eV was decomposed into two components at 284.4 and 285.2 eV. 25–27) The component at 284.4 eV was assigned to C 1s electrons originating from the sp2 hybridized C atoms, while the component at 285.2 eV was assigned to C 1s electrons originating from sp3 hybridized and C–H bonded C atoms. 25,28) Thus, the coordination of C atoms was evaluated from the spectral features of the peak at 285 eV. The lack of change in the spectral features of the peak indicates that the coordination of C atoms in the a-C:H film was not influenced by atomic hydrogen exposure. On the other hand, the tail at the higher binding energy side was assigned to C 1s electrons originating from the C atoms bonded with O atoms such as in O–C–O, C=O, and O=C–O groups. 17) Therefore, the decrease in the intensity of the tail indicates that the O content in the a-C:H film decreased with increasing atomic hydrogen exposure. This is consistent with the results obtained from the wide-scan XPS spectra of the film.
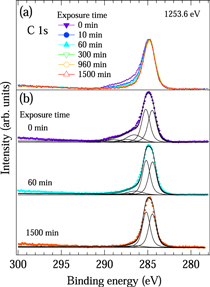
Fig. 4. (Color online) (a) C 1s XPS spectra for the hydrogenated amorphous carbon film as a function of atomic hydrogen exposure time. (b) Fitting results (lines) for the hydrogenated amorphous carbon film before atomic hydrogen exposure and after atomic hydrogen exposure of 60 and 1500 min.
Download figure:
Standard image High-resolution imageIn order to clarify the coordination of C atoms, curve-fitting analysis was performed on the C 1s XPS spectra using a Mahan line shape convoluted with Gaussian and Lorentzian functions. 25,28,29) Before the fitting procedure, the Shirley background was subtracted from the C 1s XPS spectra. 30) The XPS spectra of the C 1s level in the a-C:H film were reproduced by five components positioned at 284.4, 285.2, 286.8, 287.5, and 288.9 eV, which were assigned to the C 1s electrons originating from sp2 hybridized, sp3 hybridized, C–H bonded, O–C–O bonded, C=O bonded, and O=C–O bonded C atoms, respectively. 17) In Fig. 4(b), the best fitting results (lines) for the a-C:H film before and after atomic hydrogen exposure for 60 and 1500 min are shown. The five components in the a-C:H film, which were evaluated from the integrated area of each component, are summarized in Table I. With increasing atomic hydrogen exposure, the C contents with the O–C–O, the C=O, and the O=C–O bonded C atoms decreased while the ratio of the intensity of the sp3 hybridized and C–H bonded C atoms to the sp2 hybridized C atoms was unchanged. This indicates that the coordination of the C atoms in the a-C:H film was unchanged independent of the atomic hydrogen exposure or O contents.
Table I. The relative integrated areas of 288.9, 287.5, 286.8, 285.2 and 284.4 eV peaks in the C 1s XPS spectra for the hydrogenated amorphous carbon film (Unit:%).
| Exposure time | 288.9 eV | 287.5 eV | 286.8 eV | 285.2 eV | 284.4 eV |
|---|---|---|---|---|---|
| 0 min | 5.2 | 5.8 | 14.9 | 37.7 | 36.4 |
| 60 min | 1.6 | 3.3 | 9.1 | 43.9 | 42.1 |
| 1500 min | 0.2 | 0.8 | 4.2 | 48.7 | 46.1 |
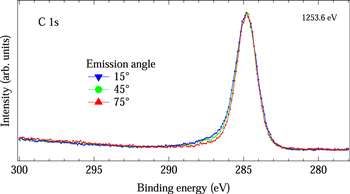
Figure 5 shows the C 1s XPS spectra of the a-C:H film after atomic hydrogen exposure for 600 min, taken at electron emission angles of 15°, 45° and 75°. With increasing electron emission angle, the tail at the higher binding energy side decreased slightly while the spectral features of the peak at 285 eV remained unchanged. Since the XPS spectrum taken at the electron emission angle of 75° is more surface-sensitive compared with those taken at electron emission angles of 15° and 45°, this indicates that the O content at the surface is smaller compared with that in the a-C:H film. In addition, this also indicates that the coordination of C atoms at the surface of the a-C:H film is identical to that in the a-C:H film. Therefore, it was found that the coordination of C atoms at the surface of the a-C:H film is not influenced by atomic hydrogen exposure. This means that the surface of the a-C:H film is not subject to damage by atomic hydrogen exposure. Accordingly, we propose that the depth profile of a-C:H films can be measured with no damage using atomic hydrogen etching.
Fig. 5. (Color online) C 1s XPS spectra of hydrogenated amorphous carbon film, taken at electron emission angles of 15°, 45° and 75°.
Download figure:
Standard image High-resolution image
4. Conclusions
The effect of atomic hydrogen exposure on a-C:H films was investigated by XPS. Exposure of the a-C:H film to atomic hydrogen induced etching of the a-C:H film. The etching rate was estimated to be 0.2 nm min−1. In addition, the coordination of C atoms in a-C:H films was found to be unaffected by atomic hydrogen exposure. This indicates that the surface of the a-C:H film is not subject to damage by atomic hydrogen exposure. Therefore, we propose that the depth profile of a-C:H films can be measured with no damage by atomic hydrogen etching.