
Abstract
The validity of the mechanochemical solid-state reaction by dry ball milling for synthesizing Pb(Zr, Ti)O3 (PZT) fine ceramic powder at room temperature (RT) was evaluated using synchrotron radiation X-ray diffraction (SXRD). A mixture of PbZrO3 (PZ) and PbTiO3 (PT) powders with a molar ratio of 1:1 was prepared as the starting powder. To confirm the synthesis of PZT, the structural characteristics of the ball-milled samples with different milling times were investigated by analyzing the SXRD data using the Rietveld method. The solid-state reaction was nearly complete in a short milling time of 4 h at RT. After ball milling for approximately 8 h, only a single phase of PZT was detected. The Rietveld refinement for the crystal structure analysis demonstrated that slightly Ti-rich PZT, Pb(Zr0.485(1)Ti0.515(1))O3, with a tetragonal crystal system, is synthesized in the 8 h sample. The tetragonality is sufficiently suppressed to resemble a cubic system even at RT, whereas the phase transition temperature (TC) is significantly high. We quantitatively demonstrate that PZT with a higher TC can be synthesized at RT by dry ball milling, despite the smaller spontaneous lattice distortion.
Export citation and abstract BibTeX RIS
1. Introduction
It is well known that Pb(Zr1−x Tix )O3 (PZT) ceramics, which are solid-solutions of antiferroelectric PbZrO3 (PZ) and ferroelectric PbTiO3 (PT), are widely used as piezoelectric materials in various electromechanical devices. As the composition x varies from 0 to 1 at room temperature (RT), the perovskite-type crystal structure of PZT changes from being orthorhombic to tetragonal via rhombohedral. 1–4) In the narrow range of x, at approximately x = 0.48, the rhombohedral and tetragonal phases coexist. As the existence of an additional monoclinic phase is suggested, the morphotropic phase boundary (MPB) is formed on which various phases coexist. 3,5) It is worth noting that PZT ceramics with MPB compositions exhibit a very high piezoelectric response, as the polarization direction is easily changed between the [001] and [111] directions. 6,7) The phase transition temperature (TC) to the cubic phase at high-temperature varies monotonically between the TC of PZ and that of PT 1,4) according to the composition x. Thus, the composition x of PZT can be confirmed by reading the TC from the phase diagram, and vice versa. Owing to their excellent piezoelectricity, ferroelectricity, and thermal stability, PZT ceramics, especially those with MPB compositions, are one of the most common and widely used piezoelectric materials for actuators, transducers, etc in the industry. 5,8–12)
Various methods such as conventional solid-state reaction, 13) sol–gel method, 14) hydrothermal synthesis, 15) spray drying, 16) mechanical activation, 17) molten salt method, 18) microwave processing, 19) and other related methods 20–22) have been proposed for synthesizing PZT ceramics and their films. So far, the synthesis of PZT has been studied in terms of simplicity, controllability, and low-cost. Although the aforementioned methods are widely used for synthesizing PZT, some disadvantages that need to be overcome still exist. For instance, the sol–gel reaction requires very expensive alkoxides as raw materials that are unstable in a moist atmosphere. 17,23) Many chemical reaction-based processing routes require complex operations to synthesize PZT, such as the sol-gel process and the hydrothermal synthesis. 17,22,23) Physical processing routes usually require the calcination of materials at very high temperatures, such as the conventional solid-state reaction method. 17,22)
The mechanochemical solid-state reaction method was originally developed to improve the mechanical properties of alloys, such as strength and resistance. 21,24) Later, this technique was applied to the synthesis of organics, 25,26) polymers, 27) and oxides. 13,23) This method has several advantages over the conventional solid-state reaction method and many chemical reaction-based processing methods. For example, the synthesis is activated by mechanical energy rather than thermal energy, eliminating the need for post-annealing and making it easier to operate. 13,22,23) Recently, a process for synthesizing PZT powder by ball milling using a mixture of high-purity PbO, ZrO2, and TiO2 ceramic powders as the starting powder has been proposed. 23,28) Although some unreacted PbO remained in this process, Pb (Zr0.52Ti0.48)O3 ceramic powder was obtained after ball milling for 80 h. Other researchers have also attempted to synthesize PZT ceramic powder from a mixture of PbO, ZrO2 and TiO2 powders by ball milling. 17,20) However, the synthesis of PZT ceramic powder from the mixture seems to require a long milling time. Nonetheless, these approaches should be considered to have important consequences for synthesizing PZT via a simple and low-cost mechanochemical process.
In this study, we synthesized PZT ceramic powder by a mechanochemical solid-state reaction at RT that involved dry ball milling a mixture of PZ and PT powders with a molar ratio of 1:1. Synchrotron radiation X-ray powder diffraction (SXRD) experiments provide direct evidence that PZT synthesis proceeds in a fairly short milling time. The solid-state reaction was nearly complete in 4 h, and after ball milling for approximately 8 h, only a single phase of PZT was detected. We discuss the structural characteristics and phase transition of PZT synthesized by this method based on a quantitative evaluation of the crystal structure.
2. Experimental methods
Ceramic powders of PZ and PT with a particle diameter of approximately 1 μm were prepared using a conventional solid-state reaction with commercially available ZrO2 (purity: 98%, Kojundo Chemical Lab. Co., Ltd.), PbO (purity: 99.99%, Kojundo Chemical Lab. Co., Ltd), and TiO2 (purity: 99.99%, Kojundo Chemical Lab. Co., Ltd) powders. These originally synthesized PZ and PT powders were mixed well at a molar ratio of 1:1 as the starting powder with ethanol and dry ball-milled using a planetary ball mill system (P-6 classic line, Fritsch Japan Co., Ltd). Sample mixtures of 20 g were ball-milled in an Ar gas atmosphere for 4, 8, 16 and 32 h, where the milling was stopped every 30 min for cooling, and labeled as 4 h PZ–PT, 8 h PZ–PT, 16 h PZ–PT, and 32 h PZ–PT, respectively. A 500 ml zirconia bowl and SiC balls (mixture of 50 large balls with diameter of 10 mm, and small balls weighting 50 g with diameter of 5 and 2 mm, respectively) were used as the milling media. The milling speed was set at 450 rpm. The microstructures of the starting powder and ball-milled PZ–PT powders were observed using a scanning electron microscope (SEM) (JSM-7200F, JEOL Ltd). The degree of mixing of Zr and Ti elements was confirmed by energy dispersive X-ray spectroscopy during SEM observation (SEM–EDX). The Pb(Zr0.5Ti0.5)O3 bulk ceramic was also prepared as a reference material by sintering the wet milled mixture of PZ and PT powders at 1090 °C (1363 K) for 4 h. The bulk ceramic was powdered by grinding it in an agate mortar, and then labeled as PZT.
SXRD experiments were performed using a large Debye–Scherrer camera with a multi-MYTHEN-detector system installed at the powder diffraction beamline BL02B2 at SPring-8. 29) The powder samples of PZ, PT, sintered bulk ceramic of PZT (PZT), and ball-milled PZ–PT samples (4 h PZ–PT, 8 h PZ–PT, 16 h PZ–PT, and 32 h PZ–PT) were sealed into quartz capillaries with an inner diameter of 0.1 mm. X-rays with a wavelength of 0.35 Å were used to analyze the crystal structure of the powder samples at RT and 1000 K in the ferroelectric and paraelectric phases, respectively. These experimental conditions enabled us to ignore the absorption and extinction effects while analyzing the SXRD data accurately using the Rietveld method. 30,31) The sample temperatures were changed by a high-temperature N2 gas flow system and controlled within 0.1 K. The phase transition in the PZT and 8 h PZ–PT samples was evaluated by temperature sweep measurements at 20 K min−1 during heating and subsequent cooling of the samples in the temperature range between RT and 1000 K. For the 8 h PZ–PT sample, the phase transition in the second heating/cooling cycle was measured to confirm the difference from that in the first heating/cooling cycle. The two-dimensional (2D) intensity map as a function of the temperature was drawn based on the diffraction patterns collected every 5 K.
3. Results and discussion
Figure 1 shows the SEM–EDX images of the mixture of PZ and PT powders after ball milling for 0, 4, and 8 h. As can be observed in Fig. 1(a), the mixture without ball milling, i.e. the starting powder, consisted of ceramic particles of PT (red) and PZ (green). After ball milling for 4 h, most of the red and green were well mixed to form the yellow area; a few remaining red and green particles could be observed as shown in Fig. 1(b). After ball milling for 8 h, they appeared to be completely mixed as shown in Fig. 1(c). At this stage, it was not yet possible to determine whether the yellow area was composed of PZT as intended or simply a mixture of very fine PZ and PT particles.
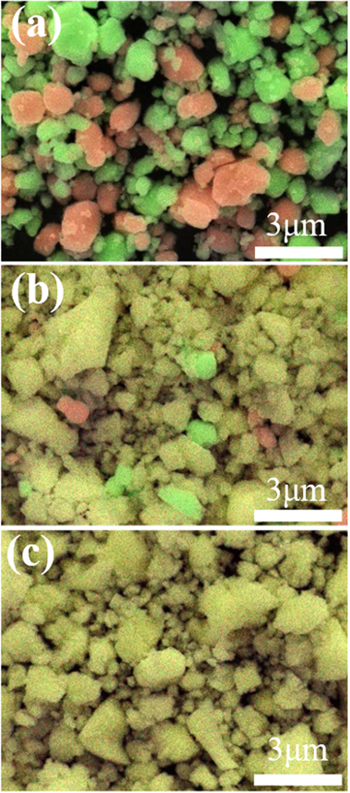
Fig. 1. (Color online) SEM images of mixture of PZ and PT powders. Ball milling for (a) 0 h (starting powder), (b) 4 h, and (c) 8 h. The red and green particles colored by SEM–EDX indicate the PT and PZ particles, respectively. Upon mixing, the red and green turns yellow.
Download figure:
Standard image High-resolution imageTo validate the synthesis of PZT, SXRD experiments were conducted at SPring-8. Figure 2 shows the SXRD profiles of the ball-milled PZ–PT samples at RT without any heat treatment after ball milling. As shown in Fig. 2(a), the main peak positions of the PZ–PT samples are all in good agreement. The peak profiles of the tetragonal PZT sample were observed in clearly split. However, assuming that the peak profile of the PZT sample was broadened and overlapped and looked like a single peak, the peak profile of the PZ–PT sample was the same as that of the PZT sample. Therefore, we concluded that PZT could be synthesized in a short time by milling a mixture of PZ and PT powders. The inset of Fig. 2(a) shows the variations in the (110) peak intensity of the PZ–PT samples as a function of the milling time. The intensity increased initially according to the milling hours, peaked at 8 h and then decreased gradually. These results suggest that the mechanochemical reaction that produces the PZT phase occurred in the first 8 h, and further milling reduced the crystallinity of the PZT particles. According to the Williamson–Hall equation, 32,33) as the ball milling time increased from 8 to 32 h, the crystallite size of the PZT particles decreased from 240 to 190 nm and the strain increased from 0.00318 to 0.00438, resulting in a rapid reduction of the intensity.
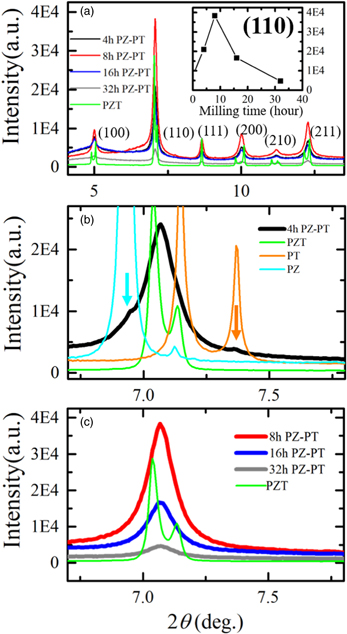
Fig. 2. (Color online) SXRD profiles of ball-milled PZ–PT samples at RT in the as-synthesized state. (a) SXRD profiles of 4, 8, 16, and 32 h PZ–PT samples along with the sintered PZT sample as a reference. Solid-solutions of PZT are synthesized in all the ball-milled samples. The inset indicates that the (110) peak intensity of the PZ–PT samples shows the maximum at 8 h of milling, and gradually decreases subsequently. (b) Comparison of the (110) peak profile of the 4 h PZ–PT sample and those of the PZT, PT, and PZ samples. (c) (110) peak profiles of the 8, 16, and 32 h PZ–PT samples and PZT sample.
Download figure:
Standard image High-resolution imageThe aforementioned observations can be clearly seen in Figs. 2(b) and 2(c). Figure 2(b) shows the enlarged (110) profile of the 4 h PZ–PT sample along with those of the sintered PZT, PT, and PZ samples. The peak profile of the 4 h PZ–PT sample was slightly asymmetric, which should be viewed considering the intensity ratio of the split peaks of the sintered PZT sample. The positions of the small peaks indicated by the arrows coincide with the peak positions of PZ and PT. Hence, the 4 h PZ–PT sample primarily consisted of PZT, along with a small amount of unreacted PZ and PT. Conversely, as evident from Fig. 2(c), there were no unreacted PZ and PT in the PZ–PT samples milled for 8 h or more. Ball milling for 8 h enabled the synthesis of pure PZT fine powder by a mechanochemical solid-state reaction. As the samples were ball-milled for a long time, the particle sizes or crystallite sizes became smaller and the peak profile of the SXRD broadened. The results obtained by SXRD are consistent with the SEM–EDX observations shown in Fig. 1. It was determined that the yellow part in Fig. 1 consists of PZT.
The SXRD profiles of the ball-milled PZ–PT samples at 1000 K are shown in Fig. 3. The PZT, PZ and PT samples are known to exhibit a cubic crystal system at 1000 K. Hence, each observed peak profile should be a single symmetrical peak. As shown in Fig. 3, the observed peak profiles in the PZ–PT samples were symmetrical and single, and the peak positions were all consistent with those of the sintered PZT sample. Comparing Fig. 3 with Fig. 2, it can be consistently concluded that PZT could be synthesized as discussed for the results shown in Fig. 2.
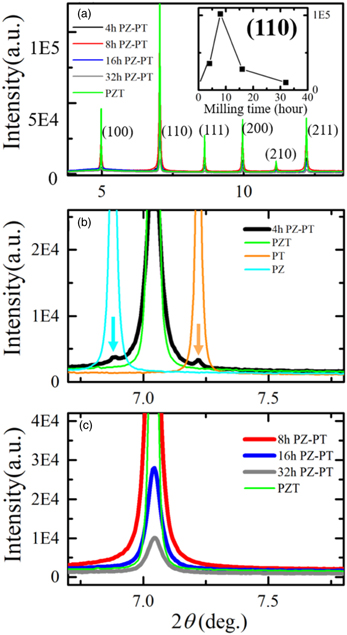
Fig. 3. (Color online) SXRD profiles of the ball-milled PZ–PT samples at 1000 K in the cubic phase. (a) SXRD profiles of the ball-milled 4, 8, 16, and 32 h PZ–PT samples along with the sintered PZT sample as a reference. (b) Comparison of the (110) peak profile of the 4 h PZ–PT sample and those of the PZT, PT, and PZ samples. (c) (110) peak profiles of the 8, 16, and 32 h PZ–PT samples and PZT sample.
Download figure:
Standard image High-resolution imageThe results of the Rietveld profile fitting at 1000 K for 8 and 4 h PZ–PT samples are presented in Fig. 4. The space group of PZT ceramics with a composition of x ~ 0.5 is normally P4mm or P4mm + R3m at RT.
34,35) However, Fig. 2 shows that all the SXRD profiles of the milled PZ–PT samples resembled those of pseudocubic crystals. In such cases, the multiple degrees of freedom in assuming the crystal system hampered accurate crystal structural analysis. Therefore, we first analyzed the crystal structure at 1000 K above TC, where PZT definitely possessed a cubic crystal system, using the Rietveld method to confirm the synthesis of PZT and the composition x. As shown in Fig. 4(a), the crystal structure of the 8 h PZ–PT sample at 1000 K was successfully analyzed by assuming a single phase of PZT with the space group of Pm
 m. The reliability factors (R-factors) based on the weighted profile, RWP, the Bragg intensities, RI, and the structure factors, RF, were excellent at 2.97%, 5.95%, and 6.53%, respectively. The variations in RWP as a function of x are shown in the inset of Fig. 4(a). The Rietveld analysis demonstrates that the 8 h PZ–PT sample consists of a single phase of Ti-rich PZT with x = 0.515(1), that is, Pb(Zr0.485(1)Ti0.515(1))O3. We speculate that a small amount of unreacted PZ, which did not contribute to the synthesis of PZT, remained in the sample with a probably amorphous-like form that did not exhibit diffraction peaks.
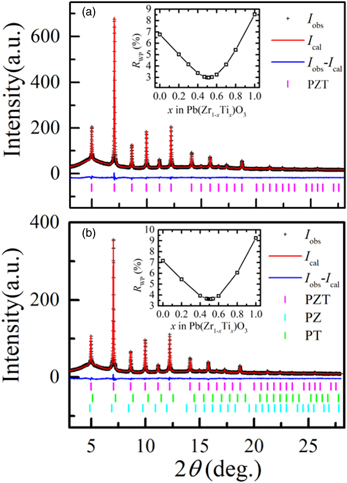
Fig. 4. (Color online) Rietveld profile fitting results of the ball-milled PZ–PT samples at 1000 K in the cubic phase with space group of Pm
 m. (a) 8 h PZ–PT sample: RWP = 2.97%, RI = 5.95%, and RF = 6.53%. Composed of PZT only. The lattice parameter of PZT is a = 4.08025(1) Å. Ti-rich PZT, Pb(Zr0.485(1)Ti0.515(1))O3, is synthesized. (b) 4 h PZ–PT sample: RWP = 3.62%, RI = 5.74%, and RF = 8.39%. Composed of coexisting PZT, PZ, and PT. The lattice parameter of PZT is a = 4.08244(1) Å. Despite higher Zr concentrations, Ti-rich PZT, Pb(Zr0.491(1)Ti0.509(1))O3, is synthesized. Molar ratio of PZT: PZ: PT = 97.3(1)%: 1.5(1)%: 1.2(1)%.
Download figure:
Standard image High-resolution imageIn the Rietveld analysis for the 4 h PZ–PT sample at 1000 K, the refinement was carried out by assuming three coexisting materials, i.e. a synthesized single phase of PZT and unreacted PZ and PT, all with the space group of Pm
 m. The R-factors were RWP = 3.62%, RI = 5.74%, and RF = 8.39%. The composition was x = 0.509(1), that is, Pb(Zr0.491(1)Ti0.509(1))O3 was synthesized. The molar ratio was PZT : PZ : PT = 97.3(1)% : 1.5(1)% : 1.2(1)%, which implied that the main constituent was PZT. The Zr content of PZT in the 4 h PZ–PT sample exceeded that in the 8 h PZ–PT sample. The difference in the Zr composition in PZT is reflected in the difference in the lattice parameter a. The lattice parameter a = 4.08244(1) Å of PZT in the 4 h PZ–PT sample, which contained more Zr ions with a larger ionic radius, was larger than the lattice parameter a = 4.08025(1) Å of the 8 h PZ–PT sample. In the early stages of ball milling, we consider that a PZT with a composition closer to the nominal composition is synthesized. Considering that PZT with almost no composition deviation is synthesized even after ball milling for 8 h in this study, we hypothesize that it may be possible to synthesize PZT with any Zr/Ti composition ratio by changing the molar ratio of PZ and PT in the starting powder. Additionally, the result of the Rietveld analysis for the 8 h PZ–PT sample shown in Fig. 4(a) implies that PZT can be synthesized in a considerably short time starting with a mixture of PZ and PT powders compared to that starting with a mixture of PbO, ZrO2 and TiO2 powders.
23,28)
m. The R-factors were RWP = 3.62%, RI = 5.74%, and RF = 8.39%. The composition was x = 0.509(1), that is, Pb(Zr0.491(1)Ti0.509(1))O3 was synthesized. The molar ratio was PZT : PZ : PT = 97.3(1)% : 1.5(1)% : 1.2(1)%, which implied that the main constituent was PZT. The Zr content of PZT in the 4 h PZ–PT sample exceeded that in the 8 h PZ–PT sample. The difference in the Zr composition in PZT is reflected in the difference in the lattice parameter a. The lattice parameter a = 4.08244(1) Å of PZT in the 4 h PZ–PT sample, which contained more Zr ions with a larger ionic radius, was larger than the lattice parameter a = 4.08025(1) Å of the 8 h PZ–PT sample. In the early stages of ball milling, we consider that a PZT with a composition closer to the nominal composition is synthesized. Considering that PZT with almost no composition deviation is synthesized even after ball milling for 8 h in this study, we hypothesize that it may be possible to synthesize PZT with any Zr/Ti composition ratio by changing the molar ratio of PZ and PT in the starting powder. Additionally, the result of the Rietveld analysis for the 8 h PZ–PT sample shown in Fig. 4(a) implies that PZT can be synthesized in a considerably short time starting with a mixture of PZ and PT powders compared to that starting with a mixture of PbO, ZrO2 and TiO2 powders.
23,28)
Figure 5 shows the temperature dependences of the (110) diffraction pattern of the 8 h PZ–PT sample along with those of the sintered PZT sample as a reference. The 2D intensity maps clearly indicate that the features of the 8 h PZ–PT sample during the heating process in the first cycle shown in Fig. 5(a) differ significantly from those shown in Figs. 5(b)–5(d). In the first heating process from the as-synthesized state, as shown in Fig. 5(a), the broad and weak (110) peak gradually shifted toward lower angles in 2θ by the thermal expansion, with a sudden increase in the peak intensity at 740 K. As the temperature was further increased, the peak shifted to lower angles at a larger thermal expansion coefficient while the peak intensity increased. According to the Rietveld analysis at 1000 K, the composition of the 8 h PZ–PT sample was x = 0.515(1). Hence, the crystal system of PZT with x = 0.515 should be tetragonal and TC = 650 K from the phase diagram. 36) Therefore, we concluded that the sudden change at 740 K was caused by the phase transition from the tetragonal phase to the cubic phase. However, the TC determined from SXRD was significantly higher than the TC shown in the phase diagram. When the temperature was increased to 1000 K, the features of the 2D map in the subsequent first cooling process and the second heating and cooling processes, became almost the same, as shown in Figs. 5(b)–5(d), respectively. Although the TC decreased by 60 K to 680 K after the first heating process, it was still higher than the TC shown in the phase diagram. These features are in contrast with those of the sintered PZT shown in Figs. 5(e) and 5(f). The Rietveld analysis demonstrated that the sintered PZT possessed a tetragonal crystal system at RT with a space group of P4mm, with the following lattice parameters and the composition: a = 4.02793(5), c = 4.1448(9), (c/a = 1.029), and x = 0.503(1). According to the phase diagram, 36) the TC of PZT with x = 0.503 is 640 K, which is in good agreement with the measured TC of the sintered PZT, as shown in Figs. 5(e) and 5(f). The lattice parameters of PZT synthesized in the 8 h PZ–PT sample, evaluated by the Rietveld analysis, assuming the P4mm space group and x = 0.515, are as follows in the as-synthesized state at RT: a = 4.052(2), c = 4.096(5), (c/a = 1.011). At RT after the first heating/cooling process, the tetragonality, i.e. the c/a ratio, was further decreased as a = 4.056(2), c = 4.072(2), (c/a = 1.004). The lattice parameters at RT were almost unchanged after the second heating/cooling process. Thus, the dry mechanochemical solid-state reaction by ball milling synthesizes PZT with a significantly small tetragonality but high TC.
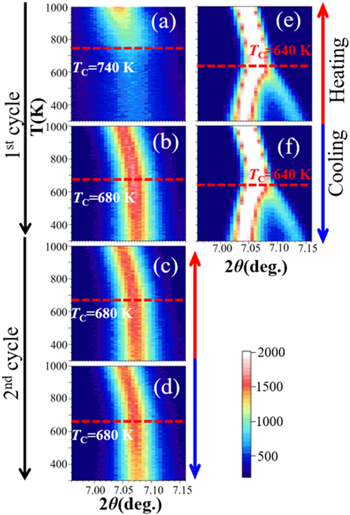
Fig. 5. (Color online) Temperature dependence of the (110) diffraction patterns of the 8 h PZ–PT and PZT samples. 2D intensity maps during the (a) first heating process from the as-synthesized state at RT up to 1000 K and (b) first cooling process in the first heating/cooling cycle, and (c) second heating process and (d) second cooling process in the second heating/cooling cycle for the 8 h PZ–PT sample. (e) heating and (f) cooling processes for the sintered PZT sample.
Download figure:
Standard image High-resolution imageThe temperature dependences of the d-value and the full width at half maximum (FWHM) of the (110) peak of the 8 h PZ–PT sample are shown in Fig. 6. These are derived from the (110) pattern of the 8 h PZ–PT sample shown in Fig. 5. As shown in Figs. 6(a)–6(d), which depict the temperature dependence of the d-value, each plot shows a bend at TC, indicated by an arrow. It is evident that only the behavior in the first heating process shown in Fig. 6(a) is different from the others. As shown in Fig. 5, the TC is confirmed to be shifted up to 740 K, whereas the others are constant at 680 K, as shown in Figs. 6(b)–6(d). Similarly, regarding the FWHM, only the behavior in the first heating process shown in Fig. 6(e) differs from the others, as shown in Figs. 6(f)–6(h). The FWHM is constant above TC in the cubic phase after the first cooling process, whereas it gradually decreases above TC in the first heating process. These differences are considered to be caused by the gradual improvement in crystallinity by annealing the sample at high temperatures above TC in the first heating process, that result in a gradual sharpening of the diffraction peak. The FWHM decreases as the temperature increases below TC because the (110) peak, which was essentially separated into two in the tetragonal phase, was merged into one toward TC. Thus, it is quite natural to consider that the crystal system of PZT synthesized in the 8 h PZ–PT sample was tetragonal at RT and cubic above TC, although the diffraction patterns were those of a pseudocubic structure without clear peak splitting over the entire temperature range.

Fig. 6. (Color online) Changes in the d-value and full width at half maximum (FWHM) of (110) peak of the 8 h PZ–PT sample as a function of the temperature during the (a) and (e) first heating, (b) and (f) first cooling, (c) and (g) second heating, and (d) and (h) second cooling processes, respectively. These data are derived by analyzing the (110) pattern of the 8 h PZ–PT shown in Fig. 5. The TC determined in each process is indicated by a red arrow in each figure.
Download figure:
Standard image High-resolution imageHere we consider why the TC in the first heating process of PZT in the ball-milled PZ–PT sample is significantly high. Because the material was synthesized by a mechanochemical solid-state reaction by ball milling, the internal residual strain (stress) or the lattice distortion by lattice defects were initially considered as a possible reason. Figure 7 shows the data plots to evaluate the internal strain and the lattice distortion of PZT synthesized in the 8 h PZ-PT sample, where RT0, RT1 and RT2 indicate the measured data at RT in the as-synthesized state, RT after the first heating/cooling process, and RT after the second heating/cooling process, respectively. The Williamson–Hall plots 32,33) for evaluating the internal residual strain and the crystallite size at RT0, RT1, and RT2 are displayed in Fig. 7(a). In the Williamson–Hall method, the slope of the graph corresponds to the degree of internal strain, and the crystallite size can be estimated from the intercept along the vertical axis. It can be clearly seen that all the slopes shown in Fig. 7(a) are nearly the same, which implies that the residual strains at RT0, RT1 and RT2 are essentially the same. Therefore, the residual strain does not seem to contribute to the increase in the TC. The crystallite sizes evaluated using Kλ/D at 4sinθ = 0 are 0.2, 1.6 and 1.7 μm at RT0, RT1 and RT2, respectively, where K has a constant value of 0.9, λ is the wavelength, and D is the crystallite size. It was confirmed that the crystallite size of PZT in the 8 h PZ–PT sample increased in the first heating/cooling cycle and changed little in the subsequent heat treatment to 1000 K.

Fig. 7. (Color online) Evaluation of the internal strain and lattice distortion of the PZT synthesized in the 8 h PZ-PT sample. (a) Williamson–Hall plot 32,33) for evaluating internal residual strain and crystallite size. The slope of the graph corresponds to the degree of internal strain, whereas the crystallite size can be estimated from the intercept on the vertical axis. (b) Diffuse scattering observed around the (110) peak at RT, which resembles the Huang scattering 37) around the Bragg peaks caused by the lattice distortion around lattice defects. The labels RT0, RT1 and RT2 represent the data measured at RT in the as-synthesized state, RT after the first heating/cooling process, and RT after the second heating/cooling process, respectively.
Download figure:
Standard image High-resolution image
The enlarged SXRD profiles of the (110) Bragg peak of PZT in the 8 h PZ–PT sample at RT0, RT1, and RT2 are shown in Fig. 7(b) with the profile of the sintered PZT measured at RT. Diffuse scattering was observed to increase the background levels in the 8 h PZ–PT sample, which was in good contrast to the low and constant background levels of the sintered PZT. In particular, the intensity of the diffuse scattering at RT0 was significantly high; the intensity was suppressed at RT1 and RT2, resulting in similar intensity distributions at RT1 and RT2. The diffuse scattering observed around the Bragg peaks resembled Huang scattering 37) that originates from lattice distortion around lattice defects. In the mechanochemical solid-state reaction by ball milling, there is a great possibility that a sample with poor crystallinity was synthesized without heat treatment. As discussed in Figs. 5 and 6, the crystallinity improved significantly during the first heating process, but hardly changed after the second process. The crystallinity might have been improved after increasing the temperature to 1000 K by the reduction of the lattice defects and the increase in the crystallite size from submicrons in the as-synthesized state to microns. Therefore, we considered that the high TC of the as-synthesized PZT by ball milling originated from crystal imperfections, probably poor crystallinity. In this study, the temperature of the PZ–PT samples was increased to 1000 K, whereas the sintered PZT was heat-treated at 1090 °C (1363 K) for 4 h. Hence, the crystallinity of PZT in the 8 h PZ–PT sample was considered to be poor even after the first heating/cooling process. The tetragonality c/a ratio was not fully developed at RT and was significantly smaller than that of PZT bulk ceramics. 4,38) Had the temperature of the ball-milled sample been increased to 1090 °C, results similar to those of bulk ceramics might have been observed after the heating.
4. Conclusion
Using SXRD, we have quantitatively confirmed that PZT fine ceramic powder can be synthesized in a short time from a mixture of PZ and PT powders by the dry mechanochemical solid-state reaction at RT using ball milling. Although the spontaneous lattice distortion at RT is small, PZT, in which the ferroelectric phase is stabilized up to high temperatures, is synthesized compared to that of bulk ceramics with the same Zr/Ti composition ratio.
We consider that ferroelectric ceramic materials fabricated using mechanical energy may possess common properties of low ferroelectricity but high TC, such as the PZT fine ceramic powder synthesized in this study. If thermal energy is not used during synthesis, such as post-annealing at high temperatures, the reduction in crystallinity owing to the miniaturization of ceramic particles and crystallites is inevitable, which seems to be the origin of the characteristic properties of ceramic materials fabricated using mechanical energy. Further researches are needed to understand why poor crystallinity increases the TC.
Acknowledgments
The authors would like to thank Dr S. Kawaguchi and Ms. H. Yoshida for their assistance during the experiments at SPring-8. The SXRD experiment was conducted with the approval of the Japan Synchrotron Radiation Research Institute (JASRI) (Proposal No. 2020A0068). This study was partially supported by JSPS KAKENHI, Grant-in-Aid for Scientific Research (B), 2020-2023 (JP20H02641, Yoshihiro Kuroiwa).