

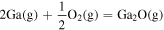
Abstract
Thermodynamic analysis and experimental demonstration of β-Ga2O3 growth by metalorganic vapor phase epitaxy using triethylgallium (TEG) and oxygen (O2) precursors were performed. Thermodynamic analysis revealed that the O2 supplied is preferentially used for the combustion of hydrocarbons and H2 derived from TEG. Therefore, the use of high growth temperatures and high input VI/III ratios is essential for the complete combustion of hydrocarbons and H2, and β-Ga2O3 growth. The use of an inert gas as the carrier gas was also determined as necessary to grow β-Ga2O3 at high temperatures. Based on these results, a ( 01) oriented smooth β-Ga2O3 layer could be grown on a c-plane sapphire substrate at 900 °C with a growth rate of 1.4 μm h−1 at an input VI/III ratio of 100. The grown layer showed a clear optical bandgap of 4.84 eV, and impurity concentrations of hydrogen and carbon were below the background levels of the measurement system.
Export citation and abstract BibTeX RIS

Content from this work may be used under the terms of the Creative Commons Attribution 4.0 license. Any further distribution of this work must maintain attribution to the author(s) and the title of the work, journal citation and DOI.
1. Introduction
Beta gallium oxide (β-Ga2O3) is expected to have a large dielectric breakdown field of ca. 8 MV cm−1 1) from a large bandgap of 4.4–4.9 eV, 2–4) with a theoretically predicted maximum room temperature electron mobility of 200 cm2 V−1 s−1. 5) Therefore, the Baliga's figure of merit for β-Ga2O3 is much larger than that of other wide bandgap semiconductors such as GaN and 4H-SiC, 1,6) so that β-Ga2O3 has been attracting considerable attention in recent years as a promising material for future power devices. In addition, the availability of large-diameter single crystal substrates prepared from high-quality bulk crystals grown by the melt-growth method is also boosting device development. 7–9) For the development of devices that can demonstrate the material potential of β-Ga2O3, homoepitaxial growth methods of drift layers with low electron densities and high electron mobilities are indispensable, and various epitaxial growth methods such as molecular beam epitaxy, 1,10–12) halide vapor phase epitaxy (HVPE), 13–15) mist chemical vapor deposition (mist CVD), 16) pulsed laser deposition, 17) and low-pressure CVD 18) have been investigated to meet these requirements.
Several groups have also recently embarked on growth of β-Ga2O3 by metalorganic vapor phase epitaxy (MOVPE). 19–22) Although MOVPE is a very attractive method for the fabrication of device structures due to its steep growth controllability and capability of (Alx Ga1−x )2O3/Ga2O3 heterostructure growth, 23,24) carbon (C) contamination by metalorganics used for group-III precursors has long been a concern. Nevertheless, the growth of layers with low n-type carrier densities in the mid 1015 cm−3 and electron mobilities that exceed 170 cm2 V−1 s−1 have begun to be reported using triethylgallium (TEG) and O2 as precursors, and Ar as carrier gas. 20,21) These results may have benefited from the use of TEG because TEG is decomposed by β-hydrogen elimination at low temperatures, where ethyl groups are eliminated as ethylene, even in a carrier gas without H2. 25) Even now, tuning of the growth conditions is being actively investigated to further reduce the incorporation of impurities in the grown layer and improve the growth rate, but little has been clarified regarding the dynamics of chemical reactions behind the MOVPE growth of β-Ga2O3. 26)
Thermodynamic analysis on the vapor phase epitaxial growth system of crystals is a powerful tool to associate crystal growth conditions with chemical reactions that occur in the system. As such, thermodynamic analyses of HVPE and MOVPE for many III–V compound semiconductor crystals have enhanced our chemical understanding of growth, and the results have contributed to the growth of high-quality crystals and have also been utilized in the development of growth apparatus. 27–31) For β-Ga2O3, we have previously performed thermodynamic analysis on growth by HVPE to clarify the optimum growth conditions, 32,33) from which high-speed growth of high-purity and/or intentionally-doped homoepitaxial layers was achieved. 13,14,32,33) However, to the best of our knowledge, there have been no reports on the thermodynamic analysis of MOVPE growth for β-Ga2O3.
In this paper, a thermodynamic analysis was performed on the MOVPE growth of β-Ga2O3 using TEG and O2 as precursors to elucidate the dynamics of chemical reactions and the conditions suitable for growth. MOVPE growth of β-Ga2O3 under these suitable conditions was then experimentally verified.
2. Thermodynamic analysis
2.1. Calculation procedure
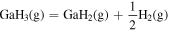
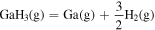
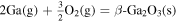
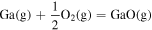
Thermodynamic analysis of β-Ga2O3 growth by MOVPE using TEG and O2 as precursors 19–21) was conducted. It is assumed that a mixture of an inert gas (IG) such as He, Ar, or N2 and H2 is used as the carrier gas. TEG is irreversibly decomposed by the homogeneous reaction of β-hydrogen elimination at temperatures above 400 °C, which forms gallane (GaH3) and ethylene (C2H4) gases, even without H2 in the carrier gas. 25) Therefore, for thermodynamic analysis at a temperature of 500 °C or higher, the starting gaseous species are GaH3, C2H4, O2, where IG and H2 are used as the carrier gas. Under the thermal equilibrium above the β-Ga2O3 substrate, the following 16 gaseous species coexist: GaH3, GaH2, GaH, Ga, Ga(OH), GaO, Ga2O, C2H4, C2H2, C2H6, CO2, CO, O2, H2O, H2 and IG. These gaseous species are associated by the following equilibrium reactions:


The characteristic of this system is that there are species with different ratios of Ga and O (β-Ga2O3(s), GaO(g), and Ga2O(g)), and unlike the MOVPE growth of III–V compounds, the combustion of hydrocarbons (C2H4(g), C2H2(g), and C2H6(g)) and H2 must be considered. The law of mass action for equilibrium reactions (1)–(12) can be written as:


Here, 
 and
and  are the equilibrium constant of the equilibrium reaction (n) depending on the growth temperature (T), the equilibrium partial pressures of gaseous species i, and the activity of β-Ga2O3, respectively, where the value of
  can be assumed to be 1 in this case.
  can be calculated using the thermochemical tables
34–36) and can be fitted by the following equation:
can be calculated using the thermochemical tables
34–36) and can be fitted by the following equation:

where a, b, and c are fitting parameters, and their best fit values for each chemical reaction are summarized in Table I. The total pressure ( ) given by the sum of the equilibrium partial pressures for each gaseous species is constant; therefore, the following equation is satisfied:
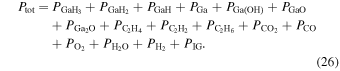
The stoichiometric relationship for the formation of β-Ga2O3 satisfies the following equation:
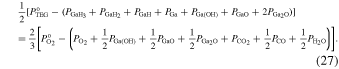
Here,  and
and  are the input partial pressures of TEG and O2, respectively. The left side of Eq. (27) gives half the number of Ga atoms lost from the vapor phase due to β-Ga2O3 growth, which is equal to the driving force for β-Ga2O3 growth (
 ). Furthermore, the atomic numbers of hydrogen, carbon, and IG in the vapor phase are invariant; therefore, the following two equations are introduced:
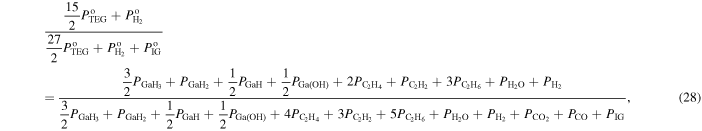
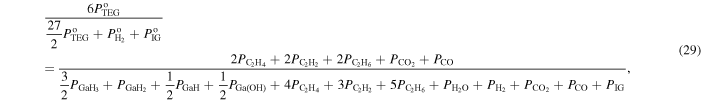
where  and
and  are the input partial pressures of H2 and IG, respectively. Equation (28) is the ratio of the number of hydrogen atoms to the number of hydrogen, carbon and IG atoms in the system, and Eq. (29) is the ratio of the number of carbon atoms to the number of hydrogen, carbon and IG atoms in the system.
Table I. Fitting parameters for calculation of the equilibrium constants as a function of T (in Kelvin).
| Reactions | a | b | c |
|---|---|---|---|
| −1.10 × 101 | −2.12 × 10³ | 4.87 × 100 |

| −9.36 × 100 | −4.75 × 10³ | 5.08 × 100 |
| −9.45 × 100 | −7.72 × 10³ | 5.78 × 100 |

| −1.38 × 101 | 2.66 × 10⁴ | 4.56 × 100 |
| −3.75 × 101 | 8.59 × 10⁴ | 2.66 × 100 |
| −1.45 × 100 | 6.55 × 10³ | −2.88 × 10⁻¹ |
| −4.64 × 100 | 3.35 × 10⁴ | −1.28 × 100 |

| 3.42 × 100 | −9.14 × 10³ | 1.02 × 100 |

| −5.24 × 100 | 7.19 × 10³ | −5.00 × 10⁻¹ |

| 2.73 × 10⁻¹ | 6.89 × 10⁴ | −5.07 × 10⁻¹ |

| 1.15 × 101 | 3.92 × 10⁴ | −1.14 × 100 |
| 2.28 × 10⁻² | 1.26 × 10⁴ | −8.37 × 10⁻¹ |
The equilibrium partial pressures of gaseous species can be calculated by solving the set of simultaneous equations under certain growth conditions: T, 
 the input VI/III ratio (=
  ), and the mole fraction of H2 in the carrier gas (
 ). Under thermal equilibrium, i.e. under mass transportation limited growth, the growth rate (GR) is given as:


2.2. Calculation results and discussion
Figure 1(a) shows the growth temperature dependence of the equilibrium partial pressures of gaseous species over β-Ga2O3 under conditions with  = 20 Torr,
  = 2.0 × 10⁻² Torr, VI/III = 10, and
  = 0 (inert carrier gas). The vapor pressure of pure Ga metal (
 ) is also included as a dotted line.
37) The equilibrium partial pressures of C2H4, C2H2, and C2H6 are very low and decrease with an increase in the growth temperature, whereas those of H2, CO, CO2, and H2O remain high over the entire temperature range investigated. This indicates that hydrocarbons and H2 cause combustion reactions with O2 by chemical reactions (8)–(12). In the MOVPE growth of GaN, a high concentration of carbon has been reported to be incorporated into a grown layer by the simultaneous supply of hydrocarbons.
38) Therefore, if the presence of CO and CO2 in the system does not cause carbon contamination (this will be mentioned again later in this study), high-temperature growth is considered to be preferable because the equilibrium partial pressures of hydrocarbons in the system become low. Another aspect to consider is that the equilibrium partial pressure of gaseous Ga is below
) is also included as a dotted line.
37) The equilibrium partial pressures of C2H4, C2H2, and C2H6 are very low and decrease with an increase in the growth temperature, whereas those of H2, CO, CO2, and H2O remain high over the entire temperature range investigated. This indicates that hydrocarbons and H2 cause combustion reactions with O2 by chemical reactions (8)–(12). In the MOVPE growth of GaN, a high concentration of carbon has been reported to be incorporated into a grown layer by the simultaneous supply of hydrocarbons.
38) Therefore, if the presence of CO and CO2 in the system does not cause carbon contamination (this will be mentioned again later in this study), high-temperature growth is considered to be preferable because the equilibrium partial pressures of hydrocarbons in the system become low. Another aspect to consider is that the equilibrium partial pressure of gaseous Ga is below  over the entire temperature range investigated, which indicates that metal Ga droplets are not formed on the β-Ga2O3 surface.

Fig. 1. (Color online) (a) Equilibrium partial pressures of gaseous species over β-Ga2O3 as a function of growth temperature. The dotted line indicates the vapor pressure of pure Ga metal ( ). (b) Growth temperature dependence of
  calculated for several values of
  The growth conditions other than
  are the same as in (a).
Download figure:
Standard image High-resolution imageThe growth temperature dependence of  calculated from the results in Fig. 1(a) is shown in Fig. 1(b), together with
  calculated for various
  under the same growth conditions as in Fig. 1(a) except for
  When
When  is 0,
is 0,  is almost equal to
  up to 900 °C, but decreases sharply as the temperature increases above 900 °C, and then becomes negative above 1020 °C indicating the decomposition (etching) of β-Ga2O3. Figure 1(a) shows that even when
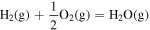
  is 0, H2 derived from TEG is present in the system at a high equilibrium partial pressure; therefore, β-Ga2O3 is considered to react with H2 and decompose at high temperatures. At around 1200 °C, the equilibrium partial pressures of H2O and Ga2O become very high, and the ratio of the equilibrium partial pressure of Ga2O and H2O is almost 1:2. Therefore, β-Ga2O3 decomposes by the same net reaction as the decomposition reaction in H2 atmosphere heat treatment, as shown by:
39)
is 0, H2 derived from TEG is present in the system at a high equilibrium partial pressure; therefore, β-Ga2O3 is considered to react with H2 and decompose at high temperatures. At around 1200 °C, the equilibrium partial pressures of H2O and Ga2O become very high, and the ratio of the equilibrium partial pressure of Ga2O and H2O is almost 1:2. Therefore, β-Ga2O3 decomposes by the same net reaction as the decomposition reaction in H2 atmosphere heat treatment, as shown by:
39)

In addition, as  increases, the temperature at which
  becomes 0 shifts to a lower temperature. If
  is 0.01, i.e. the carrier gas contains 1% H2, then β-Ga2O3 cannot be grown at 1000 °C. Therefore, it can be concluded that
  = 0, i.e. the use of IG as a carrier gas, is preferable for the MOVPE growth of β-Ga2O3 at high temperatures. A similar conclusion has been drawn for the HVPE growth of β-Ga2O3.
32)
= 0, i.e. the use of IG as a carrier gas, is preferable for the MOVPE growth of β-Ga2O3 at high temperatures. A similar conclusion has been drawn for the HVPE growth of β-Ga2O3.
32)
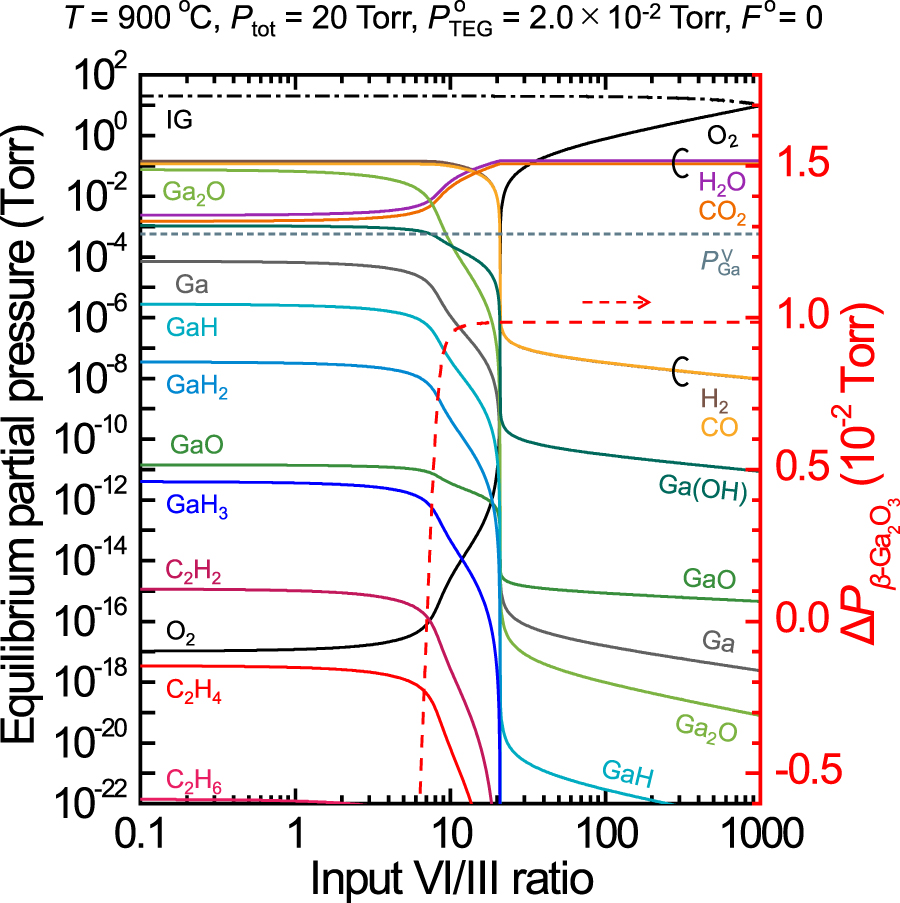
Figure 2 shows the equilibrium partial pressures of gaseous species over β-Ga2O3 and the resultant  when the input VI/III ratio is changed under growth conditions of T = 900 °C,
  = 20 Torr,
  = 2.0 × 10⁻² Torr, and
  = 0. Near the input VI/III ratio of 20, the equilibrium partial pressures of gaseous species, except IG, change suddenly. On the side where the input VI/III ratio is lower than 20, the equilibrium partial pressures of H2, CO, C2H2, C2H4, and C2H6 increase due to incomplete combustion of hydrocarbons and H2. At the same time, as the input VI/III ratio decreases, the equilibrium partial pressure of Ga2O increases and exceeds
  so that
  becomes negative and β-Ga2O3 is decomposed (etched). Therefore, if there is insufficient O2 in the system, then O2 is preferentially consumed for the combustion of hydrocarbons and H2, and the H2 remaining due to incomplete combustion decomposes (etches) β-Ga2O3 by reaction (31). On the other hand, on the side where the input VI/III ratio is higher than 20, the equilibrium partial pressures of O2, H2O, and CO2 become high, while those of H2, CO, C2H2, C2H4, C2H6, and gaseous species containing Ga decrease. Therefore, when there is sufficient O2 in the system, hydrocarbons and H2 combust completely, and the remaining O2 contributes to the growth of β-Ga2O3. The complete combustion of hydrocarbons and H2 can also be confirmed by the equilibrium partial pressures of CO2 and H2O being almost equal to
  and
and  respectively. Furthermore, the
  required for the complete combustion of carbon and hydrogen derived from TEG is equal to
  therefore, the input VI/III ratio at which combustion is completed is 19.5. This is the reason why the equilibrium partial pressures of gaseous species change suddenly near the input VI/III ratio of 20. When the input VI/III ratio is increased,
  is rapidly increased to a positive value in the input VI/III ratio range of 7–20 and then becomes saturated at almost half the value of
  Therefore, it is essential to use a high input VI/III ratio that allows sufficient O2 to remain, even after complete combustion of the hydrocarbons and H2, for the MOVPE growth of β-Ga2O3. It should also be noted that the equilibrium partial pressure of Ga is lower than
  throughout this figure and no Ga droplets are generated on the β-Ga2O3 surface.
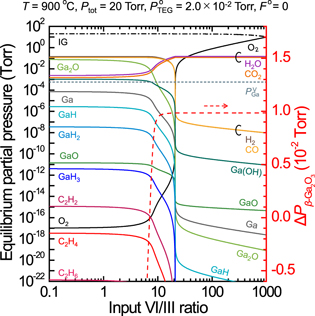
Fig. 2. (Color online) Dependence of the equilibrium partial pressures of gaseous species over β-Ga2O3 (left axis) and the resultant  (right axis) on the input VI/III ratio under the growth conditions written on the top. The vapor pressure of pure Ga metal (
 ) is also included (dotted line).
Download figure:
Standard image High-resolution imageFigure 3 shows deposition phase diagrams that summarize  obtained for
  and input VI/III ratios at 700 °C, 900 °C, and 1100 °C under a
  of 20 Torr and
  of 0 (IG is used as the carrier gas). The input VI/III ratio at which β-Ga2O3 can be grown (i.e. where
  becomes positive) increases with the growth temperature because H2, CO, and Ga(OH) have high equilibrium partial pressures under high-temperature conditions, so that more O2 is required for their complete combustion. Furthermore,
  decreases with the growth temperature; therefore, when
  is high and the input VI/III ratio is low at 700 °C [lower-right of Fig. 3(a)],
  becomes higher than
  and Ga droplets are formed. From these phase diagrams of deposition, growth conditions favorable to obtain a large positive
  i.e. a large growth rate, can be determined for the MOVPE growth of β-Ga2O3.
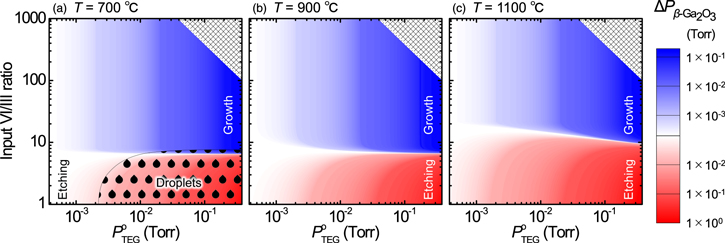
Fig. 3. (Color online) Phase diagram for β-Ga2O3 growth by MOVPE at 700 °C, 900 °C, and 1100 °C under  of 20 Torr and
  of 0. The color intensity indicates the magnitude of
  Droplets occur when
  exceeds
Download figure:
Standard image High-resolution image3. Growth experiment
3.1. Experimental methods
The growth of β-Ga2O3 was demonstrated using TEG and O2 precursors in an in-house-built MOVPE system with a horizontal hot-wall quartz glass reactor. Figure 4 shows a schematic diagram of the MOVPE system. The conditions suitable for growth determined by the thermodynamic analysis were adopted. Argon (Ar) was used as the carrier gas, i.e.  is 0. The total pressure in the reactor (
 ) was kept at 20 Torr using a vacuum pump and pressure controller. The total gas flow rate in the reactor was maintained at 1100 sccm, and the TEG was supplied from a bubbler with a molar flow rate of 48.6 μmol min−1, i.e.
  = 2.0 × 10⁻² Torr. The input VI/III ratio was set to 100. The quartz glass reactor was heated to 800 °C–1000 °C with a multi-zone electric furnace, and a c-plane sapphire substrate was placed in the center to attempt β-Ga2O3 growth. The growth time was fixed at 1 h.

Fig. 4. (Color online) Schematic diagram of the in-house-built MOVPE system used for β-Ga2O3 growth. MFC represents a mass flow controller.
Download figure:
Standard image High-resolution imageThe thickness and surface morphology of the grown layers were evaluated by cross-sectional and surface observations using field emission scanning electron microscopy (FE-SEM; JEOL, JSM-6700F). The concentrations of the impurities (H, C, N, and Si) incorporated in the grown layers were analyzed by secondary ion mass spectrometry (SIMS; CAMECA, IMS-7f) measurements. The optical bandgaps of the grown layers were evaluated by measurement of the external optical transmission spectra in the wavelength range of 200 nm–800 nm with an unpolarized light source using a double-beam spectrophotometer (JASCO, V-7300). A blank sapphire substrate was used as a reference. Interference fringes in the spectra were also used to cross-check the grown layer thickness. The crystal structures of the grown layers were determined by the analysis of high-resolution X-ray diffraction (XRD; Spectris, X'Pert MRD) 2θ–ω profiles.
3.2. Experimental results and discussion
Figure 5 shows the growth rate at growth temperatures of 800 °C, 900 °C, and 1000 °C. A growth rate of ca. 1.4 μm h−1 was confirmed at growth temperatures of 800 °C and 900 °C, whereas the growth rate dropped to ca. 0.8 μm h−1 at 1000 °C. The dashed line in Fig. 5 is the result of fitting the experimental growth rate with Eq. (30) using  obtained by the thermodynamic analysis under the same conditions as the growth experiment. Here, Kg = 145 μm h−1 Torr−1 was used; this is 4–5 times larger than the value reported for the HVPE growth of β-Ga2O3 using GaCl and O2 as source gases,
32,33) which suggests high utilization efficiency of TEG. In the range of 800 °C–900 °C, the experimental growth rate and the thermodynamically calculated growth rate show good agreement, and the growth rate is almost constant, regardless of the growth temperature. However, at 1000 °C, the experimental growth rate is much lower than the thermodynamically calculated growth rate. The reason for this is currently unclear, but it is possible that the sticking coefficient decreases at high temperatures, or that the effective VI/III ratio on the substrate surface is lower than the input VI/III ratio due to insufficient O2 diffusion. Figure 3 indicated that when the effective VI/III ratio was ca. 20, the thermodynamically calculated growth temperature dependence of the growth rate was in good agreement with the growth temperature dependence of the experimental growth rate in Fig. 5. Further details will be clarified in future work.
obtained by the thermodynamic analysis under the same conditions as the growth experiment. Here, Kg = 145 μm h−1 Torr−1 was used; this is 4–5 times larger than the value reported for the HVPE growth of β-Ga2O3 using GaCl and O2 as source gases,
32,33) which suggests high utilization efficiency of TEG. In the range of 800 °C–900 °C, the experimental growth rate and the thermodynamically calculated growth rate show good agreement, and the growth rate is almost constant, regardless of the growth temperature. However, at 1000 °C, the experimental growth rate is much lower than the thermodynamically calculated growth rate. The reason for this is currently unclear, but it is possible that the sticking coefficient decreases at high temperatures, or that the effective VI/III ratio on the substrate surface is lower than the input VI/III ratio due to insufficient O2 diffusion. Figure 3 indicated that when the effective VI/III ratio was ca. 20, the thermodynamically calculated growth temperature dependence of the growth rate was in good agreement with the growth temperature dependence of the experimental growth rate in Fig. 5. Further details will be clarified in future work.
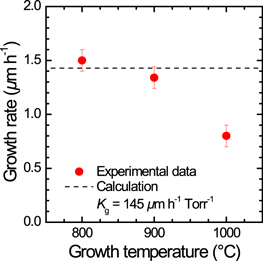
Fig. 5. (Color online) Dependence of growth rate on the growth temperature. Error bars indicate measurement errors and/or variations due to the measurement position. The dashed line shows the calculated growth rate estimated by Eq. (30), where Kg = 145 μm h−1 Torr−1 was used.
Download figure:
Standard image High-resolution imageSurface FE-SEM micrographs of the layers grown at each growth temperature are shown in Fig. 6. While the layers grown at 800 °C and 900 °C had smooth surfaces, the surface of the layer grown at 1000 °C was rough and grain boundaries were clearly visible. These grain boundaries are along three directions equivalent to 〈11 0〉 of the c-plane sapphire substrate, which is a typical arrangement of β-Ga2O3(
 01) layers grown on c-plane sapphire substrates.
40)
01) layers grown on c-plane sapphire substrates.
40)
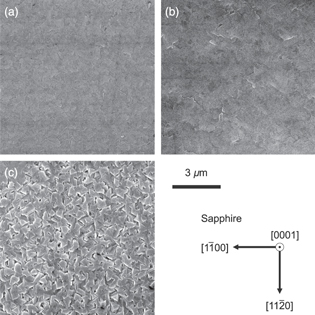
Fig. 6. Surface FE-SEM micrographs of the layers grown on c-plane sapphire substrates at various growth temperatures for 1 h: (a) 800 °C, (b) 900 °C, and (c) 1000 °C.
Download figure:
Standard image High-resolution imageTable II shows the results of SIMS measurements of the concentration of impurities incorporated in the layers grown at each growth temperature. The incorporation of both hydrogen and carbon impurities was observed in the order of 1018 cm−3 in the layer grown at 800 °C, but the concentrations in the layers grown at 900 °C and 1000 °C were below the respective background (B.G.) levels of these impurities. In the previous section, we reported that when growth is performed at high temperatures and high input VI/III ratios, CO2 and H2O are generated with high equilibrium partial pressures by the complete combustion of hydrocarbons and H2 derived from TEG. Therefore, these experimental results suggest that the complete combustion of hydrocarbons and H2 can reduce the incorporation of carbon and hydrogen into the grown layer. However, the reductions may be due to the increase in growth temperature. We will investigate the details in future work. Nitrogen concentrations were also below the B.G. level in layers grown at all growth temperatures. In the layers grown at 900 °C and 1000 °C, impurity incorporation was detected only for Si, both showing almost the same Si impurity concentration, and this was higher than that in the layer grown at 800 °C. No Si-containing gas was used in this growth experiment; therefore, it is considered that the origin of the Si impurities was the reaction of the quartz glass (SiO2) reactor wall with H2 present in the growth system to generate gaseous SiO. 33,41) However, the incorporation of Si impurities is expected to be suppressed in the future through the careful selection of reactor materials; therefore, it is not considered to be a serious problem.
Table II. Impurity concentrations in MOVPE-grown layers at various growth temperatures, and the background (B.G.) levels of each impurity in the SIMS system. The relatively high B.G. levels of H and C impurities are due to the electron gun used to prevent charging of the sapphire substrates. The relatively high B.G. level of Si impurities is due to the low sputtering rate of the β-Ga2O3 layers.
| Growth temperature | Impurity concentration (cm– 3) | |||
|---|---|---|---|---|
| [H] | [C] | [N] | [Si] | |
| 800 °C | 4 × 10¹⁸ | 4 × 10¹⁸ | < B.G. | 9 × 10¹⁷ |
| 900 °C | < B.G. | < B.G. | < B.G. | 3 × 10¹⁸ |
| 1000 °C | < B.G. | < B.G. | < B.G. | 3 × 10¹⁸ |
| Background (B. G.) levels of the elements | 7 × 10¹⁷ | 2 × 10¹⁷ | 2 × 10¹⁶ | 8 × 10¹⁶ |
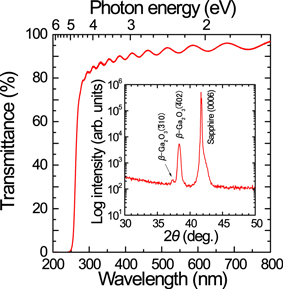
Finally, Fig. 7 shows the results of external optical transmittance measurements and the XRD 2θ–ω scan profile of the layer grown at 900 °C for 1 h. The smooth surface of the grown layer, as shown in Fig. 6(b), resulted in high transmittance of 90%–95% and clear interference fringes in the visible light region. The thickness of the grown layer estimated from these fringes using the refractive index calculated from the Cauchy dispersion model
42) was 1.19 μm, which is consistent with the grown layer thickness obtained by cross-sectional FE-SEM observations. The optical bandgap was estimated to be 4.84 eV (= 256 nm) from the absorption edge of the transmittance, which is close to the previously reported values for β-Ga2O3.
2–4,43) In the XRD 2θ–ω profile, a strong β-Ga2O3( 02) peak and a weak β-Ga2O3(
 10) peak were observed, which indicate that a highly (
 01)-oriented β-Ga2O3 layer was grown on the c-plane sapphire substrate by the MOVPE method.
Fig. 7. (Color online) External optical transmission spectrum for a β-Ga2O3 layer grown at 900 °C for 1 h on a c-plane sapphire substrate. The inset shows the XRD 2θ–ω scan profile of the same sample.
Download figure:
Standard image High-resolution image
4. Conclusions
Thermodynamic analysis and demonstration of β-Ga2O3 growth by MOVPE using TEG and O2 precursors were performed. The reaction mechanism was investigated by calculating the equilibrium partial pressures of gaseous species that coexisted in the growth system, and favorable growth conditions were clarified. O2 supplied to the growth system was consumed by the combustion of hydrocarbons and H2 derived from TEG before being used in the growth of β-Ga2O3. Therefore, a high input VI/III ratio (a high input partial pressure of O2) and a high growth temperature were determined as preferable for the MOVPE growth of β-Ga2O3 to achieve complete combustion of hydrocarbons and H2. Furthermore, H2 in the growth system causes a decrease of  (i.e. etching); therefore, it is preferable not to add H2 into the carrier gas (
 = 0). The MOVPE growth of β-Ga2O3 on c-plane sapphire substrates was demonstrated based on the thermodynamic analysis results. A growth rate of approximately 1.4 μm h−1 was achieved at 800 °C and 900 °C with no Ga droplet formation. In addition, the incorporation of carbon and hydrogen impurities into the grown layer was reduced at and above 900 °C, which suggests that CO2 and H2O generated by the complete combustion of hydrocarbons and H2 may not become doping gases of carbon or hydrogen. The β-Ga2O3 layer grown on the c-plane sapphire substrate was a highly (
 01) oriented crystal with a smooth surface and high optical transmittance for visible light. These results indicate that the MOVPE growth of β-Ga2O3 is thermodynamically controllable, and the results of this work provide insights for not only improvement in the quality of β-Ga2O3 grown layers, but also for the growth of (Alx
Ga1−x
)2O3.
01) oriented crystal with a smooth surface and high optical transmittance for visible light. These results indicate that the MOVPE growth of β-Ga2O3 is thermodynamically controllable, and the results of this work provide insights for not only improvement in the quality of β-Ga2O3 grown layers, but also for the growth of (Alx
Ga1−x
)2O3.
Acknowledgments
The authors wish to thank Ms. Sakiko Yamanobe, who is now at ALPS ALPINE CO., Ltd. for help with the thermodynamic analysis, and Dr. Zheng Ye and Prof. Shugo Nitta of Nagoya University for fruitful discussions and valuable suggestions. Part of this work was supported by a Grant-in-Aid for Scientific Research on Innovative Areas (No. 16H06417) from the Japan Society for the Promotion of Science (JSPS) and by the Institute of Global Innovation Research, Tokyo University of Agriculture and Technology, Japan.