

Abstract
The optical constants and bandgap energy (Eg) of semiconductors, characterized by spectroscopic ellipsometry (SE), are highly affected by the applied model dielectric function (MDF). In this study, we investigated the optical constants and Eg in low indium content (x) Al1-xInxN alloys grown on a c-plane freestanding GaN substrate by using SE, and their applied MDF dependence was investigated. The tanΨ and cosΔ spectra, in a photon energy range of 1.5–5.0 eV, of high-quality crystalline Al1-xInxN alloys were well fitted by Adachi's critical-point (ACP) model. The ACP model exhibited better spectral fitting results than did the Tauc–Lorentz model, which has often been adopted for Al1-xInxN alloys. The accuracy of the Eg values obtained by the ACP model was confirmed by optical reflectance measurements. It is suggested that the ACP model is a suitable MDF for recent high-quality crystalline Al1-xInxN alloys as well as other III-nitride semiconductors.
Export citation and abstract BibTeX RIS
1. Introduction
Al1-x Inx N alloys have attracted much attention for their use in optoelectronic device applications because their bandgap energy can be tuned over a wide range from 6.2 eV (AlN) to 0.65 eV (InN). 1) In particular, Al1-x Inx N alloys with x ∼ 0.17, nearly lattice-matched to GaN, are expected to have high performance in optoelectronic devices with a low defect density. 2–4) Recently, room-temperature continuous-wave operation of vertical-cavity surface-emitting lasers (VCSELs), with conducting Al0.86In0.18N/GaN-distributed Bragg reflectors (DBRs), has been achieved. 5–9) Because of the high refractive index contrast between Al0.86In0.18N and GaN ∼9% and the optimized growth condition, 46 pairs of Al1-x Inx N/GaN-DBRs, with peak reflectivities of over 99.9%, were reported. 5,9) The optical characteristics of DBRs are expected to be one of the key factors in determining device performance due to the short cavity length of the VCSELs (∼1 μm). Accurate characterizations of the optical constants and bandgap energy of Al1-x Inx N alloys are important for the further development of VCSELs and optical devices, including Al1-x Inx N alloys.
Indeed, the crystal quality of Al1-x Inx N has gradually improved, but the crystal growth of high-quality Al1-x Inx N remains difficult because of the large lattice mismatch, strong immiscibility, and large growth-temperature mismatch between AlN and InN. In connection with the difficulties of crystal growth, the optical constants of Al1-x Inx N alloys have not yet been widely reported. 10–16) There are few reports on the optical constants of Al1-x Inx N alloys across a wide photon energy range, especially around the bandgap-energy region. Generally, the optical constants and bandgap energy of semiconductors have been successfully obtained by the representative method of spectroscopic ellipsometry (SE). 10–26) In SE, the optical constants and bandgap energy are characterized from the tanΨ and cosΔ (or Ψ and Δ) spectra fitted by the model dielectric function (MDF). It is currently accepted that an analysis using a suitable MDF is the best way to obtain accurate optical constants. In the case of II–VI, III–V, and III-nitride semiconductors, SE spectra have been successfully reproduced by Adachi's critical-point (ACP) model, considering the energy band structure and excitonic effect at each critical point (CP). 17–23) However, SE characterizations using the ACP model have not yet been reported for Al1-x Inx N alloys. This is probably due to the poor crystalline quality of Al1-x Inx N alloys as compared to other III-nitride semiconductors. The Tauc–Lorentz (T–L) model, which was originally designed for amorphous semiconductors, is often adopted for Al1-x Inx N alloys. 11,12,14–16) The T–L model has also been applied to semiconductors with large spectral broadening and successfully reproduced experimental results. 11,12,14–16,24,25)
Recently, Miyoshi et al. have succeeded in producing high-quality crystalline Al1-x Inx N alloys with an extremely flat surface. 14–16) In this study, we analyzed the dispersion relationships of the optical constants and bandgap energy of high-quality crystalline Al1-x Inx N alloys grown on a c-plane freestanding (FS)-GaN substrate prepared by the Nagoya Institute of Technology. The SE spectra of these alloys were fitted by the ACP and T–L models, and the applied MDF dependence of the optical constants and bandgap energy was investigated. The bandgap energies were also estimated by optical reflectance (OR) measurements. The ACP model produced better fitting results than those of the T–L model. It is therefore suggested that the ACP model is the more suitable MDF for recent high-quality crystalline Al1-x Inx N alloys as well as for other III-nitride semiconductors.
2. Experimental procedures
Approximately 100 nm thick Al1-x
Inx
N alloys, with x values of 0.12 and 0.18, were grown by metal-organic chemical vapor deposition on a c-plane FS-GaN substrate. The growth procedures for these samples were the same as those in Ref. 15 without film thickness. The InN mole fraction was estimated by the reciprocal space mapping of high-resolution X-ray diffraction (XRD). SE measurements were conducted using an SE system with a rotating polarizer (SOPRA ES4G) at room temperature. A Xe lamp was used as a light source, and the incident angle was set to 75 The polarized reflection light was monochromated and detected by a photomultiplier tube. The detectable photon energy range of our SE system was 1.5–5.0 eV. In our SE measurement configuration, the ellipsometric parameters (Δ, Ψ) were mainly determined by the optical response of the electric-field polarization of incident light perpendicular to the c-axis of the sample (
E
⊥ c). The obtained optical constants thus primarily consist of an
E
⊥c direction component and include a slight
E
//c direction component. An OR measurement was also conducted using the monochromated Xe lamp as a probe light source, and the incident angle was set to 5
The polarized reflection light was monochromated and detected by a photomultiplier tube. The detectable photon energy range of our SE system was 1.5–5.0 eV. In our SE measurement configuration, the ellipsometric parameters (Δ, Ψ) were mainly determined by the optical response of the electric-field polarization of incident light perpendicular to the c-axis of the sample (
E
⊥ c). The obtained optical constants thus primarily consist of an
E
⊥c direction component and include a slight
E
//c direction component. An OR measurement was also conducted using the monochromated Xe lamp as a probe light source, and the incident angle was set to 5
3. Model dielectric functions
The SE characterization depends on the applied MDF, and it is related to the energy-band structure of the semiconductors. An analysis using suitable MDFs is therefore the best way to obtain accurate optical constants and bandgap energies. In the case of III-nitride semiconductors, such as GaN, InN, AlN, and their alloys, the dielectric functions have been successfully reproduced by the ACP model and modified ACP model. 17–20) In this study, we analyzed the SE spectra of Al1-x Inx N alloys by using the ACP model and compared the results with those of the T–L model.
In the T–L model, the imaginary part of the dielectric function ε2 (E) is given as follows:
The real part of the dielectric function ε1 (E) is given by the Kramers–Kronig relations and can be expressed as follows:

P is the principle value of the integral. A and C are the fitting parameters that correspond to the amplitude and spectral width of ε2 (E), respectively. E Tj , E0j , and ε1 (∞) are the bandgap energy of the amorphous semiconductor (called the Tauc gap), peak energy position of ε2 (E), and high-frequency dielectric constant, respectively.
The ACP model consists of the sum of the dielectric functions for each CP. The energy band structure around the Γ point, called the E0 gap, in wurtzite semiconductors is widely assumed to be the 3D M0 type, and the dielectric function is given as follows:


A0α , E0α , and Γ0α are the transition strength parameter, bandgap energy, and broadening parameter, respectively, for the optical transition between the α-valence band and conduction band. A, B, and C denote the heavy-hole, light-hole, and crystal-field split-off hole bands, respectively. The frequency-dependent damping constant is also included as the parameter α0. 18,19) The discrete excitonic transition around the E0 gap is expressed by the following:
 G0α
, and
G0α
, and  are the 3D exciton strength parameter, exciton binding energy, and broadening parameter, respectively. The continuum exciton state is also known to affect the dielectric function spectra.
27) We used the following equation:
20)
are the 3D exciton strength parameter, exciton binding energy, and broadening parameter, respectively. The continuum exciton state is also known to affect the dielectric function spectra.
27) We used the following equation:
20)
where F0α is the continuum exciton strength parameter.
It has been reported that the 2D excitonic transition dominates and that the one-electron contribution can be ignored for E1α transitions, which have been observed at a higher energy than the E0 gap in several II–VI, III–V, and III-nitride semiconductors. 17–23) In the case of Al1-x Inx N alloys with low x (0.14 ≤ x ≤ 0.23), relatively sharp peaks originating from the E1α transitions were observed in the range of 7–9 eV in the imaginary part of the dielectric function spectra. 13) These spectral shapes were similar to those of other materials 17–23) and were assumed to be a 2D excitonic transition dominating the optical transition around the E1 gap. In fact, the best fit was obtained when the one-electron contribution at the E1 gap was ignored. The discrete excitonic states at the E1 gaps can be expressed as follows:
 E1α
, G1α
, and
E1α
, G1α
, and  are the 2D exciton strength parameter, transition energy, binding energy of the 2D exciton, and broadening parameter of the E1α
transition, respectively. The frequency-dependent damping constant is included as the parameter α1.
18,19) We also included an additional term, ε1∞, to improve the fit. A detailed description of the ACP model can be found in Refs. 17–23. For the spectral fitting, the effect of surface roughness was considered by using Bruggeman's effective medium approximation.
17,26) The volume ratio of air and Al1-x
Inx
N was assumed to be 50%. A multilayer model of the air/surface-layer/Al1-x
Inx
N/GaN substrate was adopted, as shown in Fig. 1. Spectral fitting was conducted to minimize the following mean-square error function:
17,26)
are the 2D exciton strength parameter, transition energy, binding energy of the 2D exciton, and broadening parameter of the E1α
transition, respectively. The frequency-dependent damping constant is included as the parameter α1.
18,19) We also included an additional term, ε1∞, to improve the fit. A detailed description of the ACP model can be found in Refs. 17–23. For the spectral fitting, the effect of surface roughness was considered by using Bruggeman's effective medium approximation.
17,26) The volume ratio of air and Al1-x
Inx
N was assumed to be 50%. A multilayer model of the air/surface-layer/Al1-x
Inx
N/GaN substrate was adopted, as shown in Fig. 1. Spectral fitting was conducted to minimize the following mean-square error function:
17,26)
N, P, and E j are the number of data points, number of fitting parameters, and incident photon energy, respectively. ex and cal in Eq. (9) denote the experimental and calculated values.
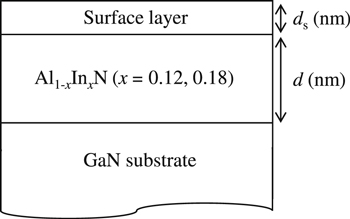
Fig. 1. Schematic illustration of the sample structure.
Download figure:
Standard image High-resolution image4. Results and discussion
Figures 2(a) and 2(b) show the XRD reciprocal space maps of Al1-x Inx N alloys in the vicinity of GaN 204 in reciprocal space. The omega rocking curves for the (002) and (102) planes of these samples are shown in Figs. 2(c) and 2(d). As shown in Figs. 2(a) and 2(b), coherent growth on the GaN substrate was confirmed in both samples. The full-width half-maxima of the rocking curves were estimated to be less than 200 arcsec.

Fig. 2. (Color online) X-ray diffraction reciprocal space mapping in the vicinity of GaN 204 in Al1-x Inx N alloys with (a) x = 0.12 and (b) x = 0.18, and (002) and (102) X-ray diffraction omega-rocking curves of the sample with (c) x = 0.12 and (d) x = 0.18.
Download figure:
Standard image High-resolution imageFigures 3(a) and 3(b) show the tanΨ and cosΔ spectra of the Al1-x Inx N alloys. The optical constants of the GaN substrate were also obtained by spectral fitting using the ACP model. 17–20) Because of the small splitting energy among the A, B, and C valence bands in GaN, we assumed them to be a single valence band. 17–20) The excited-state excitonic term (n ≥ 2) was also ignored due to its minor contribution to the MDF, as done in previous works. 17–20) The experimental spectra were well fitted by both MDFs. As listed in Table I, the ACP model had lower σ values for both samples, i.e. it yielded better fitting results than the T–L model. The fitting parameters used in the ACP model and T–L model are listed in Tables II and III, respectively. The obtained layer thicknesses of the surface (ds) and Al1-x Inx N layers (d) were almost the same in both models and were close to the designed film thickness (100 nm). For the spectral fitting using the ACP model, the best fit was obtained when the excitonic effects around the E0 gap in the Al1-x Inx N alloys were not taken into account. The optical transitions from the different valence bands at the E0 gap could not be separated by the spectral fitting. The following are possible reasons for this. Schulz et al. expected that polarization switching occurs when x = 0.15–0.18, i.e. the energy differences between different valence bands are expected to be the lowest for indium compositions in this range. 28) The obtained spectral broadening around the E0 gap is also expected to be larger than the energy differences between the three valence bands. The E1α transitions were also considered in the spectral fitting. Sakalaukas et al. measured the dielectric functions of Al1-x Inx N alloys across a wide photon energy range using SE attached to synchrotron radiation facilities and reported that E1A varied between 7.30 and 7.42 eV when x ranged between 0.14 and 0.23. 13) In the present study, the E1α transitions were outside the detectable photon energy range of our SE system; therefore, in the ACP model, we fixed the excitonic transition energies E1j –G1j (j = A, B, and C) on the basis of previously reported values. 13,17) For the spectral fitting, the fitting parameters of the closest E1 CP from the E0 gap (E1A ) were adjusted mainly to fit the experimental SE spectra. In the T–L model, we fitted the experimental spectra using a two-oscillator model (j = 2). E02 = 7.39 eV (x = 0.18) and 7.42 eV (x = 0.12), which are similar to the E1A –G1A values in the ACP model, were obtained. It should be noted that the fitting parameters of the GaN substrate were slightly adjusted from the values listed in Table II to obtain the best fit when fitting the T–L model.

Fig. 3. (Color online) (a) tanΨ and (b) cosΔ spectra of Al1-x Inx N alloys at room temperature obtained by SE. The circles are experimental spectra; the red lines and green broken lines show the model fit using the ACP and T–L models, respectively.
Download figure:
Standard image High-resolution imageTable I. σ obtained by the spectral fitting.
| σ (×10−3) | |||
|---|---|---|---|
| Sample | Fitting range (eV) | T–L | ACP |
| 1.5–3.5 | 10.1 | 10.1 | |
| Al0.88In0.12N | 3.5–5.0 | 12.7 | 9.1 |
| 1.5–5.0 | 10.3 | 8.3 | |
| Al0.82In0.18N | 1.5–3.5 | 10.5 | 8.3 |
| 3.5–5.0 | 15.5 | 9.6 | |
| 1.5–5.0 | 11.7 | 7.5 | |
Table II. Fitting parameters obtained by Adachi's CP model.
| Al1−x Inx N | |||
|---|---|---|---|
| GaN sub. | x = 0.12 | x = 0.18 | |
| ds (nm) | — | 5.21 | 6.60 |
| d (nm) | — | 86.0 | 90.3 |
| E0 (eV) | 3.45 | 4.56 | 4.25 |
| Γ0 (eV) | 0.060 | 0.11 | 0.19 |
| α0 | 0.22 | 0 | 0 |
| A0 (eV1.5) | 18.6 | 55.2 | 44.6 |
| A0 ex (eV) | 0.036 | 0 | 0 |
| G0 (eV) | 0.025 | — | — |
| Γ0 ex (eV) | 0.038 | — | — |
| F0 (eV2) | 0.026 | 0 | 0 |
| E1A –G1A (eV) | 6.9 | 7.5 | 7.4 |
 (eV) (eV) | 0.5 | 0.6 | 0.6 |
 (eV) (eV) | 4.2 | 2.3 | 3.6 |
| E1B –G1B (eV) | 7.9 | 8.2 | 8.2 |
 (eV) (eV) | 0.35 | 1.1 | 1.0 |
 (eV) (eV) | 1.0 | 2.5 | 2.5 |
| E1C –G1C (eV) | 9.0 | 9.0 | 9.0 |
 (eV) (eV) | 1.0 | 1.3 | 1.0 |
 (eV) (eV) | 2.8 | 1.0 | 1.0 |
| α1 | 0.03 | 0.2 | 0.2 |
| ε1∞ | 2.98 | 2.18 | 2.19 |
Table III. Fitting parameters obtained by the Tauc–Lorentz model.
| Al1−x Inx N | ||
|---|---|---|
| x = 0.12 | x = 0.18 | |
| ds (nm) | 5.11 | 5.87 |
| d (nm) | 86.7 | 90.2 |
| A1 (eV) | 99.5 | 64.0 |
| C1 (eV) | 4.29 | 4.35 |
| Ε01 (eV) | 4.61 | 4.59 |
| ET1 (eV) | 4.07 | 3.65 |
| A2(eV) | 92.7 | 99.5 |
| C2 (eV) | 0.86 | 2.02 |
| Ε02 (eV) | 7.42 | 7.39 |
| ET2 (eV) | 5.98 | 5.73 |
| ε1 (∞) | 0.61 | 0.55 |
Figure 4(a) shows the dispersion relationship of the refractive index in the Al1-x
Inx
N alloys with x = 0.18 obtained by the T–L model. The obtained refractive index agrees well with previous reports using the T–L model.
12,14,15) Figure 4(b) shows (αE)2 plotted as a function of the photon energy. α is the absorption coefficient, which was obtained from the extinction coefficient using the relationship α = 4πk/λ. Here, k and λ are the extinction coefficient and incident wavelength, respectively. In the T–L model, the bandgap energy Eg for direct gap semiconductors was obtained from the extended Tauc formula α  (E
(E
 Eg)1/2.
12,14–16,26)
Eg can be estimated from the intersection of the tangent of (αE)2 with the energy axis. When we estimated the bandgap energy in the same manner [the tangent of (αE)2 was fitted in the same range of the vertical axis] as in Refs. 12 and 14–16, that of the Al0.82In0.18N alloy was estimated to be 3.91 eV. This agrees well with the previously reported value of 3.92 eV in an Al0.821In0.179N alloy grown on a FS-GaN substrate.
15) Thus, in this work, spectral fitting by the T–L model was conducted as precisely as in previous works. The bandgap energy in the Al0.88In0.12N alloy was estimated to be 4.30 eV using the same method. The bandgap energies obtained by the T–L model were smaller than those obtained by the ACP model (4.56 eV for x = 0.12 and 4.25 eV for x = 0.18).
Eg)1/2.
12,14–16,26)
Eg can be estimated from the intersection of the tangent of (αE)2 with the energy axis. When we estimated the bandgap energy in the same manner [the tangent of (αE)2 was fitted in the same range of the vertical axis] as in Refs. 12 and 14–16, that of the Al0.82In0.18N alloy was estimated to be 3.91 eV. This agrees well with the previously reported value of 3.92 eV in an Al0.821In0.179N alloy grown on a FS-GaN substrate.
15) Thus, in this work, spectral fitting by the T–L model was conducted as precisely as in previous works. The bandgap energy in the Al0.88In0.12N alloy was estimated to be 4.30 eV using the same method. The bandgap energies obtained by the T–L model were smaller than those obtained by the ACP model (4.56 eV for x = 0.12 and 4.25 eV for x = 0.18).
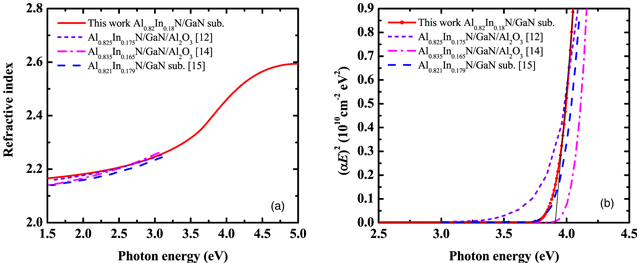
Fig. 4. (Color online) (a) Dispersion relationship of the refractive index and (b) (αE)2 plotted as a function of photon energy in the Al0.82In0.18N alloy obtained by the T–L model. Values from the literature are shown for comparison. 12,14,15) The black line shows the liner fitting of the (αE)2–E plot. The bandgap energy was estimated from the intersection with the energy axis.
Download figure:
Standard image High-resolution imageFigures 5(a) and 5(b) show the dispersion relationships of the refractive index and extinction coefficient in Al1-x Inx N alloys obtained by the ACP and T–L models. The obtained dispersion relationships revealed differences between the two models around the bandgap. When we estimated σ, we divided the range into two energy regions: the transparent region (1.5–3.5 eV) and the region surrounding the bandgap for Al1-x Inx N (3.5–5.0 eV), as listed in Table I. This revealed that the spectral fitting around the bandgap energy region was substantially better when using the ACP model than when using the T–L model. It was thus expected that the ACP model would yield more precise optical constants around the bandgap energy regions than those obtained by the T–L model. Here, we understand that because the E1α transitions were not included in the spectral fitting in this study, there is still room for improvement. The extinction coefficient spectra also revealed remarkable differences between the two models. Those obtained using the T–L model dropped steeply to zero below ET1 and were smaller than those obtained by the ACP model in the transparent region. This is because below ET1, ε2 (E) is assumed to be zero in the T–L model. Note that the detection limit of the extinction coefficient is approximately 0.01 (on the order of 103 cm−1 for the absorption coefficient) in the transparent energy regions, and this detection limit is a typical value of the SE system (on the order of 102– 103 cm−1). 26) Thus, extinction coefficients below the bandgap region were probably underestimated in the T–L model. The extinction coefficients obtained by the ACP model were larger than those from the T–L model in the transparent energy region, but the extinction coefficients obtained by the ACP model were also close to the detection limit of SE. Thus, we cannot currently determine the accuracy of the extinction coefficient spectra in the transparent region. Other measurement techniques, such as photothermal deflection spectroscopy, are required to quantify this.
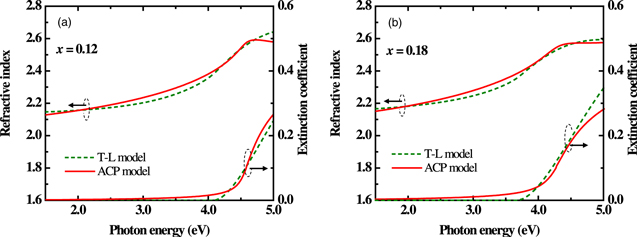
Fig. 5. (Color online) Dispersion relationships of the refractive index and extinction coefficients obtained by the T–L model (green broken lines) and ACP model (red lines) in the (a) Al0.88In0.12N and (b) Al0.82In0.18N alloys.
Download figure:
Standard image High-resolution imageThe OR spectra of both samples are shown in Fig. 6. Generally, the bandgap energy is estimated from the onset energy of the Fabry–Pérot (F–P) interferences in the OR spectrum. 29,30) The onset energies of the F–P interferences in the OR spectra agree well with the bandgap energies obtained by the ACP model. Those obtained by the T–L model are also indicated with arrows, but these are clearly small (F–P interferences are already observed at those energies). The Eg values obtained by the ACP model are plotted and compared with previous reports in Fig. 7.
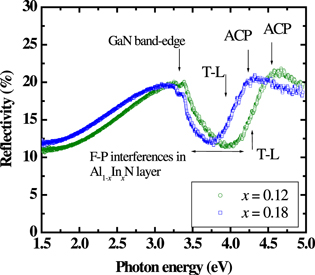
Fig. 6. (Color online) Room temperature OR spectra of the Al0.88In0.12N (green circles) and Al0.82In0.18N (blue squares) alloys. The bandgap energies obtained by the ACP and T–L models are indicated by arrows.
Download figure:
Standard image High-resolution image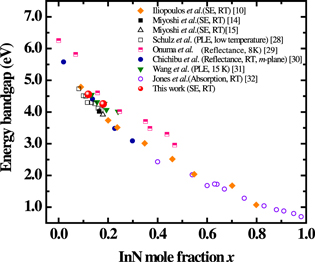
Fig. 7. (Color online) Bandgap energy of Al1-x Inx N alloys obtained by the ACP model as a function of x. Values from the literature are shown for comparison. 10,14,15,28–32)
Download figure:
Standard image High-resolution image
Al1-x Inx N alloys are known to have a large spectral broadening around the bandgap. 10,11,29–31) In the case of the T–L model, the bandgap energy was generally obtained from the (αE)2–E plot, as shown in Fig. 4(b). In such a large broadening system, the obtained bandgap energy value is expected to be highly affected by the range of the fitting region of the (αE)2–E plot. When we analyzed the bandgap energy with a wider fitting range than what is shown in Fig. 4(b), the estimated bandgap energy increased. For example, the bandgap energy of the Al0.82In0.18N alloy was estimated to be 4.25 eV when we fitted the tangent of (αE)2 in the range of 0 to 1.1 × 1011 cm−2 eV2. Thus, the smaller bandgap energies obtained by the T–L model as compared to the ACP model originate from a narrow fitting range of the (αE)2–E plot. The optical constants and bandgap energy were obtained relatively easily from the T–L model with a small number of fitting parameters, and a good fitting result was obtained. However, care is necessary when estimating the bandgap energy from the (αE)2–E plot. It is also suggested that the ACP model is a more suitable MDF for obtaining accurate optical constants and bandgap energies for recent high-quality crystalline Al1-x Inx N alloys grown on a c-plane FS-GaN substrate as well as other III-nitride semiconductors and their alloys.
5. Conclusions
The dispersion relationships of the optical constants and bandgap energy in high-quality crystalline Al1-x Inx N alloys grown on a c-plane FS-GaN substrate were characterized by SE, and the applied MDF dependence was investigated. The SE spectra of the Al1-x Inx N alloys were well fitted by both the T–L and ACP models. The ACP model exhibited better fitting results than the T–L model. In particular, the spectral fitting around the bandgap energy region was better when using the ACP model. In the T–L model, the bandgap energy was estimated from the (αE)2–E plot, and the obtained bandgap energy was highly affected by the range of the linear fitting region. As a result, the bandgap energies were estimated to be smaller than those obtained by the ACP model. The accuracy of the bandgap energies obtained by the ACP model was confirmed by the OR measurement. It is therefore suggested that the ACP model is a suitable MDF for recent high-quality crystalline Al1-x Inx N alloys as well as other III-nitride semiconductors.
Acknowledgments
The authors would like to acknowledge Prof. Dr. H. Yaguchi (Saitama Univ., Japan) for his help with the SE measurements and Prof. Dr. S. Kamiyama and Prof. Dr. M. Iwaya (Meijo Univ., Japan) for providing the XRD measurement system. This work was partly supported by the Grants-in-Aid for Scientific Research (C), No. 17K06360, Young Research, No. 20K15182 from the Japan Society for the Promotion of Science [JSPS KAKENHI], MEXT "Program for research and development of next-generation semiconductors to realize an energy-saving society" Program Grant No. JPJ005357, and the Ichihara International Scholarship Foundation.