

Abstract
Raman spectra from crystals contain a mixture of peaks from various phonon modes. Angle-resolved polarized Raman spectroscopy, in which numerous spectra are obtained with different polarization angles of incident and scattered lights, is widely used to separate peaks by considering the symmetries of the Raman tensor. In the present study, to efficiently process large amounts of spectral data, we apply multivariate curve resolution (MCR) to Raman spectra from a typical ferroelectric PbTiO3 crystal to reduce the number of spectra to be fitted. The spectra to fit are thus reduced to three, and their fits determine all the phonon parameters, such as frequency shift, width, and integrated intensity. The angle dependence of the integrated intensity was determined by multiplying the integrated intensity of the three peaks by the angle profiles obtained by MCR. Thus, angle-resolved polarized Raman spectroscopy combined with MCR provides an efficient way to determine phonon parameters.
Export citation and abstract BibTeX RIS
1. Introduction
The use of Raman scattering to investigate materials is widely accepted because it can label structures and determine the composition of materials. For solid-state physicists, a Raman spectrum provides rich and highly accurate information about the vibrational modes (i.e. phonons) that can be used in both qualitative and quantitative analytical applications.1) Because Raman spectroscopy can detect changes in phonons, it has attracted much attention as a probe of structural phase transitions induced by softening of characteristic phonons.1–6) In other words, Raman spectroscopy can shed light on the microscopic details of structural phase transitions.
Raman scattering from optical phonons depends on Raman tensors derived from the point symmetry of crystals; thus, polarized Raman spectroscopy has been used to distinguish between characteristic modes. However, varying the scattering geometry to probe various tensor components introduces difficulties because it usually requires the repositioning of optical elements in the measurement system. One powerful technique to overcome these difficulties is angle-resolved polarized Raman spectroscopy, whereby a computer-controlled half-wave plate in the microscope changes the polarization of both incident and scattered light to any angle θ to change the Raman tensor components observed [see Fig. 1(a)].7–12) Note that angle-resolved polarized Raman spectroscopy may also be done by rotating the crystal sample instead of rotating the polarization direction of the incident and scattered light, or by rotating the polarization of the incident and scattered light separately.13–19) The Raman-peak intensity as a function of angle gives information about the crystal sample, such as the point group or the optical axis. Up to now, to clarify the origin of structural phase transitions in ferroelectric materials, we have measured Raman-peak intensity as a function of angle and assigned the peaks to soft-phonon modes.

Fig. 1. (Color online) (a) Rotation of polarization angle for Raman scattering by using a half-wave plate. In the present study, the angle θ is set from [010] for tetragonal PbTiO3. (b) Raman spectra of PbTiO3 for five angles θ in a parallel polarization (HH) scattering geometry (obtained from Ref. 7). The θ dependence is illustrated by arrows.
Download figure:
Standard image High-resolution imageOne of the most important classes of structural phase transitions is the paraelectric–ferroelectric phase transition, in which dielectric and piezoelectric responses are induced just below the phase transition temperature.2,3) Because of their enhanced responses, ferroelectrics are widely used in applications in the form of capacitors in electronics and ultrasonic transducers for diagnostic devices. As a result, the microscopic details of this phase transition have been investigated from both fundamental and applied viewpoints.20)
Figure 1(b) shows an example of room-temperature angle-resolved polarized Raman spectra of a ferroelectric PbTiO3 crystal, showing phonon peaks at different angles θ.7) For the peak at 219 cm−1, the intensity is a maximum at 45° and a minimum at 0° and 90°, which is characteristic of the Raman tensor of E(y) of the tetragonal 4mm structure. The asymmetric peak near 148 cm−1 is the soft mode of the paraelectric–ferroelectric phase transition, an A1 (z) mode, whose angle dependence differs from an E(y) mode.21–24) The analysis of this peak provides abundant information on the phase transition, such as the thermodynamic potential. In a previous study, we used angle-resolved polarized Raman spectroscopy to determine the displacive-type mechanism of a paraelectric–ferroelectric phase transition in BaTi2O5.8,25) In this phenomenon, the phase transition is promoted by the narrowing of quasi-elastic scattering that is assigned, based on the angle dependence, to a soft, overdamped phonon (the A mode in the ferroelectric phase and the Au mode in the paraelectric phase). Although the temperature dependence of quasi-elastic scattering led previous publications to attribute this mechanism to an order–disorder-type phase transition,26,27) our previous study provided an interpretation more consistent with the crystal structure of both the paraelectric phase and the ferroelectric phase.28)
Although this mode assignment based on angle-resolved polarized Raman spectroscopy seems to be simple and straightforward, the overlap of peaks often makes it challenging to obtain the correct intensity of each peak by least squares fitting with multiple Lorentzian functions, as shown in Fig. 1(b) near 148 cm−1. Because the anharmonic potential broadens the soft modes of the paraelectric–ferroelectric phase transition, this problem appears frequently, and fitting the numerous resulting spectra is a burden. Therefore, sophisticated data-analysis methods are required to extract the abundant underlying information on lattice dynamics.
Angle-resolved polarized Raman scattering data are usually arranged in a matrix with rows (columns) containing the frequency shifts (polarization angle θ), as shown on the left side of Fig. 2(a). Variations in Raman-peak intensity in the spectral data are periodic and depend on the type of phonon modes in the crystal. In other words, the matrix data are a mixture of phonon modes with different angle periodicity. If the matrix can be decomposed into angle profiles and spectra for each profile, the number of spectra to be analyzed can be reduced to the number of profiles. In the present study, we show that multivariate curve resolution (MCR) is a powerful tool for analyzing angle-resolved polarized Raman spectra.29)

Fig. 2. (Color online) (a) Multivariate curve resolution (MCR) concept for angle-resolved polarized Raman spectroscopy assuming three components. (b) Experimental results and results of MCR analysis for PbTiO3. In the present study, we acquired 39 spectra with different θ in the HH configuration. By using MCR, the initial 39 spectra are resolved to three spectra and three θ profiles.
Download figure:
Standard image High-resolution image2. Experimental methods
MCR is a matrix factorization technique that involves linear combinations of a prescribed number of spectral components and their constrained angle dependence.30–33) The concept is illustrated in Fig. 2(a). An m × n non-negative data matrix containing Raman spectra acquired at different θ is decomposable into rows (base spectra) and columns (angle profiles). The prescribed number is usually determined by singular value decomposition.34) Note that MCR requires little a priori information on samples. In the present study, MCR was done by using the multivariate statistical analysis software Unscrambler X (Camo Analytics).
Raman spectra of the (100) PbTiO3 crystal of Ref. 7 was used to determine the applicability of MCR to angle-resolved polarized Raman spectroscopy. The data were obtained in a backscattering geometry by using a U-1000 double monochromator equipped with a Symphony CCD camera (Jobin-Yvon) configured for parallel polarization (horizontal to horizontal: HH). The linearly polarized 514.5 nm line of an argon-ion laser (NEC) served as the excitation source. A polarization-rotation device (Sigma Koki) equipped with a broadband half-wave plate (Kogakugiken) was placed in the microscope, and the rotation angle of the wave plate was controlled electrically with a reproducibility exceeding 0.05°.
3. Results and discussion
Figure 2(b) shows a contour map of the angle-resolved polarized Raman spectra of PbTiO3. The contour map clearly shows the θ dependence of each Raman-peak. MCR was used to collect these spectra: a 4027 × 39 data matrix is decomposed to the inner product of a 4027 × 3 matrix and a 3 × 39 matrix. Thus, with no prior information concerning the nature of the crystal and no curve fitting, MCR extracts three types of spectra with three θ profiles. Three base spectra called "factor 1", "factor 2", and "factor 3" show the θ dependence of "profile 1", "profile 2", and "profile 3", respectively. By summing up inner products of each factor and profile, the matrix of raw data can be reproduced.
The θ profiles should reflect the 2 × 2 matrix of the Raman tensor. PbTiO3 of the tetragonal 4mm structure has three Raman active modes: the A1 (z), B1, and E modes. Due to the symmetry of the Raman tensor, the intensity of E-mode peaks may be proportional to sin2θ (see calculation in Ref. 7). The function sin2θ agrees with the third angle profile p3 [see right part of Fig. 2(b)]. Peaks at 202 and 503 cm−1 appear only in the third base spectrum (factor 3), indicating that these are E-mode peaks. If a peak has the same frequency shift and the same width in two or three factors, then several processes are used to determine the θ dependence of the peak intensity. Figure 3 explains the processes by using the peak at 645 cm−1 as an example. As a first step, by assuming that a spectrum can be reproduced by a superposition of Lorentzian functions, base spectra (factors 1–3) are fit by least squares. Next, the integrated intensities of the peak at 645 cm−1 in each factor, I1, I2, and I3, are obtained, as shown in Fig. 3(a). Here I1, I2, and I3 change in intensity with θ proportional to p1, p2, and p3. Therefore, the second step is to sum the intensities weighted by the θ profiles (i.e. I1p1 + I2p2 + I3p3). Figure 3(b) shows the resultant θ dependence of the peak intensity at 645 cm−1. By comparing the result with the expected θ dependence calculated by using the Raman tensors, we assign the peaks to phonon modes.
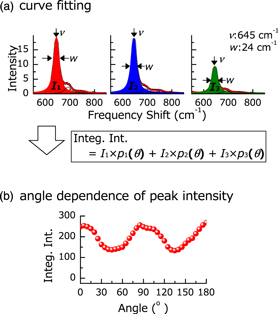
Fig. 3. (Color online) (a) Example of curve fitting of base spectra (three factors) obtained by MCR. Peak shift, width, and intensity are determined by fitting. When a peak appears in three factors, the integrated intensity is given by the sum  (b) Integrated intensity of 24 cm−1 wide peak at 645 cm−1 as a function of angle θ.
Download figure:
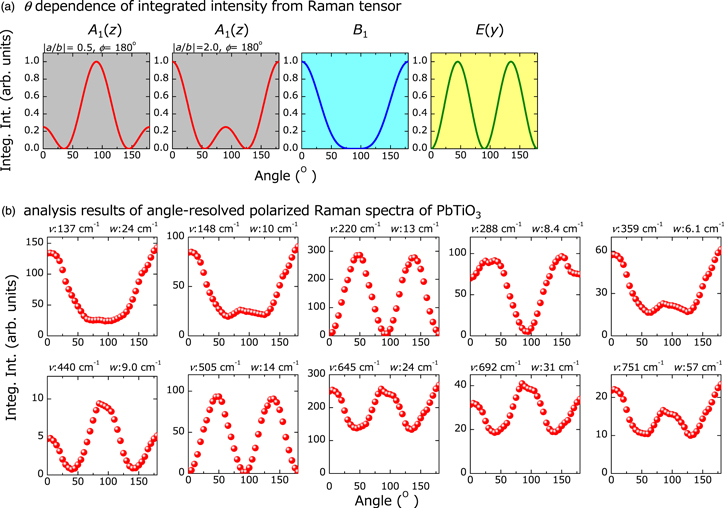
Standard image High-resolution imageFigure 4(a) shows the integrated intensity of phonon modes as a function of θ, calculated by using the allowed Raman tensors for PbTiO3. Although the B1 and E(y) modes are uniquely determined as functions of θ, the A1 (z) mode depends on both a tensor-component ratio  and a phase difference ϕ. The difference arises because the Raman tensor of the B1 and E(y) modes contains the component c and e, respectively, whereas the Raman tensor of the A1 (z) mode contains two different components, a and b. By comparing the calculated patterns in Fig. 4(a) with the experimental result in Fig. 3(b), the Raman scattering peak at 645 cm−1 is assigned to the A mode with
  and ϕ = 90°.
Fig. 4. (Color online) (a) Scattering intensity of each mode calculated based on Raman tensor and as a function of θ. (b) Integrated intensity as a function of θ and with peak shift and width obtained by using the procedure illustrated in Fig. 3.
Download figure:
Standard image High-resolution image
For each peak in Raman spectra, Fig. 4(b) shows all the parameters determined by angle-resolved polarized Raman spectroscopy of the PbTiO3 crystal (frequency shift, width, and angle dependent intensity). By comparing the expected dependencies in Fig. 4(a) with the angle dependencies of each peak in Fig. 4(b), the peaks at 220 and 505 cm−1 are assigned to the E-mode, the peaks at 137, 148, 359, 645, 692, and 751 cm−1 are assigned to the A1 (z) mode, and the peak at 288 cm−1 is assigned to a mixture of B1 and E modes. These assignments are consistent with previous studies.7,21–24)
Thus, MCR proves to be a powerful analytical method that can exploit the characteristics of numerous spectra to reduce the number of spectra that must be analyzed in angle-resolved polarized Raman spectroscopy. Note that the procedure for fitting the three PbTiO3 spectra is easier than for the raw spectra because MCR decreases the number of peaks to be fit in a given spectrum. In addition, tiny peaks difficult to differentiate from the background were detected in this work because MCR separates Raman peaks from all the raw data. By following the similar procedure, MCR can be applied to other angle-resolved spectroscopies such as Brillouin spectroscopy.12,35)
Because angle-resolved polarized Raman spectroscopy is used not only for homogeneous materials but also for inhomogeneous materials to investigate average or local structures and their temperature evolution, as done herein,36–44) we expect that spectroscopic techniques combined with MCR analysis will soon become widely used in materials science.
4. Conclusions
MCR enables us to reduce the number of spectra to be analyzed from the numerous spectra obtained by angle-resolved polarized Raman spectroscopy. Because soft-phonon modes are intrinsically broad and overlap with other peaks, all spectra obtained in this way are usually fit one by one to determine the peak shift, width, and intensity, which introduces ambiguity and is time-consuming to get reliable parameters, especially for beginners. In the present study, MCR allows us to analyze only three spectra from PbTiO3 instead of 39 spectra and yet still accurately reproduces the θ-dependent integrated intensity. Thus, MCR provides an efficient approach to handle spectra obtained by angle-resolved polarized Raman spectroscopy. Because the investigation of macroscopic properties, such as phase transitions, requires several tens of spectra at different angles, temperatures, and pressures, the proposed MCR method proves useful and should be further developed.
Acknowledgments
We would like to thank Hemanth Noothalapati and Tatsuyuki Yamamoto of Shimane University for stimulating discussions on MCR. This study was partly supported by JSPS KAKENHI Grant No. 17K05030 and 19K05252.