


Abstract
We utilize whole-body Hydra regeneration from a small tissue segment to develop a physics framework for animal morphogenesis. Introducing experimental controls over this process, an external electric field and a drug that blocks gap junctions, allows us to characterize the essential step in the morphological transition —from a spherical shape to an elongated spheroid. We find that spatial fluctuations of the Ca2+ distribution in the Hydra's tissue drive this transition and construct a field-theoretic model that explains the morphological transition as a first-order–like phase transition resulting from the coupling of the Ca2+ field and the tissue's local curvature. Various predictions of this model are verified experimentally.
Export citation and abstract BibTeX RIS

Published by the EPLA under the terms of the Creative Commons Attribution 4.0 International License (CC-BY). Further distribution of this work must maintain attribution to the author(s) and the published article's title, journal citation, and DOI.
How does a robust stereotypical body form emerge in animal development? Recent works show that morphogenesis, at different stages of development and in a variety of organisms, involves multiple interconnected biochemical [1,2] mechanical [3–11], and electrical [12–16] processes. From a physical perspective, morphogenesis is far-from-equilibrium pattern formation dynamics driven by active internal forces. Despite recent progress, a framework describing the coordination and integration of the processes underlying morphological transition in morphogenesis remains a major challenge. In particular, it is unclear what the primary fields that drive the morphological transition are and whether morphogenesis is a slow incremental process reflecting the accumulation of small changes, a sharp transition, or an avalanche of a series of transitions. This letter aims to be a step toward gaining insight into these fundamental issues.
Hydra, a small freshwater multicellular organism made out, essentially, of a bilayer epithelial tissue with a uniaxial geometry [17–19], provides a unique system for such an investigation [7,20–25]. Whole-body Hydra can be regenerated from a small tissue segment almost without cell division [23,26], see fig. 1(a) and movies 1, 2 linked in the Supplementary Material Supplementarymaterial.pdf (SM). An excised tissue fragment first forms a closed spheroidal shape and then elongates towards a cylindrical shape —the body form of a mature Hydra [7,21]. The appearance of tentacles, a head and a foot, completes the developmental process.

Fig. 1: Morphogenesis as phase transition dynamics. (a) A stereotypical regeneration of the Hydra's tissue from a spheroidal (approximately 300 μm in diameter) to a cylindrical shape (red arrow), complemented by the appearance of tentacles in the mature, fully developed animal. (b) An example time trace of the shape parameter Λ that characterizes the morphology of the Hydra's tissue under normal conditions (t = 0 is the start of the experimental recording of the spheroidal closed tissue segment). This parameter is zero when the tissue is spherical and approaches one when it becomes an elongated cylinder. Most of the time, the tissue fluctuates near a spherical shape. The transition, marked by the red arrow, occurs within a few minutes. The lower panels show time traces of the normalized shape parameter Λn around the transition time tc , averaged over tissue samples: (c) seven tissue samples for normal regeneration in a normal Hydra medium (HM), (d) six tissue samples regenerating under Heptanol (300 μl/l in HM), and (e) six tissue samples regenerating under an external electric field (30 V/4 mm in HM). The experimental data were fitted to a smooth step function, a + b tanh [(t − c)/d] and then normalized by shifting the transition point to zero, subtracting a − b, and dividing by 2b. Thus, the normalized data feature a transition between Λn = 0 and Λn = 1, which occurs at t = 0. Finally, the normalized data of each sample are represented by an interpolating function, and the resulting functions are averaged over the ensemble of samples. The solid black curves represent the instantons that describe the transitions (q2 (t) from eq. (8)).
Download figure:
Standard imageAn essential experimental step in understanding the nature of the morphological transition is to introduce controls that affect the pattern formation process. Recently, one of us showed that Hydra morphogenesis could be modulated on demand; regeneration can be halted in a reversible way and even be reversed when the tissue is subjected to an external electric field [13]. Heptanol —a drug that blocks gap junctions responsible for the long-range electrical communication in the tissue— was also shown by us to reversibly halt the morphological transition in Hydra regeneration [12].
An external electric field and Heptanol strongly affect the calcium (Ca2+) activity in the Hydra's epithelial tissue. While the external electric field enhances the Ca2+ activity and its spatial correlations, blocking gap junction suppresses them [12]. The Hydra epithelial tissue is a muscle, and the Ca2+ activity controls its internal contractile forces by enabling the operation of myosin motors on the actin fibers [20,27–31]. The mechanical balance between these forces and the pressure applied by the fluid within the cavity, enclosed by the epithelial bilayer tissue, determines the tissue's morphology [7,22,24,32–34]. Thus, the Ca2+ activity directly affects the shape of the Hydra's tissue, making the external electric field and Heptanol effective experimental controls of its morphology.
In a previous study [12], we showed that the experimental probability distributions of the spatial configurations of the Ca2+ field, ϕ, as well as their dependence on the controls, can be well modeled by ![$P\left[\phi \right]=\exp \left(-S_{\mathrm{Ca}}\right)/Z_{\mathrm{Ca}}$](https://content.cld.iop.org/journals/0295-5075/143/2/27001/revision4/epl23100282ieqn1.gif) , where
, where  is a normalization constant, and

Here, U (ϕ) is a tilted double-well potential reflecting the electrically excitable nature of the Hydra's epithelial tissue, while D is a stiffness parameter that limits large spatial gradients of ϕ. The integral in eq. (1) is over the whole Hydra closed surface, parametrized by a two-component vector  , and g is the determinant of the corresponding metric tensor
  . This model ignores the coupling of the Ca2+ field to the tissue's morphological structure.
Here, we experimentally characterize the significant morphological transition of the regenerating Hydra's tissue, from a spheroidal shape into a persistent elongated cylindrical shape (red arrow of fig. 1(a)) and show that a simplified field-theoretic model, based on the coupling between the Ca2+ field and the scalar (twice the Gaussian) curvature of the tissue, captures the main features of the experimental data. In contrast with other models of epithelial morphogenesis, which describe the system at a cell resolution level (e.g., vertex models [35,36]), our model is a coarse-grained description of whole-tissue morphogenesis. It constitutes a qualitative description of the major morphological transition of the Hydra's tissue between two basic shapes characterizing two different stages of morphogenesis: a spherical shape at the onset of the process and a cylindrical shape towards the completion of the regeneration process. This model shows that the morphological transition resembles the dynamics of a phase transition of the first-order type. It also explains the mechanisms by which the Heptanol and the electric field halt regeneration and provides three insights that we verified experimentally: a) Negative correlations between the fluctuations in the scalar curvature of the tissue and the local Ca2+ activity. b) Reversal of a mature Hydra's morphology from a cylindrical shape back into a spheroidal one by weakening the internal muscle forces by Heptanol, and c) re-initiation of the morphogenesis process by the application of an electric field simultaneously with Heptanol that halts regeneration.
In the experiment, tissue fragments are excised from the middle regions of mature Hydra, expressing a fast Ca2+ fluorescence probe (GCaMP6s) in its epithelial (endoderm) cells [12,13,31]. The fragments were allowed to fold into spheroids for ∼3 hrs and then placed in the experimental setup under a fluorescence microscope (see [12] and the SM for details of the experimental methods).
To characterize the morphological transition, we define the tissue's shape parameter  , where A is the tissue's projected area and L is its perimeter. For a spherical tissue Λ = 0, while any deformation increases its value. This shape parameter faithfully characterizes the Hydra's tissue form, as long as its regeneration is far from completion. At this period, the tissue is approximately a spheroid whose axis is parallel to the microscopy imaging projection plane. Shape fluctuations of the spheroidal tissue towards a prolate shape occur primarily along the body axis of the regenerating Hydra, pre-determined by the ectoderm longitudinal supracellular actin fibers [7,20]. These shape fluctuations, together with gravity and friction, predominantly align the spheroid axis parallel to the imaging projection plane.
Figure 1(b) shows a typical time trace of Λ(t) for a Hydra's tissue regenerating under normal conditions. The transition from a spheroidal shape into a cylindrical one (red arrow in fig. 1(b)) occurs within a strikingly short time period. A zoom over the normalized shape parameter around the transition region, averaged over six tissue samples, is depicted in fig. 1(c). It shows that the transition occurs over approximately eight minutes. This is an extremely short time scale compared to the typical mechanical relaxation time scale of the tissue, measured to be around 100 minutes [12], and following a long duration of many hours in which the Hydra's tissue remains approximately spherical.
Heptanol allows for halting the morphological transition, but variability among different tissue samples leads some of them to escape and proceed along the regeneration trajectory (∼20–30% of the samples). Again, these samples show a sharp morphological transition but more moderate than the transition under normal conditions, see fig. 1(d). Here, the typical transition time is 28 minutes.
Similarly, slightly below the critical electric field that halts regeneration [12,13], tissue samples proceed along the regeneration trajectory. These samples also show a sharp morphological transition, as demonstrated in fig. 1(e). Examples of area and shape parameter traces for individual tissue samples under the different controls are shown in the SM.
To understand these results, we consider a minimal model of the Hydra's tissue, ignoring its bilayer structure and regarding the tissue as a closed 2D surface [37] with a minimal coupling of its curvature to the Ca2+ field, ϕ, given by the Jackiw-Teitelboim action [38–41],

Here  is the scalar curvature and η is the coupling strength. While the mechanism of the effect of Ca2+ on the curvature is understood (see SM), the above coupling action also implies a feedback effect of curvature on the calcium activity. The feedback mechanism is poorly understood but should exist for effective control of morphogenesis [3,42–45]. It is also supported by the Granger causality analysis provided in the SM.
The third component of our model is the action that dictates the probability of the tissue's morphological configurations. The Hydra tissue is a muscle made of cells that actively stretch and compress. It cannot be considered an elastic sheet or a simple membrane. The observation that its area may change dramatically near the morphological transition (see figs. S1–S3 in the SM) implies that morphological changes which do not preserve isometry are very soft. At the same time, the distinctive manner by which an excised, almost flat, tissue fragment encloses on itself to form a spheroidal shape, suggests that the tissue curvature plays a central role in determining its morphology. Taking into account that the scalar curvature of a closed surface is a topological invariant, the simplest action that governs the tissue shape is

where  is the mean curvature, and
  is the spontaneous curvature of the tissue in the absence of constraints. This action has the same form of the Canham-Helfrich free energy of membrane [46,47] where B is analogous to the bending modulus. However, its microscopic origin is not well understood.
Our modeling starting point is the total action,

which, together with a constraint over the volume enclosed by the tissue, dictates the probability,  (Z is the normalization constant), of the various configurations of the system. For justification of this model and discussion of its extensions, we refer the reader to the SM.
Consider axisymmetric deformations of the tissue's spherical state described by a surface of revolution. Its distance from the origin as a function of the polar coordinate, θ, is given by

where −0.5 < q < 1 to prevent self-intersections of the surface and R0 (q) is a positive function, chosen such that the volume enclosed by the tissue is fixed. The angular dependence in eq. (5) is proportional to the spherical harmonic function  , which is the leading term describing a symmetric uniaxial deformation. Depending on the sign of the parameter q, R(θ) describes a prolate or an oblate surface of revolution, as shown in the insets of fig. 2. Substituting (5) in (4) and integrating over the configurations of the Ca2+ field yields the potential V (q) that determines the possible stable and metastable states of the system,

The evaluation of this integral, assuming the metastable states of the system are long-lived, yields the potential plotted in fig. 2 (for details of the calculation, see SM). This potential has two minima: One at q = 0 describing a spherical tissue and another one at q = q0 > 0 describing a prolate shape. For sufficiently strong coupling,  , the spherical state becomes unstable. Thus, a tissue prepared in the spherical state will transform into an elongated shape by an activation over the barrier. This transition can be approximately described by the Langevin equation

where  is a stationary Gaussian white noise with instantaneous correlations,
  , and zero mean. The source of this noise is the fast temporal fluctuations of the Ca2+ field.
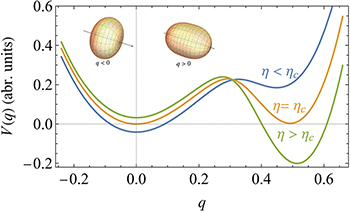
Fig. 2: The morphological potential. The potential V (q) for several values of the coupling strength between the Ca2+ field and the tissue's curvature η. The minimum at q = 0 represents a spherical tissue shape, while that at q > 0 is associated with an approximate prolate spheroidal shape, right after the first stage of the morphological transition. Negative and positive values of q are associated with oblate and prolate ellipsoids, respectively, as demonstrated by the insets. The second minimum becomes a global minimum when the coupling parameter between the Ca2+ field and the tissue's curvature exceeds a critical value,  . The morphological evolution is the dynamical process of a transition from the metastable spherical state to the lower-energy elongated state, described by eq. (7).
Download figure:
Standard imageTo characterize the solution of eq. (7), we approximate the double well potential by  , where λ controls the barrier height and μ determines the tilt. For
  and an intermediate level of the noise strength, the instanton that describes the transition from q = 0 to q = q0 [48,49] is approximately given by (see also SM):

Finally, to relate this solution to the experimental data shown in fig. 1, one has to connect q with the shape parameter Λ. Our microscopy imaging projection, by contrast to our theory, cannot distinguish between prolate (q > 0) and oblate (q < 0) shapes. For a tissue shape similar to the surface of revolution described by eq. (5), the shape parameter is  , i.e.,
  for
for  .
.
The parameter that characterizes the transition is the time scale,  which is inversely proportional to the square root of the barrier height λ, and the noise strength σ. We do not know how Heptanol and electric fields affect the barrier height. However, the noise that drives the transition emerges from the stochastic nature of the Ca2+ activity that induces the contractile actomyosin forces within the tissue. These fluctuations are weakened by Heptanol and strengthened by the electric field [12]. Assuming a weak dependence of λ on the controls implies that
  increases under Heptanol while decreases under an electric field. This prediction is consistent with our experimental findings, as demonstrated in figs. 1(d) and (e), and provides support for the first-order nature of the morphological transition.
The main prediction of our model is that the local Ca2+ activity is negatively correlated with the scalar curvature. From the coupling action (2), it follows that fluctuations which simultaneously lower the scalar curvature and enhance the Ca2+ activity at the same point reduce the action and are, therefore, more probable.
Our projected microscopy images do not allow a direct measurement of the local curvature of the 3D morphology of the tissue. However, the curvature-Ca2+ correlations can be deduced indirectly by measuring the dimensionless second moment of the Ca2+ field,  , defined by

Here the integral is over the tissue's surface,  is its center of mass,

is the spatial average of  , and A is the surface area. Approximating the tissue's shape by a prolate spheroid, M2 > 0 if the Ca2+ activity is statistically enhanced near regions of large curvature, i.e., near the spheroid's poles (fig. 3(a)), while M2 < 0 for enhancement near the ellipsoid's equator where the curvature is small (fig. 3(b)). Thus, by computing M2 one can deduce the sign of the curvature-Ca2+ correlations. An approximate formula for M2 which utilizes the information in the projected image is derived in the SM. For each frame along our microscopy imaging trace, we identify the optimal ellipsoid that fits the tissue's projected contour, extract its eccentricity e and compute the corresponding value of M2. The scatter plots of these data is presented in fig. 3, for all the tissue samples in our experiments under the various controls. In all cases, as the eccentricity increases (i.e., the spheroid becomes more prolate), M2 becomes more negative. Since a more prolate spheroid implies that most of the (positive) scalar curvature is located at the tips of the spheroid, the behavior in figs. 3(c)–(e) indicates that, indeed, the Ca2+ activity is negatively correlated with the curvature.

Fig. 3: The negative associations between the Ca2+ field and the tissue's scalar curvature. (a), (b): illustrations of the average Ca2+ activity pattern that leads to positive (a) and negative (b) values of the normalized second moment M2 of the Ca2+ field. A positive M2 characterizes an enhanced activity near the poles of a prolate spheroid, while a negative M2 is associated with an enhanced activity near its equator. (c) A scatter plot of M2 as a function of the square spheroid eccentricity e2. Each color represents a different tissue sample under normal condition (n = 7). The inset shows a magnified view near the origin (close to a spheroidal shape). (d), (e): the same for tissue samples subjected to Heptanol ((d); n = 6; 300 μl/l in HM) and an electric field ((e); n = 6; 30 V/4 mm in HM). The solid lines in the insets are a guide for the eye. The curves in all figures show the upper and lower bounds of M2 (see SM). The upper curves in the figures are the straight lines M2 = −e2/14, while the lower-curves are the inverted parabolas M2 = −0.004 − e4/1.6.
Download figure:
Standard imageThe consistency of the above theoretical description of Hydra morphogenesis as a phase transition, driven by the coupling between the Ca2+ field and the curvature, leads to two additional insights. The first follows from our hypothesis that the transition of the tissue's morphology into a cylindrical shape emerges from a modulation in the balance between the active actomyosin forces, driven by the Ca2+ activity, and the internal cavity fluid pressure. Under this assumption, weakening of the active contractile forces by Heptanol should lead to the collapse of the cylindrical-shaped tissue back into a spheroidal shape, reflecting the isotropic nature of the pressure force. Figure 4(a) shows that this is indeed the case (see also Movie 3 linked in the SM). This result implies that maintaining an elongated cylindrical shape requires a significant distribution of the active internal contractile forces.

Fig. 4: Reversing morphogenesis by Heptanol and re-inducing it by an electric field. (a) An example of a time trace of the shape parameter Λ of a regenerated mature Hydra subjected to Heptanol (700 μl/l in HM). The trace clearly shows the folding of the Hydra's body form from a cylindrical shape (high Λ) into a spheroidal one (low Λ). This result was reproducible in 3 separate experiments where a complete trace, similar to the one shown here, was extracted from each of them. It demonstrates that the application of Heptanol, blocking gap junctions and weakening the Ca2+ activity, may stabilize the minimum of V (q) at Λ = q = 0 which is associated with the spherical shape. (b) An example of a time trace of the shape parameter Λ of a spheroidal-shape Hydra's tissue, exhibiting halted regeneration for a long duration (around 60 hr prior to the shown trace) under Heptanol (300 μl/l in HM), following the application of an external electric field (at t = 0; red curve in (c)) in the presence of the Heptanol. At these parameters of the controls, each one of them separately halts regeneration and stabilizes a spheroidal-shaped tissue. The simultaneous application of both controls reinitiates the regeneration process and leads to a morphological transition into a cylindrical shape (manifested by a significant increase in Λ). (c) The time traces of the applied voltage (red) and the mean Ca2+ activity (blue) corresponding to the time trace of (b). These traces demonstrate the synchronization of the Ca2+ activity with the voltage, which is also observed in the evolution of the hydra shape parameter Λ(t). Similar results were observed in 2 separate experiments.
Download figure:
Standard imageFor the second insight, recall that Heptanol and an external electric field, applied separately, halt regeneration differently: The first weakens the Ca2+ activity while the latter strengthens it [12]. If the Ca2+ fluctuations are the primary agent driving the morphological transition, then applying both controls simultaneously for a tissue halted by Heptanol, such that the Ca2+ activity is resumed to be in a proper range, should reinitiate morphogenesis. The experimental data shown in figs. 4(b), (c) demonstrate the validity of this prediction (see also Movie 4 linked in the SM). Note that the Ca2+ activity (measured here by its spatial mean) is synchronized with the externally applied modulated voltage, demonstrating that at this range of parameters, the voltage indeed enhances the Ca2+ activity, which is otherwise suppressed under Heptanol.
In summary, concentrating on the morphological transition in whole-body Hydra regeneration, we develop a physical model for morphogenesis. The negative correlations between the Ca2+ spatial fluctuations and the local tissue curvature suggest a simple picture of this transition: Enhanced contractile forces at regions of low curvature lead to elongation of the spheroidal shape of the tissue by the internal cavity pressure force. The transition is further driven along the body axis until the tissue's shape is transformed from a spheroid into a cylinder [7,20]. This simple picture reminds the forms and shapes created in children's party balloons.
Under Heptanol, the Ca2+ activity is too weak to provide the necessary contractile forces, so morphogenesis is halted in the spheroidal state. However, the reason for samples subjected to an electric field to be halted as well is puzzling. Our model provides an explanation for this phenomenon. As shown by us before, the electric field increases the Ca2+ activity and its correlation length making its distribution more uniform over the tissue [12]. We have shown that the electric field also leads to enhanced temporal frequencies of the Ca2+ fluctuations above the mechanical relaxation time of the tissue [12]. Thus, the slow component of Ca2+ activity becomes more uniform over the tissue. A uniform Ca2+ distribution cannot provide the localized forces required for a morphological change. From a mathematical viewpoint, the electric field reduces the coupling strength between the Ca2+ field and the local curvature, since for a uniform ϕ the action (2) becomes a topological invariant. Another reason is that, as in any biological system, the coupling action as a function of ϕ features a saturation (see eq. (D.12) in the SM). Thus, increasing the average Ca2+ activity drives the system into a regime where the force gradients become smaller and cannot provide the localized contractile forces required for the morphological transition.
It remains for future work to understand the detailed mechanisms leading to the feedback between curvature and the Ca2+ activity as well as the details of how this activity is reflected in the distribution of the internal active actomyosin forces. Finally, the body axis alignment, dictated by the longitudinal supracellular actin fibers, and the axis polarity which determines the position of the head in the regenerating tissue segment, are both strongly inherited from the parent Hydra [7,20,50–54]. An important open issue are the effects of these symmetry-breaking fields on morphogenesis.
Acknowledgments
We thank Eldad Bettelheim, Benny Davidovitch, Omri Gat, Avraham Klein, Joshua Feinberg, Dror Orgad, Naama Brenner, Kinneret Keren, Yariv Kafri, Guy Bunin and Shimon Marom, for discussions and comments on the manuscript. EB thanks the lab members: Liora Garion and Yonit Maroudas-Sacks for their technical help. Special thanks to Gdalyahu Ben-Yoseph for superb technical help in designing and constructing the experimental setup, and to Anatoly Meller for constructing the electrical control system. This work was supported by a grant (EB) from the Israel Science Foundation (Grant No. 1638/21)).
Data availability statement: All data that support the findings of this study are included within the article (and any supplementary files).