

Abstract
Obstructive sleep apnea (OSA) is a common sleep disorder, which is particularly harmful to children as it may lead to learning deficits, attention deficit hyperactivity disorder (ADHD) and growth retardation. Furthermore, OSA alters the dynamics of sleep-stage transitions and in particular increases the transition time from being awake to falling asleep ("drowsiness"). In this letter, we show that sleep bout durations during this transient state can be described by an exponential distribution with a longer characteristic time scale for OSA compared to healthy children. This finding can be simulated and better understood by using a random walk model of the integrated neuronal voltage of wake-promoting neurons, and by introducing a new concept of a light sleep threshold parameter L that distinguishes between drowsiness and deeper forms of light sleep. Our analysis also shows that the value of L correlates well with OSA severity. Moreover, we find that after OSA treatment, the parameter L returns to normal values similar to those we detected for healthy children. We anticipate that our methodology can help in better understanding and modeling sleep dynamics, and may improve diagnostics and treatment monitoring of OSA.
Export citation and abstract BibTeX RIS
Introduction
Human sleep is characterized by rapid eye movement (REM) sleep as well as by light and deep sleep (non-REM). In addition, sleep is often interrupted by brief awakenings (arousals) that last from few seconds to minutes [1,2]. Most of the modeling approaches to sleep focus on the diurnal and circadian sleep/wake cycle [3–8], and models based on flip-flop switches were developed to account for the transitions between sleep and wake state as well as between REM and non-REM sleep [8–10]. There have been a few studies analyzing the probability distributions of arousal durations during sleep revealing a power-law behavior [1,11,12], which is consistently observed for several mammalian species [13] and seems to be related to different stages of maturation [14,15]. First attempts to simulate the sleep microarchitecture and the underlying power-law in arousal durations utilize stochastic and random walk based models [1,16], however, the complex dynamics of sleep-stage transitions and their alteration with sleep disorders such as obstructive sleep apnea (OSA) is not yet understood.
In this letter, we focus on non-REM sleep transitions and changes in their dynamics that possibly occur in children with OSA. Here, we propose a new parameter L that is related to the depth of light sleep, and we show its utility in characterizing the severity of OSA. In the current guidelines of the American Academy of Sleep Medicine (AASM), non-REM sleep is divided into three stages according to sleep depth: stages N1 and N2 (light sleep) as well as stage N3 (deep sleep) [17]. The sleep stage N1 represents sleep in its lightest form and is therefore considered a transitional state between wakefulness and sleep. N1 sleep is characterized by drowsiness [18] during which individuals usually respond to auditory or visual stimuli [19]. The N1 stage accounts for only a small portion of the total sleep time (TST), and therefore has often been ignored or grouped together with stage N2 into a single light sleep stage [20,21]. However, since N2 is more dominant (>50% of TST) than N1 (<10% of TST) [22], combining N1 with N2 might abolish any N1 effects that are related, for example, to cognitive performance. Indeed, very recent studies have shown a relationship between N1 (but not N2) percentage and cognitive impairment. Specifically, high percentage of N1 was found to be a good predictor of declining cognitive function in elderly subjects [23,24]. Additionally, it has been shown that N1 percentage increases for OSA patients (for both adults [25–27] and children [28,29]), whereas no difference has been found for N2 [25,30]. Furthermore, for children, OSA and sleep-disordered breathing in general, have been linked to hyperactivity [31] and poor school performance [32,33], and timely diagnosis and treatment of OSA can lead to immediate improvements [34,35]. In this work we focus on N1 sleep bout durations  , and based on a statistical physics model, we derive N1 sleep characteristics that can aid in better understanding sleep in OSA patients.
Recently, a model has been developed to simulate brief arousals from sleep [12,16]. The model is based on a physiological mechanism that takes into account the intrinsic noise ("sub-threshold voltage fluctuations") of wake-promoting neurons (WPN) in the brain stem. Although WPN are suppressed during sleep [10,36], the integrated uncorrelated neuronal noise from WPN can from time to time cross the excitability threshold and through projections to the cortex provoke an arousal. Because of the excitation along the ascending arousal pathway, sleep-promoting neurons (SPN) in the ventrolateral (VLPO) and median (MnPO) preoptic nuclei are stimulated [37,38], and can in turn actively inhibit the WPN (negative feedback) through an inhibitory current [12]. The integrated voltage V(t) of WPN can be modeled as a random walk with drift (during arousals/short awakenings) or without drift (during sleep) as shown in fig. 1. During sleep, the random walker transitions through the different non-REM sleep stages, and in order to quantify the probability of V(t) being in a state corresponding to N1, here we introduce a threshold L (fig. 1) that distinguishes between shallow and deeper light sleep, N1  and N2
  light sleep, respectively. In the following, we propose an analytical method to evaluate L from standard sleep recordings (hypnograms), and we determine L for healthy children and children with OSA. We find that OSA yields higher values of L that can be reduced through proper treatment.
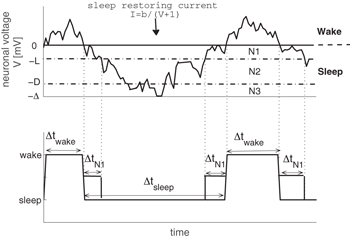
Fig. 1: Model of a random walk that simulates the integrated voltage of wake-promoting neurons (WPN). The upper panel illustrates the dynamics of the model: the neuronal voltage of WPN shows unbiased diffusion for negative values of V (corresponding to sleep), whereas for positive values of V arousals occur and diffusion is biased towards sleep due to a sleep restoring current [1,12]. In our model, sleep is further divided into three stages according to the neuronal voltage: light sleep stages N1 (for  ) and N2 (for
  ) as well as deep sleep N3 (for
  ) [16]. The lower panel shows the derived hypnogram from the simulated neuronal voltage dynamics. N1 sleep bout durations are marked as
  in the lower panel.
Download figure:
Standard imageData
We analyze hypnograms of two groups of children that are age- and BMI-matched: i) healthy children (n = 38; age:  years; BMI:
  ), and ii) OSA children (n = 58; age:
  years; BMI:
  ). In addition, we analyze the hypnograms of n = 9 children that received successful OSA treatment of either CPAP or surgery (age:
  , BMI:
  ). Hypnograms were scored in 30 s epochs [17] and contain the following stages: wakefulness, REM sleep, and non-REM sleep stages N1, N2 and N3.
Calculating the threshold L from N1 sleep bout durations
During sleep, the random walker transitions freely through the non-REM sleep stages N1, N2 and N3 (fig. 1), and changes in the integrated neuronal voltage V(t) of WPN can be calculated by the following differential equation:

where σ is the standard deviation of the neuronal voltage fluctuations, w is a standard Wiener process, and  is the relative voltage value between threshold potential and potassium Nernst potential [12]. To model the probability distribution of
  , we introduce a N1 light sleep threshold, L, so that, for voltages between 0 and
  , N1 sleep occurs (fig. 1). In the following, we show how to estimate L from standard hypnogram data.
During N1 light sleep, the voltage is bounded within  (fig. 1). Therefore, integrating eq. (1) in this range yields

or

Since the differentials  of a Wiener process are uncorrelated and have zero mean, averaging eq. (3) over all N1 sleep bouts yields


In the step from eq. (4) to eq. (5), we use a property of w (standard Wiener process) that the variance of  is the time interval
  of the process, and therefore
  (in eq. (6)) is the average duration of an N1 sleep bout. Thus, for the N1 light sleep threshold we obtain

As seen in fig. 2, we find that the probability distribution of  decays exponentially as

and the characteristic time constant  equals the inverse slope of the probability distribution of
  on a semi-log plot (fig. 2). The standard deviation of the neuronal voltage fluctuations σ can be thus calculated by using the characteristic time constant τ from all sleep bout durations:
  with
with  for children and
  for adults (for details on how to derive σ and Δ, see [16]).
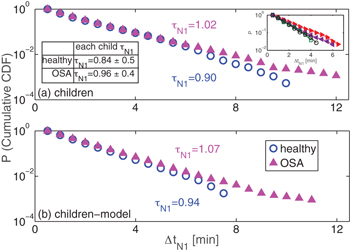
Fig. 2: Cumulative probability distributions of N1 sleep bout durations  decay exponentially. (a) OSA leads to a slight increase of the
  characteristic time constant
  (healthy children (blue open circles) vs. OSA children (magenta filled triangles)). Panel (b) shows the corresponding results of our model simulations (fig. 1) for both children groups. The distributions in both panels are obtained from the pooled data of each group, and the characteristic time constants
  are calculated using maximum-likelihood estimation (MLE) of exponential distributions (eq. (9)), which does not depend on specific bin selection for the probability distribution. The inset table in panel (a) shows the
  values (mean±standard deviation) for healthy and OSA children, obtained by averaging the individual
  values of each child of the corresponding group. As typical examples, in the inset figure of panel (a) we present the cumulative probability distribution of two healthy children (open symbols) and two children with OSA (full symbols), all of which show approximately exponential distributions (close to straight lines on a semi-log plot). The model results for each group (healthy and OSA) were obtained from 50 independent simulations with length of 10 hours each. The model parameters for each group were adjusted according to the empirical findings. For healthy children: L = 5, neuronal noise parameter
  , sleep inertia parameter b = 25, sleep depth parameter
  . For OSA children: L = 6,
  , b = 30,
  . The values for L are taken from the results presented in fig. 3; b and σ are determined by
  and
and  , respectively, with
  for both groups (for more details, see [16]). The exponent
  is obtained from the probability distribution of sleep bouts of each child [12]. Since the model assumes an exponential distribution of
  and the simulations were performed using the L as observed from the sleep data (see fig. 3), the close resemblance of empirical and model data supports our hypothesis of a light sleep threshold and of an approximately exponential distribution of
  . Note that we apply cumulative CDF in order to reduce the noise in the data.
Download figure:
Standard imageEstimating the characteristic time constant  from N1 sleep bout durations

The probability distribution of  decays exponentially with characteristic time constant
  (fig. 2 and eq. (8)) that can be calculated using the maximum likelihood estimation (MLE) [12,39]. An advantage of MLE analysis is its independence from a specific bin selection of the probability distribution.
The exponential probability distribution of N1 sleep bout durations can be approximated as ![$f(\Delta t_{N1})={1}/{\tau_{N1}} \cdot\exp [{-(\Delta t_{N1}-M)/\tau_{N1}}]$](https://content.cld.iop.org/journals/0295-5075/129/6/60002/revision3/epl20080ieqn47.gif) , where
, where  is the variable of the N1 sleep bout durations, and M is the shortest value of
  . The likelihood ℓ for the data (with N variables) is
and the maximum of ℓ is attained when  :
:
Therefore, the estimated value for  is (as expected for exponential distributions)

Here,  was calculated from the
  data in the interval [1 min, 10 min], therefore,
  in eq. (9).
Using the Cramér-Rao bound [40], the estimated error of  is
is
where  is the Fisher information of
  . Therefore, the lower bound of the standard deviation of
  is
is

Results
Figure 2 shows the cumulative probability distributions of  for the healthy children and for the OSA group on semi-log plots. The cumulative distribution function is defined as CDF
  , where
  is the probability density function for the occurrence of sleep stage N1 with duration
  . Both distributions decay approximately exponentially with Akaike weights [41] for an exponential distribution > 0.9 and for a power-law distribution < 0.1. We find that the characteristic time constant
  tends to be larger for OSA children, however, the difference is not statistically significant when comparing the values of each individual (see inset table in fig. 2(a)). Our model simulations result in probability distributions for
  similar to the empirically obtained distributions (see fig. 2(b)).
We next calculate the N1 light sleep threshold L from sleep bout distributions for each group according to eq. (7). Interestingly, although  values are not significantly different when comparing healthy to OSA children, the obtained values of L show significant differences as can be seen in fig. 3. We find that L is significantly larger for OSA children, particularly for severe cases of OSA (Obstructive Apnea Index (OAI)
 events/hour [34]). We relate the higher values of L for OSA to the significantly longer N1 durations seen in those children [28,29].
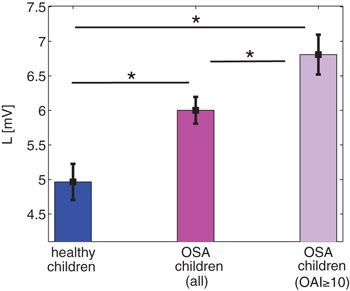
Fig. 3: The N1 light sleep threshold L for different groups of children. The L values are calculated for each individual utilizing eq. (7), and averaged for each group. OSA children have higher values of L as compared to healthy ones, which increase even further for children with severe OSA (Obstructive Apnea Index (OAI) events/hour [34], n = 12). The higher L values for OSA children may explain their longer N1 and shorter N2 light sleep (upper panel in fig. 1). Shown are mean and standard deviation for each group. Significant differences between the groups were probed by Mann-Whitney U tests and * indicates significant differences with p < 0.05. For the calculation of L we use maximum likelihood estimation (MLE) (eq. (9)) with M = 1 min for all children groups.
Download figure:
Standard imagePrevious studies have found that N1 sleep duration increases under OSA [25,30]. For children, this N1 increase correlates with OSA severity, i.e., children with higher OAI tend to have more N1 sleep (fig. 4(a)) [27,29]. The most important consequences of OSA, however, are oxygen desaturation episodes and hypoxemia that cause a multitude of neuropathological changes and neuropsychological impairments [42]. These episodes are detected by a fingertip pulse oximeter usually in combination with a polysomnogram (PSG), and the average number of desaturations per hour is quantified by the oxygen desaturation index (ODI). Since ODI is sensitive to apnea depth and length, it can be used as a prognostic marker for OSA complications and mortality [43]. In our data of OSA children, ODI shows good correlation with OAI (fig. 4(b)), similar to what was found recently for OSA adults [44]. Interestingly, as we show in fig. 4(c), the N1 light sleep threshold L, a physiological parameter proposed here, can be used to evaluate OSA severity. Plotting L as a function of the patients OAI shows a strong correlation of 0.71 (fig. 4(c)) for moderate OSA  to severe cases of OSA (
 ) [34]). This is an even higher correlation than what we find for N1 and ODI, indicating that L may be useful as a diagnostic marker of OSA. Moreover, calculating L only requires hypnograms and no additional device to measure oxygen desaturation (which is necessary to determine ODI).
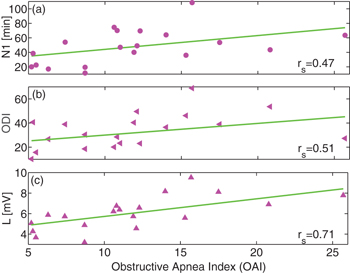
Fig. 4: Spearman's rank correlation between different sleep characteristics and Obstructive Apnea Index (OAI) for OSA children. (a) The N1 sleep duration increases with the severity of OSA as measured by OAI (Spearman  ). (b) A similar correlation with
  is found for oxygen desaturation events (a traditional diagnostic marker of sleep apnea severity measured by the oxygen desaturation index (ODI)). (c) Plot of the value of L as a function of OAI of each child reveals the strongest correlation to OAI among the three measures considered (Spearman
  ). Therefore, the parameter L might be an even better indicator of OSA severity than N1 or ODI. For the analysis, we included all children with
  (all moderate and severe cases of OSA [34])). Note that the correlations rs
in all panels (a)–(c) are of statistical significance with p < 0.05, i.e., all correlations rs
are significantly different from zero. ODI is calculated from the number of events per hour where oxygen desaturation of 3% or more was associated with a respiratory event.
(all moderate and severe cases of OSA [34])). Note that the correlations rs
in all panels (a)–(c) are of statistical significance with p < 0.05, i.e., all correlations rs
are significantly different from zero. ODI is calculated from the number of events per hour where oxygen desaturation of 3% or more was associated with a respiratory event.
Download figure:
Standard imageThe treatment of OSA in children includes a combination of medications (such as topical nasal steroids), a surgical removal of tonsils and adenoids ("adenotonsillectomy"), therapy with a CPAP mask during sleep and/or oral appliances (such as dental devices or mouthpieces to keep the upper airway open) [45]. In our study, treatment strategies were chosen based on the children's clinical situation and each child's family decision, and mostly included CPAP and adenotonsillectomy.
In fig. 5 we show the effect of treatment on the N1 light sleep threshold L. Compared to children with untreated OSA, those who underwent treatment by CPAP or surgery have significantly lower values of L. In fact, their L values become similar to healthy children (fig. 5(a)). Moreover, we can reinforce this observation of the decrease of L with treatment on individual basis. For n = 3 children we have obtained longitudinal data before and after treatment (with either CPAP or surgery) and we calculated the corresponding L values. It is clearly seen that treatment of these children lowered L significantly by 30–40% (fig. 5(c)) and ODI by more than 50% (fig. 5(d)). However, these preliminary results need to be confirmed by follow-up studies on a larger study cohort.

Fig. 5: The effect of treatment on N1 light sleep threshold L and oxygen desaturation index (ODI) for OSA children. (a), (b): while untreated OSA children show the highest L and ODI values, treatment with CPAP or surgery significantly lowers L and ODI values, which become close to those obtained for healthy children. (c) For n = 3 OSA children we have data before and after treatment, which clearly show a significant decrease in L after treatment  . This decrease is even more pronounced than the corresponding decrease in ODI for the same children (panel (d)), since it allows for a group separation (before/after treatment) on the basis of L but not ODI (the p-value for ODI is
  ). Mann-Whitney U tests are applied to probe statistical significant differences between the group
  indicates significant differences for p < 0.05).
Download figure:
Standard imageConclusion
Traditionally, obstructive sleep apnea is diagnosed using polysomnography in combination with respiratory and/or cardiovascular data (heart rate [46] and blood pressure [47]), and conventional hypnograms alone are often considered ineffective in determining OSA severity [46]. In this letter, we introduce a method to estimate the OSA severity through a physiological parameter L that is derived solely from standard hypnograms (fig. 4). More specifically, we have analyzed sleep data from healthy children and children with OSA, and we show that N1 sleep bout durations  can be described by an exponential distribution with higher characteristic time constant for OSA children. We suggest a random-walk model to simulate the exponential distribution of
  by introducing a light sleep threshold L that distinguishes between more shallow and deeper light sleep. Using this model framework and the characteristics of a Wiener process, we can calculate L from the sleep data and find significantly higher L values for OSA compared to healthy children, which might explain the longer time OSA patients spend in light sleep N1. Moreover, we demonstrate that L correlates well with OSA severity, showing highest correlation values for children with the most severe Obstructive Apnea Index (OAI).
OSA is characterized by repeated episodes of upper airway obstruction during sleep, which can result in intermittent brain hypoxia and sleep disruptions. Epochs of intermittent hypoxia can cause cellular injury in various parts of the central nervous system [48]. Because remote brain regions (at the edge of major vascular supply) are more susceptible to hypoxia, the cerebral cortex is particularly vulnerable [49]. Therefore, in OSA patients the hypoxic damage may lead to cortical dysfunctions causing some degree of cognitive impairments in attention, learning, and motor performance, which may lead to a growth deficit and abnormal behavior in children [50]. Since most of these impairments are partially reversible with OSA treatment [51], early diagnosis is crucial, especially for young children. Our results suggest that the parameter L, which we propose and develop in this letter, could be used as a new diagnostic marker for OSA since it captures the sleep microarchitecture, and therefore complements ODI which measures breathing disturbances. The estimation of L can easily be incorporated into clinical studies since it is derived from standard hypnograms and does not require additional equipment.
Further studies are needed to evaluate the diagnostic significance of L on a larger cohort of OSA patients that also include different age groups of the adult population as well as different types of OSA treatment. Another important problem is to study the applicability of L for other sleep disorders, for example, central sleep apnea (CSA) [52] that, in contrast to OSA, is caused by absent respiratory drive from the brain stem [19]. Although more research is needed to find the exact physiological explanation of L, this parameter could already be used in sleep apnea diagnostics.
Acknowledgments
This research was supported by the Bar-Ilan University and the Planning and Budgeting Committee fellowship program of the council for higher education of Israel; Shulamit Aloni Fellowship for Advancing Women in Exact Sciences and Engineering, Ministry of Science and Technology, Israel (Grant No. 3-13276); the Colman-Soref Grant foundation Fellowship of the Council for Higher Education, Israel (Grant No. kra/colman/194); the Israel Science Foundation (Grant No. 1657/16); the German Israeli Foundation (Grant No. I-1372-303.7/2016).