

Abstract
We study the properties of polycrystalline bulk yttrium iron garnet (YIG) pellets prepared by the solid-state method, where the choice of the sintering temperature can lead to mixed phases of yttrium iron perovskite (YIP) and YIG or single phase YIG. Magnetometry shows multiple switching regimes in the mixed-phase pellets where the saturation magnetization is dominated by the proportion of YIG present. Ferromagnetic resonance was used to corroborate the saturation magnetization from magnetometry and to extract the spin wave damping α. The lowest damping was observed for the YIG pellet, which resulted in a spin Seebeck effect (SSE) coefficient that was approximately 55% of single crystal YIG. This demonstrates that macroscale crystallization does not play a major role in the SSE and paves the way for utilising polycrystalline samples for thermomagnetic applications.
Export citation and abstract BibTeX RIS

Published by the EPLA under the terms of the Creative Commons Attribution 3.0 License (CC-BY). Further distribution of this work must maintain attribution to the author(s) and the published article's title, journal citation, and DOI.
Introduction
The spin Seebeck effect (SSE) is defined by a spin-polarized current arising in a magnetic material when a thermal gradient is applied. It was first observed by Uchida et al. [1] leading to the development of the new branch of physics: spin caloritronics, which encompasses other magnetothermal effects such as the spin Peltier and spin Nernst effects [2,3]. The array of diverse magnetothermal effects shows promise for improving thermoelectric devices (by decoupling thermal conductivity and electric conductivity) [4] as well as a host of new spintronic devices such as directional couplers and magnon logic gates [5].
Yttrium iron garnet (YIG) has generated a lot of interest for the study of magnetization dynamics and the related effects [6], in particular due to its low spin wave damping and insulating nature. The SSE has been studied in bulk single-crystal [7,8], polycrystalline [9–11] and thin-film [10,12–14] Pt/YIG systems. However, magnetic properties of YIG are dependent on the purity of the samples. When we use solid-state methods to grow YIG, secondary phases of haematite (Fe2O3) and yttrium iron perovskite (YFeO3), known as YIP [15] can arise, which would compromise the magnetic performance of this material in spintronic or energy harvesting applications. The aim of this work is to explore the impact of these secondary phases on the magnetic moment, magnetization dynamics, and generation of spin current by the spin Seebeck effect.
Here we study the magnetization and SSE coefficient in polycrystalline bulk YIG pellets that were produced by the solid-state method. We analyse the composition and morphology of the pellets using X-ray diffraction (XRD) and scanning electron microscopy (SEM). We use vibrating sample magnetometry (VSM) and ferromagnetic resonance (FMR) spectra measurements to measure the saturation magnetization and Gilbert spin wave damping. Finally SSE measurements show that the SSE coefficient obtained for the optimised pellet is almost 55% of the single-crystal YIG value [10]. We thus highlight the prospect of using polycrystalline samples for thermomagnetic applications as sample preparation using solid-state processes are often more economically attractive compared to comparable thin-film processes.
Experimental
Bulk YIG pellets were prepared by the solid-state method [14]. Stoichiometric amounts of Y2O3 and Fe2O3 starting powders (Sigma Aldrich 99.999% and 99.995% trace metals basis, respectively) were ground and mixed together before calcining in air at 1050 °C for 12 hours. Approximately 0.5 g of the calcined powder was then dry pressed into a 13 mm diameter,  thick cylindrical pellet. The pellets were then sintered at 1200, 1300 or 1400 °C for a minimum of 12 hours. We will refer to each of these pellets as P1, P2 and P3, respectively, as is shown in table 1. For SSE measurements, 5 nm of Pt was deposited onto the as prepared surface using a benchtop Quorum turbo-pumped sputter coater. The average grain size for these pellets was determined by averaging over line scans in micrographs obtained using SEM, and the open porosity measured by the Archimedes method. XRD patterns of the pellets were obtained using a Bruker D2 Phaser with incident wavelength (Cu Kα)
  . The measurements were taken in
  geometry with the diffracted beam optics comprising of a 0.5mm Ni monochromator and a 2.5 inch Soller slit followed by a LYNXEYE™ detector. Magnetic characterization was obtained using a Cryogenic™ VSM as a function of field. FMR spectra were obtained at the Materials Characterization Laboratory at ISIS, Didcot, United Kingdom, using a broadband waveguide connected to a vector network analyser.
Table 1:.
Phase and morphology summary of the pellets. Here  was the sintering temperature, YIG (%) is the YIG fraction determined from XRD by comparing the relative intensity of the (420) and (112) YIG and YIP reflections, respectively. The porosity and grain size were determined from the Archimedes method and SEM, respectively. As P1 did not show clear grain formation, a grain size could not be extracted.
| Sample | TSint (°C) | YIG (%) | Porosity (%) | Grain size (μm) |
|---|---|---|---|---|
| P1 | 1200 | 23 | 22 | – |
| P2 | 1300 | 70 | 23 |  |
| P3 | 1400 | 100 | 27 |  |
SSE measurements were obtained from a set-up similar to that of Sola et al. [16]. The sample was sandwiched between 2 Peltier cells, where the top Peltier cell acted as a heat source, and the bottom Peltier cell monitored the heat Q, passing through the sample. The Peltier cells were calibrated by monitoring the voltage VP, generated as a known power was passed through a surface mount resistor when it was a) fixed to the top side of the Peltier cell and b) sandwiched between the two Peltier cells (where the sensitivity  of the bottom Peltier cell was
  at 300 K) [16]. Two type-E thermocouples were mounted on the surface of the Peltier cells in differential mode such that they were in contact with the sample during the measurement, monitoring the temperature difference,
  .
.
Results
Figure 1 shows a subset of the X-ray diffraction data that was obtained for these pellets. The bottom lines represent the expected YIG (ICSD: 96-100-8629) and perovskite phase, YIP (ICSD: 96-210-1387) diffraction peaks where stark differences between the three pellets are immediately clear. The presence of an intense peak at 33.13° corresponding to the (112) reflection of YIP and smaller peaks at 31.99° and 33.94° attributed to the (200) and (020) YIP reflections in P1 indicates a large percentage of YIP. This is accompanied by evidence of a small fraction of YIG with the presence of the (420) reflection at 32.35°. P2 shows a relatively mixed phase with the appearance of both YIP and YIG reflections, whereas P3 shows only the YIG reflections.

Fig. 1: XRD spectra of the pellets about the  YIG/YIP peaks, where relative intensities were used to determine the YIG %. The full dataset for these pellets will be made available via doi 10.17028/rd.lboro.5117557.
Download figure:
Standard imageSEM micrographs of some of the pellets are shown in fig. 2. The 22–27% porosity determined by Archimedes measurements and summarized in table 1 is apparent in the SEM images. We shall see later that despite the porosity, the samples show robust spin current generation via the spin Seebeck effect. We can also see that the grains formed in the P3 pellet are significantly larger due to the higher sintering temperature. The grains observed in SEM were used to extract the approximate grain size of the P2 and P3 pellets by taking an average over a line scan.

Fig. 2: Scanning electron micrographs of the (a) P1, (b) P2 and (c) P3 pellets. The scale bar is indicative for all images, which had a magnification of × 1500.
Download figure:
Standard imageThe magnetic hysteresis loops for the pellets are shown in fig. 3. The coercive field was of the order of 7 Oe, which is consistent with expectations for soft ferrimagnets such as YIG. Where there were mixed YIP/YIG phases, different switching field regimes were observed, as seen in the inset of fig. 3. This behaviour was most prominent in P1 (accounting for the final 12%  difference between 2 and 4 T) where the YIP fraction was 77%, and it was still seen in P2 where the YIP fraction was 30%. This behaviour is indicative of metastability, such as an antiferromagnetic-ferromagnetic or spin-flop transition. It is unlikely to be due to the YIP phase due to the magnitude of change in M (YIP is an antiferromagnet [17] with a saturation magnetization of
  [18]). We argue that the plateaus observed for P1 and P2 in the inset of fig. 3 are indicative of the non-collinear magnetization configuration between the bulk and surface of grains within the pellet [19]. This behaviour maybe suppressed in P3 due to the formation of larger grains, as shown in table 1.
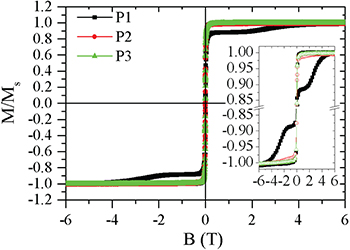
Fig. 3: Field dependence of the magnetization for the different pellets. The insets show the zoomed-in positive and negative saturation regions for all the pellets. P1 clearly exhibits multiple steps in these high field regions arising from the mixed YIP/YIG phase present in this sample. P2 also shows this behaviour but not to the same extent as P1.
Download figure:
Standard imageWe summarize the saturation magnetization obtained from VSM measurements at 6 T in table 2. For P3  , which is close to the bulk value for single-crystal YIG of
  [20]. For P1 and P2, the measured
  at 6 T, corresponds to 25% and 74% of P3, respectively. This is close to the YIG fraction obtained from XRD and is expected from the formation of distinct compositional and magnetic phases of YIG and YIP in P1 and P2. The relative magnetization is likely slightly higher in comparison to P3 as YIP has antiferromagnetic ordering with a weak ferromagnetic moment [17].
Table 2:.
Magnetization and damping parameters extracted by fitting the FMR data.  was obtained at a maximum magnetic field of
  for FMR measurements and
  for VSM measurements.
| Sample | g | FMR Ms (emu/g) | VSM Ms (emu/g) |  |
|---|---|---|---|---|
| P1 | 1.82 | 6.16 | 6.50 |  |
| P2 | 2.12 | 18.01 | 17.98 |  |
| P3 | 2.21 | 24.63 | 24.23 |  |
Broadband FMR measurements were performed on this series to observe the spin wave (SW) propagation. The resonance spectral intensity, as a function of frequency and magnetic field are shown in fig. 4(a)–(c) for the pellets. More details on these types of plots can be obtained in [21]. Figure 4(d) shows a spectral line scan at  . The linewidth and resonance frequencies were determined by fitting the spectra to a sum of a symmetric and anti-symmetric Lorentzian (with a 5th-order polynomial background to account for waveguide losses) and then determining the full width at half-maximum. As can be seen from fig. 4(d), the SW propagation in P1 was quite weak and heavily damped, as indicated by the lowest absorption and highest linewidth at resonance. As the YIG fraction was increased from P1 to P3, the resonance absorption increased and became sharper indicating more efficient propagation of SWs.
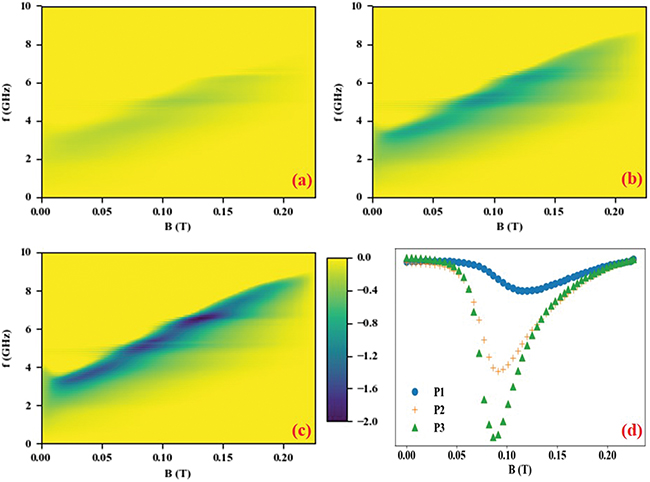
Fig. 4: FMR spectra for (a) P1, (b) P2 and (c) P3. The color bar denotes the intensity relative to the last field step. (d) Linescan of the absorption spectra at  , where P1 shows the lowest absorption and the highest linewidth at resonance due to the high YIP phase and P3 shows the highest absorption and lowest linewidth due to the high YIG phase. More details on these types of plots can be found in [21].
Download figure:
Standard imageWe extracted  and the Gilbert damping
  by fitting the resonance frequencies to the FMR formula of an ellipsoid of rotation [22],

where γ is the electron gyromagnetic ratio, B is the applied magnetic-field intensity, f is the frequency of spin wave resonance and  is the difference in in-plane and out-of-plane demagnetization factor components. γ can provide the Landé g-factor g which is approximately equal to 2. The resonance linewidths from fig. 4, were fit to

where  is the measured resonance linewidth and
  is the linewidth contribution due to inhomogeneous broadening. The values obtained from the FMR measurements for g,
  and α are summarized in table 2. We also show
  obtained from VSM for comparison, which were used to decide the range for
  while fitting to (1). As expected, the Gilbert damping was largest for P1, with the highest YIP fraction. P3 showed the lowest value of α (0.0122), which is large compared to the expected value for single-crystal YIG (
 ) [23] but of the same order of magnitude of previously measured polycrystalline thin films (
 ) [24]. We argue that this is due to the polycrystalline and somewhat porous nature of the pellets.
Spin Seebeck measurements
The SSE measurements of the pellets are shown in fig. 5, where we show in (a) the raw voltage,  , as the magnetic field, B, is varied for different temperature gradients. We measure the SSE in the longitudinal configuration, where the temperature gradient is perpendicular to the magnetic field, B. The spin accumulation at the ferromagnet/non-magnet interface due to the SSE results in injection of a spin current into the non-magnetic layer (in this case 5 nm Pt), which is converted to a measurable voltage by the inverse spin Hall effect. In these measurements the contact resistance was
  and contact separation
  .
.
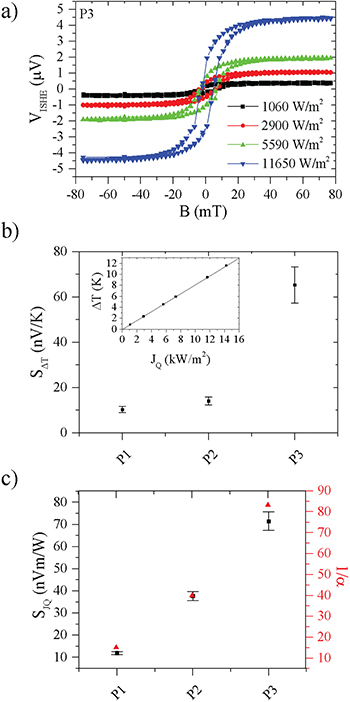
Fig. 5: Summary of SSE measurements. (a) Raw SSE voltage,  , as a function of the applied magnetic field for different heat fluxes JQ = κ∇T. (b) Variation of the
  SSE coefficient
  . The inset shows the measured temperature difference
  as a function of the applied heat flux, JQ, where linearity indicates negligible radiative losses. (c) Variation of the
  SSE coefficient
  and
and  for the pellets. The deviations in
  compared to
  may be due to thermal resistances at the interfaces or differences in the thermal conductivity of the YIG and YIP phases (7.4 and 11.27 W/m/K, respectively) [19]. The similarity in the trends in
  and
and  is due to the SSE being magnon driven in these systems.
Download figure:
Standard imageIn order to compare the relative magnitude of the spin Seebeck effect to other measurements of YIG we normalise the data in one of two ways: a) using the temperature difference method, or b) using the heat flux method [16]. This is possible as we monitor both the temperature difference,  , and heat flux,
  , as shown in the inset of fig. 5(b). The linear relationship between these two quantities indicates that radiative losses are negligible in these measurements.
To normalise  to
to  we use the following:

where Ly is the contact separation and Lz is the sample thickness [25]. For thin-film samples it has been shown that the  method is unreliable due to thermal shunting of the substrate and thermal resistances that exist between the sample and hot/cold reservoirs [15]. The alternative proposed by Sola et al. was to normalise to the heat flux, as measured by a Peltier cell:

where  can be obtained by multiplying
  by the thermal conductivity κ [16]. We show the spin Seebeck coefficient determined in each way in fig. 5(b) and (c). In general there is an increase as the YIG % is increased (P1 → P3), which mirrors the low-field VSM data. The difference in trends for
  and
and  could possibly be due to the uncertainty in determining
  (and is indicative of the pitfalls of using
  as a measurement method for the SSE), or a consequence of a change in the thermal conductivity of the pellets (YIG and YIP phases have
  and
and  , respectively) [18]. We also show the variation of
  for the pellets in fig. 5(c) and the similarity in its trend with
  is evidence of the SSE being magnon driven in these systems.
For comparison, the value of  for P3 was
  , which is approximately 55% of the bulk single-crystal YIG value of
  calculated from
  measured in [8] and the thermal conductivity for single-crystal YIG of
  [19] with 5 nm Pt. If we compared to direct heat flux measurements by Sola et al. [16], with thin-film YIG on single-crystal yttrium aluminium garnet substrates, the value of
  for P3 was approximately 65% the value of
  that they measured. This is promising considering that our pellets were polycrystalline and had some porosity, indicating that large crystal grains are not essential for the generation of large thermoelectric voltages from the SSE. This is also corroborated by the SSE observed in YIG thin films [10].
Conclusion
We have prepared polycrystalline YIG pellets using the solid-state method. The effects of different sintering temperatures on the structural and magnetic properties of these pellets have been studied. We found that at a higher sintering temperature of 1400 °C, the pellets are almost 100% YIG while at the lowest sintering temperature of 1200 °C there was a prominent YIP phase. The mixture of YIP and YIG phases in the P1 and P2 pellets shows different switching characteristics in the hysteresis loop compared to the P3 pellet. FMR characterization shows the highest spin wave amplitude and lowest damping in the P3 pellet which is consistent with the behaviour of YIG, although α is two orders of magnitude larger than the single-crystal value. Finally, the measurement of the SSE shows a large value of  in the P3 pellet which is almost 55% of the bulk single crystal YIG. This is encouraging as the pellet prepared from the solid-state method is polycrystalline and yet gives a large thermomagnetic response. We hope this study paves the way for future investigations into the behaviour of specimens prepared by solid-state processes which are more economical than comparable thin-film processes.
Acknowledgments
This work was supported by the EPSRC Fellowship (EP/P006221/1). The authors acknowledge the use of the facilities and the assistance of Keith Yendall in the Loughborough Materials Characterisation Centre, and D. Backes and Glyn Spencer for useful discussions. Supporting data will be made available via the Loughborough data repository under doi 10.17028/rd.lboro.5117557.