


Abstract
At the LHC energy of  , under various beam and background conditions, luminosities, and Roman Pot positions, TOTEM has measured the differential cross-section for proton-proton elastic scattering as a function of the four-momentum transfer squared t. The results of the different analyses are in excellent agreement demonstrating no sizeable dependence on the beam conditions. Due to the very close approach of the Roman Pot detectors to the beam center (≈5σbeam) in a dedicated run with β* = 90 m, |t|-values down to 5·10−3 GeV2 were reached. The exponential slope of the differential elastic cross-section in this newly explored |t|-region remained unchanged and thus an exponential fit with only one constant B = (19.9 ± 0.3) GeV−2 over the large |t|-range from 0.005 to 0.2 GeV2 describes the differential distribution well. The high precision of the measurement and the large fit range lead to an error on the slope parameter B which is remarkably small compared to previous experiments. It allows a precise extrapolation over the non-visible cross-section (only 9%) to t = 0. With the luminosity from CMS, the elastic cross-section was determined to be (25.4 ± 1.1) mb, and using in addition the optical theorem, the total pp cross-section was derived to be (98.6 ± 2.2) mb. For model comparisons the t-distributions are tabulated including the large |t|-range of the previous measurement (TOTEM Collaboration (Antchev G. et al), EPL, 95 (2011) 41001).
Export citation and abstract BibTeX RIS
Introduction
The study of elastic proton-proton scattering reveals many aspects about the structure of the proton, its shape and opacity, i.e., matter density. It also tests the interplay of non-perturbative and perturbative regimes of pp interactions depending on the four-momentum transfer squared t involved in the scattering process.
In several runs with different beam optics, TOTEM has measured at the center-of-mass energy of 7 TeV the differential elastic cross-section dσ/dt over a wide range of t. The first measurement, reported by the TOTEM Collaboration [1], covered the |t|-range from 0.36 to 2.5 GeV2. These data were taken with the standard 2010 LHC beam optics (with the betatron value at the intersection point β* of 3.5 m). The differential cross-section dσ/dt exhibited an exponential decay at low |t| followed by a significant diffractive minimum and at larger |t|-values a behavior compatible with the power law already observed at lower energies (see refs. [1] to [11] in [1]).
To access smaller |t|-values (at  , |t| = 0.01 GeV2 corresponds to a scattering angle of ≈29 μrad) the colliding beams must have a beam divergence of a few micro-radians. This can be obtained by either increasing the betatron value β* or by reducing the beam emittance
  (beam divergence
  ). With a dedicated beam optics configuration (β* = 90 m), TOTEM extended the measurement to |t|-values as low as 2·10−2 GeV2 [2]. This made the extrapolation of the differential cross-section to the optical point at t = 0 possible and enabled, for the first time at the LHC, the determination of the elastic scattering cross-section as well as the total cross-section via the optical theorem.
This article presents an improved t-distribution measurement with higher statistics and a reach to even smaller |t|-values using different data sets taken in October 2011, with several special runs at β* = 90 m. This time, the detectors, housed in Roman Pots (RP), were put very close to the beam center: 4.8 to 6.5 times the transverse beam size σbeam. This was possible since the beams were scraped by the LHC collimators at a distance of 4 σbeam for RP alignment purposes. For the definition of their position, each Roman Pot was brought to touch this sharp beam edge. After retraction by 0.5 to 2 σbeam, TOTEM took data in very clean conditions with only a few colliding bunch pairs and reached |t|-values down to 5·10−3 GeV2, enabling the observation of 91% of the elastic cross-section – compared to only 67% previously [2]. By extrapolating the differential elastic cross-section to the optical point t = 0 and using the optical theorem, the total and inelastic cross-sections were also derived. The differential cross-section over the complete t-range combining all available measurements with its statistical and systematic uncertainties is tabulated in this article.
In the same journal issue, a direct inelastic cross-section measurement, based on triggers from the forward inelastic detectors, is reported [3]. This is compared to the inelastic cross-section obtained from elastic scattering via the optical theorem, yielding a cross-section estimate for single diffraction at masses below 3.4 GeV that escape our detection. Another article [4] summarizes the cross-sections obtained with different approaches, including the luminosity-independent method. Since the ρ parameter (the ratio of the real to imaginary part of the hadronic scattering amplitude at t = 0) does not enter in the method from ref. [3], ρ can be determined by comparing the results from the different methods. Furthermore, the luminosity of the LHC was extracted, confirming the more detector-dependent estimates by CMS.
The proton detectors
The configuration of the TOTEM Roman Pot system and the silicon detector properties have already been described in detail [1, 2, 5]. For the understanding of the analysis, a few basic system properties are repeated.
The silicon sensors are placed in movable beam-pipe insertions – Roman Pots – located symmetrically on both sides of the LHC interaction point (IP) 5 at distances of 215–220 m from the IP.
Each RP station is composed of two units (near and far) separated by a distance of about 5 m. A unit consists of 3 RPs, two approaching the outgoing beam vertically from the top and the bottom and one horizontally. Each RP is equipped with a stack of 10 silicon strip detectors measuring the proton distance to the beam center in both coordinates perpendicular to the beam with a precision of about 11 μm. The movement and the alignment of all pots are monitored with a precision better than 20 μm based on track reconstruction and external alignment tools.
The large lever arm between the near and the far units allows the determination of the track angle in both projections with a precision of about 5 μrad. The knowledge of both the track positions and angles is vital in the analysis.
LHC optics
The measurement presented in this article was performed with the β* = 90 m optics, which has been described in detail [2]; here we repeat only the most important properties. A proton elastically scattered at the vertex (x*,y*,z* = 0) with the horizontal and vertical scattering angles (θ*x,θ*y) is transported through the LHC magnet lattice and traverses the Roman Pots at points (x,y):
Since Lx ≈ 0 in the far RP, the corresponding horizontal hit position xF can be used for the vertex x* determination:
The optimal scattering-angle reconstruction formulae differ for the two projections: the vertical angle θ*y is reconstructed from the hit position y (since vy ≈ 0) while the horizontal angle θ*x from the track angle θx at the RP:

where s denotes the distance from the interaction point.
Data taking
The presented data were recorded in October 2011. For this analysis, only one colliding bunch-pair was used with an average proton population of 6·1010 protons/bunch producing an instantaneous luminosity of 6 mb−1 s−1 and an average inelastic-interaction rate of 0.03 per bunch crossing.
During the run three data sets were recorded with different RP distances to the beam center corresponding to minimum values of the four-momentum transfer squared between (4.6 and 7.3)·10−3 GeV2. The different data sets enabled to reduce certain systematic uncertainties (alignment, inefficiency corrections, etc.). A run summary is given in table 1.
Table 1:. Description of the three data sets available. The RP position gives the RP approach to the beam in multiples of the beam size (σbeam). The third column summarizes the numbers of elastic events reconstructed from both diagonals.  is the integrated luminosity for each data set, accounting for the data acquisition (DAQ) inefficiency. The last column shows the lowest |t|-values reached.
| Data set | RP position | Elastic events |  (μb−1) (μb−1) |
|t|min (GeV2) |
|---|---|---|---|---|
| 1 | 6.5 σbeam | 841k | 68.0 | 7.3·10−3 |
| 2 | 5.5 σbeam | 106k | 8.2 | 5.7·10−3 |
| 3 | 4.8 σbeam | 89k | 6.6 | 4.6·10−3 |
The first-level trigger benefits from the 20 possible hits (10 planes in both near and far RP) per proton track and is based on a track segment in the near or the far unit. This redundancy guarantees a high trigger efficiency (over 99% per proton). A coincidence between a proton on the left and the right side of the IP is requested in the elastic double-arm signature in the vertical RP detectors with two diagonals (left top – right bottom or left bottom – right top). The characteristics of the β* = 90 m optics force most of the elastically scattered protons into the vertical RPs, see fig. 1.
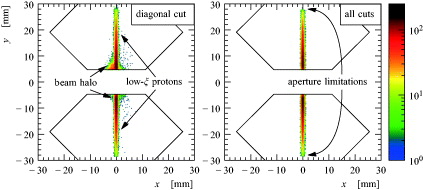
Fig. 1: Hit distributions from data set 3 in the far unit of the 220 m station, right arm. Left: with diagonal cut only, Right: with all the elastic selection cuts (see table 2). The left plot clearly shows the presence of a beam halo, which is eliminated by the selection cuts (right plot). The distribution of elastic hits in the right plot is sharply cut at about |y| = 29 mm as a consequence of the LHC aperture limitations.
Download figure:
Standard imageAnalysis
The analysis is very similar to the previous one [2]. Here, advantage was taken of having three data sets (each with two diagonals) analyzed separately, thus leading to a better control over the systematics.
Alignment
Three complementary methods were applied [6]. First, the RP position was approximately given by the beam-based alignment [7]. Second, proton tracks passing through the overlap between the vertical and horizontal RPs were used to determine the relative alignment of the RPs of each unit. Third, since the elastic event tagging does not require a precise alignment, an alignment fine-tuning was performed on a sample obtained from a pre-selection of elastic events (see next paragraph). By exploiting the azimuthal symmetry of elastic scattering, the horizontal and vertical shifts and the tilt of each unit could be adjusted. The effect of residual misalignments on dσel/dt was thus smaller than 0.3% for every t-bin.
Elastic tagging
The cuts used to select the elastic events are summarized in table 2. Cuts 1 and 2 require the reconstructed-track collinearity between the left and right arm. Cuts 3 to 6 effectively work as low-ξ cuts (ξ being the fractional momentum loss of a proton). Cuts 3 and 4: if ξ ≠ 0, the vertex reconstruction in eq. (2) becomes invalid. Cuts 5 and 6: if ξ ≠ 0, the correlation between the track position (yN) and the track angle (proportional to yF − yN) is lost. Cut 7 compares the horizontal vertex position reconstructed from the left and right arms. It is the strongest single cut and is very effective against the beam-halo background, see fig. 1.
Table 2:. The elastic selection cuts. The superscripts R and L refer to the right and left arm, the N and F corresponds to the near and far units. The constant α = LFy/LNy − 1 ≈ 0.11. The right-most column gives the RMS of the cut distribution (≡1σ), all the cuts are applied at 3σ-level.
| Number | Cut | RMS |
|---|---|---|
| Diagonal | Track reconstructed in all 4 diagonal RPs | |
| 1 | θ*Rx−θ*Lx | 9.2 μrad |
| 2 | θ*Ry−θ*Ly | 3.5 μrad |
| 3 | |x*R| | 200 μm |
| 4 | |x*L| | 200 μm |
| 5 | α yR,N−(yR,F −yR,N) | 17 μm |
| 6 | α yL,N−(yL,F −yL,N) | 17 μm |
| 7 | x*R−x*L | 9 μm |
Kinematics reconstruction
The scattering angles were reconstructed for each arm according to eq. (3). The corresponding uncertainties were 1.3% and 0.8% for θ*x and θ*y, respectively. The former has a more pronounced effect on dσel/dt and is the leading systematic uncertainty for larger |t| values, cf. table 3.
Table 3:. Overview of the systematic uncertainties of the differential cross-section dσel/dt.
| |t| (GeV)2 | t-dependent | Normalization | Luminosity | Total |
|---|---|---|---|---|
| 0.005 | 1.8% | . | . | 4.5% |
| 0.01 | 1.0% | . | . | 4.3% |
| 0.06 | 0.3% | . | . | 4.2% |
| 0.1 | 0.9% | . | . | 4.3% |
| 0.12 | 1.2% | 1.2% | 4.0% | 4.3% |
| 0.16 | 3.0% | . | . | 5.1% |
| 0.2 | 4.4% | . | . | 6.1% |
| 0.3 | 8.3% | . | . | 9.3% |
| 0.4 | 12.3% | . | . | 12.9% |
For elastic events, the angles reconstructed from left and right arms were averaged, which leads to an uncertainty reduction.
Background
The background contribution (i.e., all non-elastic events passing the selection cuts) was estimated by omitting the strongest single cut (number 7 in table 2) and by analyzing the distribution of x*R − x*L. This distribution can be reasonably described by two Gaussians – one for the signal and one for the background. By interpolating the background tails (|Δx*| > 3σ) into the signal region (|Δx*| < 3σ), the background/signal ratio was determined as (0.8 ± 0.4)%.
Acceptance correction
Two acceptance limitations were identified: the detector edge (relevant for low |t|) and the LHC aperture limitation shown in fig. 1, right (relevant for high |t|). Both effects were treated by assuming azimuthal symmetry of the elastic scattering and by correcting for smearing around the limitation edges. In order to keep the uncertainty at a reasonable level, the analysis was constrained into the region where the full acceptance correction was not larger than a factor 7.5.
Unfolding of resolution effects
The angular resolution was determined by comparing the scattering angles reconstructed from the left and right arm. Combining all the three data sets and all the diagonals yields one-arm resolutions of (6.36 ± 0.21) μrad in θ*x and (2.47 ± 0.07) μrad in θ*y. The latter is predominantly due to the beam divergence, whereas the θ*x resolution is deteriorated by a contribution from the finite detector pitch.
The t-resolution impact on dσel/dt was determined (and eliminated) by an iterative procedure, that starts by taking the observed (smeared) t-distribution as an input to a Monte Carlo calculation of the un-smearing correction. The correction is applied to the observed t-distribution and yields a better estimate of the true t-distribution. These two steps were repeated three times to reach convergence. The systematic uncertainty of this procedure (due to the uncertainty of the θ*x,y resolution) was estimated to be smaller than 0.5%.
Efficiencies
The efficiency of the RP trigger was estimated by using the zero-bias data stream. The selection of elastic events was repeated for these data and the RP trigger was found efficient for all the selected events. Therefore, at 68% confidence level, it was concluded that the trigger efficiency was higher than 99.8%.
The DAQ inefficiency (dead time) was determined by comparing the numbers of triggered and recorded events, yielding (1.858 ± 0.001)%.
Reconstruction inefficiencies occur due to: intrinsic RP detection inefficiency of each silicon sensor, proton interactions with the material of a RP and "pile-up" of several protons in one event (RPs can uniquely reconstruct only one track). For the last case, the most important contribution is a coincidence of an elastic proton and a beam-halo proton, see fig. 1.
Uncorrelated inefficiencies of separate RPs were studied by removing the RP in question from the selection cuts and counting the recovered events. For this study, only cut 2 could be kept – the others require both near and far RP measurements. The result was an inefficiency of (1.5 ± 0.2)% for the near and (3.0 ± 0.2)% for the far RPs. This difference can be explained by the proton interactions in the near RP that affect the far RP too. This near-far correlated inefficiency was determined from data by counting events with corresponding shower signatures, yielding (1.5 ± 0.7)% (this result is confirmed by MC simulations).
The "pile-up" inefficiency was calculated from the probability of finding an additional track (on top of the elastic) in any station of a diagonal. This probability was determined from the zero-bias data stream and was found to increase as the RPs approached the beam. For instance, for the diagonal bottom-left top-right, the probabilities were (3.9 ± 0.3)%, (6.2 ± 0.3)% and (7.9 ± 0.3)% for the data sets 1, 2 and 3, respectively.
Luminosity
In this article, the luminosity measured by CMS (with a 4%-uncertainty estimate) was used. Luminosity-independent results are given elsewhere [4].
Systematic uncertainty calculation
For each of the analysis steps above, the systematic uncertainty effect on dσel/dt was estimated with a Monte Carlo simulation. Table 3 summarizes these uncertainties for several |t|-values, grouping the contributions into three categories: t-dependent, t-independent (normalization) and luminosity uncertainties. Since there are a number of contributions in each category, the uncertainties were combined in quadrature.
The luminosity uncertainty is the leading systematic effect for |t| < 0.2 GeV2, above that point it is the uncertainty of dLx/ds. The optics-related error contribution is almost vanishing around |t| = 0.06 GeV2 and has opposite signs below and above that point. Therefore, there is a partial error cancellation in the integrated elastic cross-section σel, and consequently the relative error of σel is significantly lower than the one of dσel/dt|0 – see table 7. Moreover, there is a strong correlation between the errors of σel and dσel/dt|0 – the correlation coefficient is 0.76.
Extrapolation to t = 0
The measured differential cross-section can be well (χ2/n.d.f. ≈ 1.2) described with the parameterization
over a large |t|-range, see table 6 and the black line in fig. 2. Since the slope B remains constant even for the lowest |t|-values, one may conclude that the effects of the Coulomb-hadronic interference (for details see, e.g., [8]) are smaller than our experimental sensitivity. Therefore, within the uncertainties, the fit can be attributed to the hadronic component of the scattering amplitude. Furthermore, it is assumed that eq. (4) describes the hadronic cross-section also for |t| values below our acceptance and thus the fit can be used in the optical theorem to calculate the total cross-section according to eq. (5).
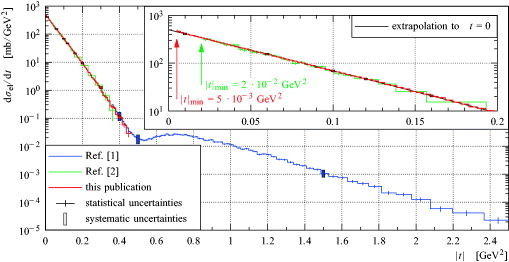
Fig. 2: The elastic differential cross-section measurements by TOTEM. Each measurement is shown in a different color. The embedded figure provides a zoom of the region used for extrapolation to t = 0, showing the lowest |t|-values accessible in the analysis from ref. [2] (green) and this analysis (red).
Download figure:
Standard imageResults
TOTEM has taken data under various beam and background conditions, luminosities and RP detector positions. The differential elastic cross-section obtained from these different data sets are in excellent agreement with each other. This justifies merging the data from all data sets to obtain a final result for the differential cross-sections presented in table 4. The first two bins suffer from the lower statistics of the data sets 2 and 3. Table 4 gives a representative |t|-value for each bin, determined according to the procedure described elsewhere [10]. The relative uncertainties of the representative points turn out to be negligible (<10−4). Table 5 presents the dσel/dt continuation to higher |t| values, measured in a different run with β* = 3.5 m optics and published elsewhere [1]. All TOTEM differential cross-section measurements are given in fig. 2.
Table 4:. The elastic differential cross-section determined in this analysis. Some details on the systematic uncertainty calculation can be found in table 3, which can also be used to evaluate the correlations of the systematic uncertainties among the bins (the three contributions are independent).
| |t| (GeV2) |  (mb/GeV2) ±stat±syst (mb/GeV2) ±stat±syst |
|t| (GeV2) |  (mb/GeV2) ±stat±syst (mb/GeV2) ±stat±syst |
|t| (GeV2) |  (mb/GeV2) ±stat±syst (mb/GeV2) ±stat±syst |
|t| (GeV2) |  (mb/GeV2) ±stat±syst (mb/GeV2) ±stat±syst |
|---|---|---|---|---|---|---|---|
| 0.00515 | 465.±27.±21. | 0.0477 | 197.2±1.3±8.3 | 0.106 | 61.90±0.58±2.66 | 0.196 | 10.11±0.23±0.61 |
| 0.00650 | 465.±11.±21. | 0.0499 | 187.5±1.3±7.9 | 0.109 | 58.11±0.55±2.50 | 0.201 | 9.31±0.22±0.57 |
| 0.00818 | 437.5±5.0±19.1 | 0.0522 | 178.1±1.2±7.5 | 0.112 | 54.11±0.53±2.33 | 0.207 | 8.07±0.21±0.51 |
| 0.00995 | 411.0±3.3±17.7 | 0.0545 | 168.8±1.2±7.1 | 0.116 | 51.21±0.51±2.20 | 0.213 | 6.98±0.19±0.45 |
| 0.0117 | 402.3±2.9±17.3 | 0.0569 | 162.5±1.1±6.8 | 0.119 | 48.24±0.49±2.07 | 0.219 | 6.22±0.17±0.42 |
| 0.0135 | 384.5±2.6±16.5 | 0.0592 | 155.5±1.1±6.5 | 0.122 | 44.99±0.46±1.96 | 0.225 | 5.38±0.16±0.37 |
| 0.0154 | 378.0±2.4±16.2 | 0.0616 | 149.4±1.1±6.3 | 0.126 | 42.74±0.45±1.89 | 0.232 | 4.40±0.14±0.31 |
| 0.0172 | 360.3±2.3±15.4 | 0.0641 | 140.2±1.0±5.9 | 0.130 | 39.49±0.43±1.77 | 0.239 | 4.25±0.14±0.31 |
| 0.0191 | 348.1±2.2±14.9 | 0.0666 | 135.10±0.99±5.70 | 0.133 | 35.75±0.43±1.63 | 0.246 | 3.47±0.13±0.26 |
| 0.0210 | 337.0±2.1±14.4 | 0.0691 | 129.00±0.96±5.45 | 0.137 | 33.63±0.41±1.56 | 0.253 | 2.82±0.11±0.22 |
| 0.0229 | 325.0±2.0±13.9 | 0.0716 | 120.53±0.91±5.10 | 0.141 | 31.08±0.41±1.47 | 0.261 | 2.52±0.10±0.20 |
| 0.0248 | 307.9±1.9±13.1 | 0.0742 | 115.10±0.89±4.88 | 0.145 | 28.91±0.39±1.39 | 0.270 | 2.142±0.097±0.178 |
| 0.0268 | 296.7±1.8±12.7 | 0.0769 | 109.63±0.86±4.65 | 0.149 | 25.65±0.38±1.25 | 0.278 | 1.824±0.086±0.157 |
| 0.0287 | 285.9±1.8±12.2 | 0.0795 | 104.97±0.83±4.46 | 0.153 | 24.16±0.36±1.20 | 0.287 | 1.455±0.075±0.129 |
| 0.0307 | 275.3±1.7±11.7 | 0.0823 | 100.22±0.80±4.27 | 0.157 | 22.35±0.35±1.13 | 0.297 | 1.257±0.069±0.116 |
| 0.0328 | 263.0±1.6±11.2 | 0.0850 | 93.18±0.76±3.97 | 0.162 | 20.22±0.34±1.04 | 0.307 | 0.848±0.055±0.081 |
| 0.0348 | 252.0±1.6±10.7 | 0.0878 | 89.16±0.74±3.81 | 0.166 | 19.01±0.32±1.00 | 0.318 | 0.633±0.046±0.063 |
| 0.0369 | 242.8±1.5±10.3 | 0.0907 | 81.78±0.70±3.50 | 0.171 | 16.92±0.30±0.91 | 0.330 | 0.558±0.043±0.058 |
| 0.0390 | 231.6±1.5±9.8 | 0.0936 | 78.85±0.68±3.38 | 0.175 | 15.20±0.29±0.83 | 0.342 | 0.417±0.038±0.045 |
| 0.0411 | 222.2±1.4±9.4 | 0.0966 | 73.92±0.65±3.17 | 0.180 | 13.90±0.28±0.78 | 0.356 | 0.269±0.027±0.030 |
| 0.0433 | 210.9±1.4±8.9 | 0.0996 | 68.77±0.62±2.96 | 0.185 | 12.09±0.26±0.69 | 0.371 | 0.235±0.025±0.028 |
| 0.0455 | 204.8±1.3±8.7 | 0.103 | 65.53±0.60±2.82 | 0.190 | 11.26±0.25±0.66 |
Table 5:. The elastic differential cross-section as given in [1]. The systematic uncertainties are almost fully correlated among the bins.
| |t| (GeV)2 |  ±stat±syst ±stat±syst |
|t| (GeV)2 |  ±stat±syst ±stat±syst |
|t| (GeV)2 |  ±stat±syst ±stat±syst |
|t| (GeV)2 |  ±stat±syst ±stat±syst |
|---|---|---|---|---|---|---|---|
| 0.377±0.002 | 225.±6.±55.82. | 0.574±0.004 | 18.3±0.9±5.17.0 | 0.863±0.005 | 16.3±0.6±4.55.8 | 1.290±0.009 | 3.3±0.2±0.91.0 |
| 0.384±0.002 | 174.±5.±43.64. | 0.588±0.004 | 20.8±0.9±5.87.9 | 0.880±0.005 | 16.4±0.6±4.55.8 | 1.322±0.009 | 2.7±0.2±0.70.9 |
| 0.391±0.002 | 157.±4.±39.58. | 0.602±0.004 | 22.8±1.0±6.48.7 | 0.897±0.005 | 16.9±0.6±4.76.0 | 1.355±0.010 | 2.2±0.1±0.60.7 |
| 0.398±0.002 | 133.±4.±33.49. | 0.616±0.004 | 22.2±1.0±6.28.4 | 0.913±0.005 | 14.1±0.6±3.95.0 | 1.390±0.011 | 2.0±0.1±0.50.6 |
| 0.405±0.002 | 116.±3.±29.43. | 0.629±0.004 | 24.2±1.0±6.89.2 | 0.931±0.005 | 14.0±0.6±3.94.9 | 1.428±0.011 | 1.6±0.1±0.40.5 |
| 0.412±0.002 | 93.±3.±23.34. | 0.643±0.004 | 24.7±1.0±6.99.3 | 0.948±0.005 | 14.1±0.6±3.94.9 | 1.467±0.011 | 1.5±0.1±0.40.4 |
| 0.420±0.002 | 78.±2.±20.29. | 0.657±0.004 | 27.4±1.1±7.60.3 | 0.966±0.005 | 11.9±0.5±3.34.1 | 1.507±0.012 | 1.1±0.1±0.30.3 |
| 0.428±0.002 | 63.±2.±16.24. | 0.671±0.004 | 24.8±1.0±6.99.3 | 0.985±0.006 | 12.2±0.5±3.44.2 | 1.552±0.014 | 0.84±0.07±0.230.25 |
| 0.436±0.002 | 54.±2.±14.20. | 0.685±0.004 | 25.1±1.0±7.09.4 | 1.005±0.006 | 11.3±0.5±3.13.9 | 1.603±0.015 | 0.75±0.07±0.200.22 |
| 0.445±0.003 | 45.±1.±12.17. | 0.700±0.004 | 27.3±1.0±7.60.2 | 1.024±0.006 | 10.0±0.4±2.83.4 | 1.656±0.016 | 0.56±0.05±0.150.16 |
| 0.454±0.003 | 34.±1.±9.13. | 0.714±0.004 | 26.5±1.0±7.49.8 | 1.044±0.006 | 8.7±0.4±2.43.0 | 1.713±0.017 | 0.46±0.05±0.120.13 |
| 0.464±0.003 | 30.±1.±8.12. | 0.728±0.004 | 25.9±1.0±7.29.6 | 1.065±0.006 | 7.9±0.4±2.22.7 | 1.777±0.020 | 0.37±0.04±0.100.10 |
| 0.474±0.003 | 26.±1.±7.10. | 0.742±0.004 | 25.0±0.9±7.09.2 | 1.086±0.006 | 8.1±0.4±2.22.7 | 1.851±0.023 | 0.22±0.03±0.060.06 |
| 0.485±0.003 | 21.6±0.9±5.98.4 | 0.757±0.004 | 26.0±0.9±7.29.5 | 1.108±0.006 | 7.2±0.3±2.02.4 | 1.932±0.024 | 0.19±0.03±0.050.05 |
| 0.496±0.003 | 19.5±0.9±5.47.6 | 0.771±0.004 | 24.1±0.9±6.78.8 | 1.131±0.007 | 6.5±0.3±1.82.2 | 2.024±0.029 | 0.13±0.02±0.030.03 |
| 0.508±0.003 | 18.0±0.8±5.07.0 | 0.786±0.004 | 23.2±0.8±6.48.4 | 1.155±0.007 | 5.1±0.3±1.41.7 | 2.133±0.034 | 0.059±0.012±0.0150.014 |
| 0.520±0.004 | 17.1±0.8±4.86.6 | 0.801±0.004 | 21.3±0.8±5.97.7 | 1.179±0.007 | 5.3±0.3±1.41.7 | 2.272±0.048 | 0.041±0.008±0.0110.010 |
| 0.533±0.004 | 16.1±0.8±4.56.2 | 0.816±0.004 | 21.6±0.8±6.07.8 | 1.205±0.008 | 5.0±0.3±1.41.6 | 2.443±0.050 | 0.023±0.005±0.0060.005 |
| 0.547±0.004 | 16.9±0.8±4.76.5 | 0.831±0.004 | 18.9±0.7±5.26.8 | 1.232±0.008 | 4.2±0.2±1.21.4 | ||
| 0.560±0.004 | 18.5±0.9±5.27.1 | 0.847±0.005 | 18.3±0.7±5.16.6 | 1.261±0.008 | 3.4±0.2±0.91.1 |
For |t|-values below 0.2 GeV2, the differential cross-section falls exponentially with |t|, as expressed in eq. (4). Due to the closer approach of the RP detectors to the beam center (see table 1) in these data, the minimal reachable |t|-value was lowered from 0.02 of the previous measurement [2] down to 0.005 GeV2. However, the exponential slope B of the differential elastic cross-section stayed unchanged in this newly explored |t|-region. As presented in table 6, the slope does not change with the chosen fit intervals. Consequently, the exponential dependence can be fitted over the large |t|-interval from 0.005 to 0.2 GeV2 resulting in a high-precision determination of B. Compared to previous collider experiments at lower energies (fig. 3), B rises steadily with the collision energy  .
.
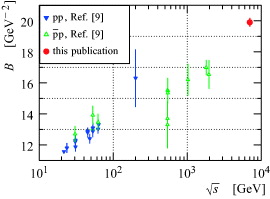
Fig. 3: The elastic slope B (see eq. (4)) as a function of the scattering energy  (data from [9] use different treatments of the Coulomb-hadronic interference).
Download figure:
Standard imageTable 6:. Elastic slopes B (in GeV−2) obtained from parameterization equation (4) fitted through intervals |t|low to |t|high.
| |t|low | |t|high | |
|---|---|---|
| 0.1 GeV2 | 0.2 GeV2 | |
| 0.005 GeV2 | 19.96±0.04stat±0.22syst | 19.89±0.02stat±0.27syst |
| 0.020 GeV2 | 19.93±0.05stat±0.21syst | 19.87±0.03stat±0.33syst |
In order to derive the elastic and total cross-sections, the extrapolation to the optical point t = 0 was performed (see eq. (4)). The fact that 91% of the elastic cross-section was visible gives high confidence to the derived cross-sections, all summarized in table 7 with their statistical and systematic uncertainties. The elastic data were integrated up to |t| = 0.415 GeV2, where the effect of the larger |t|-contributions is small compared to the other uncertainties. The optical theorem can be used to calculate the total and inelastic cross-sections:

For the ρ parameter the COMPETE [11] preferred-model extrapolation of 0.141 ± 0.007 was chosen.
Table 7:. Result summary with detailed uncertainty composition. The t-dependent, normalization and luminosity uncertainties correspond to those presented in table 3. The ρ uncertainty follows from the COMPETE preferred-model ρ extrapolation error of ±0.007. The rightmost column gives the full systematic uncertainty, combined in quadrature and considering the correlations between the contributions (e.g., the uncertainty of σinel is suppressed due to the correlation between σel and dσel/dt|0).
| Quantity | Value | Statistical uncertainty | Systematic uncertainty | |||||
|---|---|---|---|---|---|---|---|---|
| t-dep | norm | lumi | ρ | ⇒ full | ||||
| dσel/dt|0 | (mb/GeV)2 | 506.4 | ±0.9 | ±8.6 | ±6.1 | ±20.4 | ⇒±23.0 | |
| B | (GeV−2) | 19.89 | ±0.03 | ±0.27 | ⇒±0.27 | |||
| σel | (mb) | 25.43 | ±0.03 | ±0.10 | ±0.31 | ±1.02 | ⇒±1.07 | |
| σtot | (mb) | 98.58 | ±0.84 | ±0.59 | ±1.98 | ±0.10 | ⇒±2.23 | |
| σinel | (mb) | 73.15 | ±0.77 | ±0.29 | ±0.96 | ±0.10 | ⇒±1.26 | |
Outlook
The above measurements will be repeated this year at the energy of  . Furthermore, in the spirit of the 90 m optics, a larger β* optics (β* = 500 to 1000 m) is presently under development. With such an optics at the energy of
  , minimum reachable |t|-values around 5·10−4 GeV2 (where Coulomb and hadronic contributions to the differential cross-sections are about equal) will allow the study of the Coulomb-hadronic interference and consequently the determination of the ρ parameter. Likewise, measurements of large |t| elastic scattering are under study. Such measurements might reveal further diffractive minima as predicted by some phenomenological models.
Acknowledgments
We are indebted to the beam optics development team for the design, the thorough preparations and the successful commissioning of the β* = 90 m optics. We congratulate the CERN accelerator groups for the very smooth operation in 2011. We thank the LHC machine coordinators for scheduling the dedicated fills.
We are grateful to CMS for providing their luminosity measurements.
This work was supported by the institutions listed on the front page and partially also by NSF (US), the Magnus Ehrnrooth foundation (Finland), the Waldemar von Frenckell foundation (Finland), the Academy of Finland, the OTKA grant NK 101438, 73143 (Hungary) and the NKTH-OTKA grant 74458 (Hungary).