
Abstract
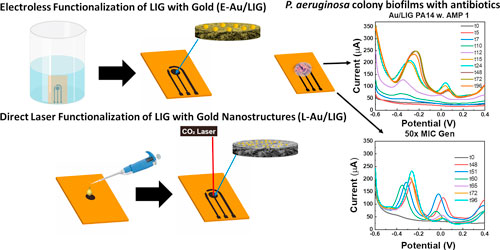
Pseudomonas aeruginosa (P. aeruginosa) is a phenazine-producing pathogen recognized for its biofilm-mediated antibiotic resistance, showing up to 1000 times higher resistance compared to planktonic cells. In particular, it is shown that a phenazine called pyocyanin promotes antibiotic tolerance in P. aeruginosa cultures by upregulating efflux pumps and inducing biofilm formation. Therefore, real-time study of phenazine production in response to antibiotics could offer new insights for early detection and management of the infection. Toward this goal, this work demonstrates real-time monitoring of P. aeruginosa colony biofilms challenged by antibiotics using electrochemical sensors based on direct laser functionalization of laser induced graphene (LIG) with gold (Au) nanostructures. Specifically, two routes for functionalization of the LIG electrodes with Au-containing solutions are studied: electroless deposition and direct laser functionalization (E-Au/LIG and L-Au/LIG, respectively). While both methods show comparable sensitivity (1.276 vs 1.205 μA μM−1), E-Au/LIG has bactericidal effects which make it unsuitable as a sensor material. The effect of antibiotics (gentamicin as a model drug) on the production rate of phenazines before (i.e., in planktonic phase) or after biofilm formation is studied. The sensor data confirms that the P. aeruginosa biofilms are at least 100 times more tolerant to the antibiotic compared to planktonic cells. The biosensors are developed using a scalable and facile manufacturing approach and may pave the way toward simple-to-use antibiotic susceptibility testing devices for early infection diagnosis and real-time study of antibiotic resistance evolution.
Highlights
A low-cost electrochemical sensor for real time monitoring of the effect of antibiotics on phenazine production in P. aeruginosa biofilms is developed.
The gold nanocrystals improve the performance of LIG-based sensors.
Two routes for functionalization of LIG with gold are studied which show different properties.
The real time sensor data shows that pyocyanin promotes cell survival when exposed to antibiotics.
Export citation and abstract BibTeX RIS

This is an open access article distributed under the terms of the Creative Commons Attribution 4.0 License (CC BY, http://creativecommons.org/licenses/by/4.0/), which permits unrestricted reuse of the work in any medium, provided the original work is properly cited.
Pseudomonas aeruginosa (P. aeruginosa) is a prevalent and opportunistic pathogen, causing deadly infections in critically ill patients. Most P. aeruginosa infections are nosocomial, for example, chronic wounds, ventilator-associated pneumonia, and cystic fibrosis. One of the most common methods for detecting/studying P. aeruginosa is based on monitoring and detection of its phenazines, in particular pyocyanin (PYO). 1–4 It has been shown that cells start secreting PYO when P. aeruginosa reaches the stationary growth phase. The functions of PYO include serving as a signaling molecule for quorum sensing (QS) - a communication strategy between bacteria cells to control their density, adjust gene expression, and support biofilm formation. 5–7 When bacterial cells stick to a wet surface, such as surface of a catheter, they trigger formation of sessile biofilm communities. Unlike cell growth in planktonic form, cells in a biofilm are enclosed in an extracellular matrix made mostly of polysaccharides and extracellular DNA. 8 It is known that bacteria become significantly more resistant to antibiotics once they form biofilms. The increased antibiotic tolerance (100 to 1000 times higher) is because of low diffusion and decreased metabolic rate. 9–12 One study estimated that biofilms have a substantial bearing on over 90% of chronic wound infections, affecting 6.5 million patients. 13,14
Importantly, it is shown that P. aeruginosa secrets phenazines which promote tolerance to antibiotics. 15 In particular, collective antibiotic tolerance is observed in P. aeruginosa biofilms, in which PYO stimulates bacterial growth at subinhibitory antibiotic doses. Ahmed et al. observed a higher degree of ciprofloxacin resistance in biofilm colonies compared to planktonic cells exposed to the same drug concentrations. 16,17 Moreover, Wang et al.'s work showed that young biofilms are much more susceptible to antibiotics than more developed biofilms. 18 Castañeda et al. found that PYO stimulates the selection of more virulent cells via the QS system. 19 Furthermore, Moker et al. showed that phenazines significantly increased persister cells, which are a small subpopulation of bacteria that can survive lethal doses of bactericidal antibiotics. 20 Thus, real time monitoring of P. aeruginosa, at different growth stages (from planktonic cells to young and eventually mature biofilms), exposed to antibiotics and understanding the correlation to production of virulence factors (such as phenazines) could offer new insights for improving patient outcomes, noting that it is easier to treat biofilms at early stages using available antibiotics. 21,22
Electrochemical sensing approaches are considered as an attractive alternative to conventional methods for detecting phenazines (which are redox active) produced by P. aeruginosa because of a number of benefits, such as simplicity of operation, low cost, fast detection time, and high sensitivity. 1 Several electrochemical sensors have been developed for rapid and quantitative detection of phenazines. 2,21,23,24 Among different materials, carbon-based electrodes – standalone or functionalized with nanoparticles such as gold, which enhance the active surface area of the electrode and facilitate electron transfer rates between phenazines and the electrode surface – have been used extensively in the construction of electrochemical sensors for phenazine detection. Carbon offers an excellent choice as the sensor substrate due to its chemical inertness, minimal toxicity, and the overlap of its molecular structure with the benzene ring in phenazines. 23 Several carbon-based sensors for detecting phenazines (especially for PYO) have been reported. For example, Burkitt et al. developed printed carbon electrodes for detection of PYO with concentrations as low as 0.18 μM in human serum and 0.336 μM in both buffer and simulated wound fluid. 25 Silva et al. used an inexpensive Nafion-modified graphite pencil lead as the working electrode in an electrochemical paper-based analytical device. The sensor showed high sensitivity with a low limit of quantification (33 nM). 26 Manisha et al. also reported carbon electrodes developed using a printing approach for disposable paper-based sensing with high sensitivity and low-cost preparation. 27
There are also some reports on electrochemical sensing of phenazines in P. aeruginosa cells exposed to antibacterial reagents. For example, Webster et al. developed a microfluidic device to measure excreted PYO via electrochemical detection, demonstrating a good correlation between the electrical signal drop and the viability of P. aeruginosa cells in response to colistin sulfate. 28 Liu et al. used microfabricated microfluidic chips with nanoporous gold working electrodes to study the minimum bactericidal concentration of ciprofloxacin for P. aeruginosa. 29 Simonska et al. studied the PYO secretion rates of P. aeruginosa in a wound simulating medium using square wave voltammetry (SWV). They confirmed that PYO production was inhibited in the presence of silver ions. 30 While the majority of the reports on developing electrochemical methods for studying the response of P. aeruginosa to antibiotics only explored planktonic cells, there are limited reports of electrochemical monitoring of biofilms to antibiotics.
In our previous work, 31 we studied the production of phenazines in P. aeruginosa colony biofilms using electrochemical sensors based on laser induced graphene (LIG) manufactured using a facile, affordable, and environmentally-friendly process which also allows flexibility in the sensor design. We showed that the sensors are ideally suited for real time study of the dynamics of phenazine production over several days. Specifically, we showed that functionalization of LIG with molybdenum polysulfide significantly improves sensitivity to phenazines. Yet, the functionalization process was based on electrodeposition of molybdenum polysulfide which requires individual connection of working electrodes to apply voltage which could add additional complexity in the manufacturing of LIG-based sensors. To further simplify the LIG-based sensor manufacturing while ensuring high sensitivity to phenazines, in this paper, we explore two electrodeposition-free methods for functionalization of LIG, namely gold electroless deposition (E-Au/LIG) and direct laser processing (L-Au/LIG, using a two-step laser writing approach). We perform a thorough study of the bactericidal effects of the two methods and show that L-Au/LIG does not impose toxic effects on bacterial cells under study in contrast to E-Au/LIG, making it a suitable material for building sensors to interrogate P. aeruginosa. Using optimized L-Au/LIG sensors, we study the response of P. aeruginosa biofilms (specifically, production of PYO) to antibiotics over 4 d, in real-time. Two antibiotics are tested, ampicillin and gentamycin, with P. aeruginosa known to be resistant to the former. Our results show that the cells behave distinctly differently depending on when they are exposed to antibiotics, i.e., from the beginning when they are in the planktonic phase or after the biofilm is formed. Specifically, cells are highly resistant to gentamycin when the drug is added in the biofilm phase, i.e., while the minimum inhibitory concentration (MIC) of planktonic cells is 0.5 μg ml−1, at least 50 μg ml−1 is needed to slow down the production of PYO in biofilms. In addition, our data show that PYO plays a key role in the resistance of P. aeruginosa to antibiotics. The capability enabled by the developed biosensors for real time and long-term monitoring of biofilms and their phenazines demonstrates their potential as low-cost and easily manufactured sensors for antibiotic susceptibility testing of biofilm infections, as well as predicting potential collective antibiotic tolerance in cells.
Results and Discussion
Functionalization of LIG with gold and material characterization
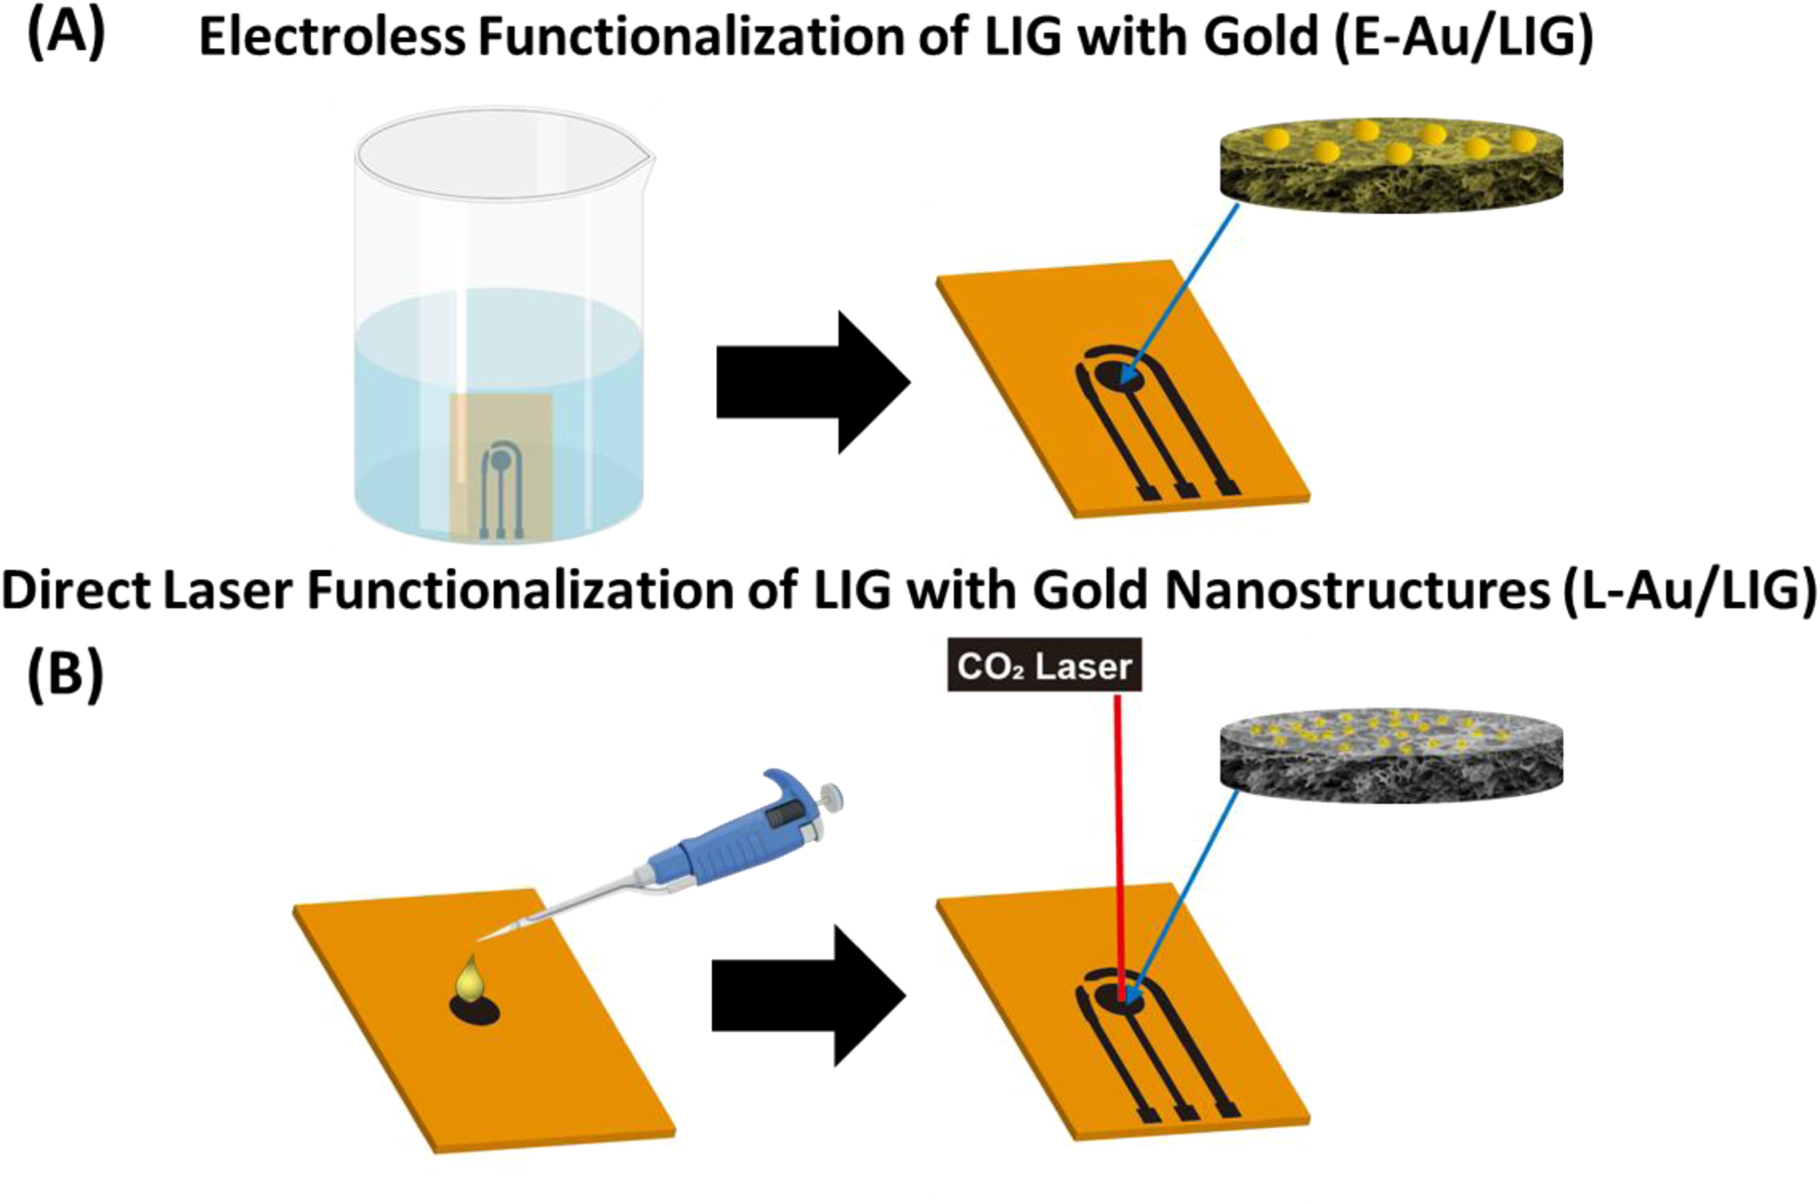
As shown in Fig. 1, base LIG electrodes with a 3-electrode design are first fabricated using our previously reported method (optimized parameters: power: 12.6%, speed: 5.5%, and PPI: 1000) on polyimide (Kapton®, 500 HN). Two functionalization routes are explored: electroless gold deposition (E-Au/LIG: Fig. 1A) and direct laser functionalization process (L-Au/LIG: Fig. 1B). E-Au/LIG is obtained by immersing the LIG-patterned sample in gold chloride solution (HAuCl4, 0.06% wt. in ethanol) and reduced with ethanol and ascorbic acid as previously reported. 32 L-Au/LIG is obtained by dropping the HAuCl4 solution on the working electrode area and waiting 10 min to allow the solution to permeate through the porous structure of LIG, followed by another laser writing step to decompose the precursor thermally. The increased local temperature leads to rapid thermal decomposition and creation of gold nanostructures in the LIG scaffold (details in the Methods Section). We optimized the laser functionalization process by studying the effect of gold loading concentration (1, 10, and 100 mM of HAuCl4) and finally chose 1 mM for building the sensors, as this concentration offers the highest sensitivity to PYO (discussed in Fig. 2) and also requires the least amount of the precursor, hence lowering the overall sensor cost.

Figure 1. Two routes for functionalization of LIG with gold are explored. (A) Electroless deposition of gold on LIG (E-Au/LIG), by immersing the as-printed electrodes in HAuCl4 for 30 min, followed by exposing toascorbic acid for 60 min. (B) Direct laser writing to form gold-functionalized LIG (L-Au/LIG). After the first writing of the working electrode, gold precursor solution is dropped on the LIG working electrode, followed by a second laser writing to functionalize gold and also to write the counter and reference electrodes.
Download figure:
Standard image High-resolution image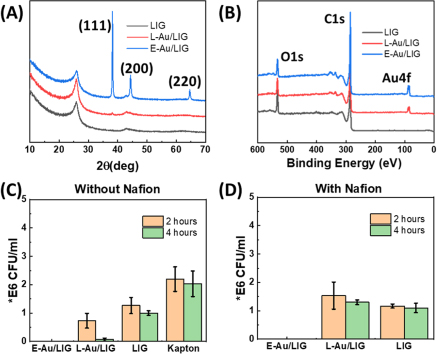
Figure 2. Material characterizations. (A) The XRD profile of LIG, direct laser functionalized gold on LIG (L-Au/LIG), and electroless deposited gold on LIG (E-Au/LIG). (B) The XPS survey spectra of LIG, L-Au/LIG, and E-Au/LIG showing their chemical components. The cell density (CFU/ml) using colony counting to compare the biocompatibility of L-Au/LIG and E-Au/LIG without Nafion (C) and with Nafion (D).
Download figure:
Standard image High-resolution imageTo characterize the electrode surface morphology and chemical composition, scanning electron microscopy (SEM), X-ray diffraction (XRD), and X-ray photoelectron spectroscopy (XPS) are performed. SEM image and EDS maps of L-Au/LIG are shown in the Supporting Information (SI), Fig. S1, confirming the highly porous structure of LIG. The formation of the porous structure is attributed to gas release during the rapid laser irradiation process, where the energy from the laser results in lattice vibrations, which in turn lead to localized high temperatures (>2,500 °C), breaking the C–O, C=O, and N–C bonds. Aromatic compounds are then rearranged to form graphitic structures. 33 SEM image of E-Au/LIG is also shown in SI, Fig. S2. EDS mapping of E-Au/LIG and L-Au/LIG shown in Figs. S1 and S2 confirm the presence of a much lower amount of gold with 1 mM L-Au/LIG compared to E-Au/LIG, which is expected considering the significantly smaller Au load in L-Au/LIG compared to E-Au/LIG, which are created by immersion of LIG in 2.8 mM of the gold precursor solution. To confirm the formation of crystalline gold structures, we performed XRD and XPS. XRD profiles of LIG, L-Au/LIG, and E-Au/LIG are shown in Fig. 2A. Bare LIG shows a broad diffraction peak centered at 2θ = 25.5° of the graphite (002) plane, indicating a high degree of graphitization. For E-Au/LIG, peaks of (111), (200), and (220) planes of gold are observed. For L-Au/LIG, a slight peak of gold (111) is observed. In order to obtain a more precise signature of Au in both E-Au/LIG and L-Au/LIG samples, XPS analysis was performed (Fig. 2B). Specifically, to study the uniformity of the functionalization process, we performed XPS mapping by studying the center and edge of the WE with three different concentrations of HAuCl4. As shown in Fig. S3, the atomic % of gold is 1.68% at the center with 1 mM HAuCl4 solution, compared to 9.15% and 22.2% using 10 mM and 100 mM. Interestingly, with all concentrations, the amount of gold at the edges and center is similar, confirming excellent uniformity of the laser functionalization process.
Biocompatibility of Au/LIG electrodes for studying bacterial cells
In order to determine the best material to fabricate the sensor working electrode, we tested the biocompatibility of L-Au/LIG and E-Au/LIG. The results are shown in Figs. 2C, 2D. This study is needed as an ideal sensor electrode for studying cells should not be toxic to them. 34 The effect of Nafion coating on the biocompatibility of electrodes is also studied. As presented in Fig. 2C, while cell density changes from ∼2 × 10⁶ CFU/ml (control sample; Kapton sheet) to ∼1.2 × 10⁶ CFU/ml and ∼1 × 10⁶ CFU/ml with bare LIG and L-Au/LIG within 2 h and further reduces at 4 h, E-Au/LIG completely eradicates the cells which shows its strong bactericidal effect. To further reduce the antibacterial effects, we coat the electrodes with Nafion, which is also a common antifouling layer for biosensors. 35 Figure 2D indicates that the toxicity effect of L-Au/LIG is significantly reduced after coating with Nafion, while E-Au/LIG is still highly toxic. This could be because the large clusters of gold in E-Au/LIG (see SEM image in SI, Fig. S2) are hard to be entirely covered by Nafion compared to L-Au/LIG.
Sensor characterization with synthetic phenazines
To investigate the effect of the functionalization methods on sensor sensitivity to phenazines, we tested L-Au/LIG and E-u/LIG with PYO ranging from 0.1 to 100 μM in brain-heart infusion (BHI). For L-Au/LIG, we studied 3 different concentrations of the gold precursor solution. As shown in Figs. 3A–3C, the sensor made with 1 mM of the gold precursor, shows better performance (much larger SWV peak currents) than the other two concentrations and is also better than E-Au/LIG shown in Fig. S4. The calibration curves in Fig. 3D compare 1 mM L-Au/LIG with E-Au/LIG. While the sensitivity of 1 mM L-Au/LIG is almost the same as E-Au/LIG (1.276 and 1.205 μA μM−1, respectively), the excellent biocompatibility of L-Au/LIG with bacterial cells (see Figs. 2C, 2D) makes it suitable for the studies in this work. Moreover, the cost of L-Au/LIG is much lower than E-Au/LIG since the gold solution dosage used in building L-Au/LIG sensors is much less than E-Au/LIG sensors. The laser writing method used to manufacture L-Au/LIG is also easier to mass-produce, scale up, and readily amenable for rapid and selective functionalization of electrodes using additive manufacturing. We also compare the response of 1 mM and 100 mM L-Au/LIG to phenazine-1-carboxylic acid (PCA) with concentrations ranging from 0.1 to 100 μM in BHI, as shown in SI, Fig. S5. For PCA, 1 mM sample also shows better sensitivity than 100 mM. As a result, 1 mM L-Au/LIG is chosen to manufacture sensors for the biofilm studies in the next section.

Figure 3. Characterization of sensors with synthetic PYO. The SWV curves of L-Au/LIG with 0.1 ∼ 100 uM PYO spiked in BHI with different concentrations of HAuCl4: (A) 1 mM, (B) 10 mM, and (C) 100 mM. 1 mM L-Au/LIG shows the highest sensitivity. (D) Calibration curves of sensors with 1 mM L-Au/LIG and E-Au/LIG. Error bar shows the standard deviation from 3 individual sensor replicates.
Download figure:
Standard image High-resolution imageTo further study the role of gold functionalization on the enhanced response to PYO, we investigate the electrochemically active surface area (ECSA) and the heterogeneous electron transfer rate constant,  using cyclic voltammetry (CV) with 100 μM PYO in BHI with 1 mM L-Au/LIG and compare them to bare LIG. To eliminate the potential impact of the number of laser writing passes on the morphology of the electrodes and hence the electrochemical response, bare LIG is prepared using 2-pass writing for a fair comparison. The ECSA and
  are calculated by studying the relationship between the CV curves (the peak current
 ) and the peak separations (
 ) at different scan rates.
36
) at different scan rates.
36
 vs square root of the scan rate and the linear fitting curves are shown in Fig. S6A. Using the Randles-Sevcik equation, we extracted ECSA of L-Au/LIG with different concentrations of Au precursor (i.e. 1 mM, 10 mM, and 100 mM) and 2-pass written LIG. The extracted ECSA values are summarized in Table S1, showing that 1 mM L-Au/LIG offers the highest ECSA value (noting that all ECSA values are larger than the geometric area of the working electrode (3.14 mm2).
37
vs square root of the scan rate and the linear fitting curves are shown in Fig. S6A. Using the Randles-Sevcik equation, we extracted ECSA of L-Au/LIG with different concentrations of Au precursor (i.e. 1 mM, 10 mM, and 100 mM) and 2-pass written LIG. The extracted ECSA values are summarized in Table S1, showing that 1 mM L-Au/LIG offers the highest ECSA value (noting that all ECSA values are larger than the geometric area of the working electrode (3.14 mm2).
37
 of 1 mM L-Au/LIG calculated from Fig. S6B is 0.00447 cm s−1 compared with 0.00245 cm s−1 of bare LIG, showing almost a 2-fold enhancement, and hence faster kinetics towards PYO oxidation. In addition to ECSA analysis, we performed Brunauer-Emmett-Teller (BET) measurements to estimate the surface area of the electrodes. As shown in the Table S1, 1 mM L-Au/LIG yields the highest surface area (259.3 m2/g) compared to LIG and other concentrations of L-Au/LIG. The ECSA and BET results consistently show that 1 mM yields the highest surface area and porosity. The decrease of surface area of the 10 mM and 100 mM L-Au/LIG could be because the increased loading of gold creates a film-like layer and reduces the porosity.
We also studied the effect of the position of the laser beam focal plane, as previous research has shown that the defocus setting could potentially affect the sensor sensitivity. 38 Fig. S7A shows the calibration curves of 1 mM L-Au/LIG printed with the Z-axis height changed from 20 to 80 mils. The sensitivity calculated in Fig. S7B suggests that the defocus length does not have a significant impact on sensitivity, noting that the height of LIG on the glass slide is 45 mils, and the highest sensitivity is also obtained within 40 ∼ 50 mils.
Response of P. aeruginosa to antibiotics: studying planktonic cells vs biofilms
After optimizing the sensing material as described in previous sections, we moved forward to the real time studies with P. aeruginosa cells. The colony biofilms have been reported as a model to study the biofilms by Shepard's group and other researchers. 6,7,39 To form the colony biofilm on agar, the LB agar (thickness of t = 2 mm and diameter of d = 6 mm) is inoculated with 5 μl suspension of P. aeruginosa (strain PA14), diluted at 1:100 from the overnight culture, which yields 2.8 × 10⁷ CFU/ml. The number of seeded cells on agar is estimated to be 1.4 × 10⁵ CFU. Fig. 4A shows time-evolution of the SWV waveforms with no antibiotics. There are three peaks in the SWV curves: the first oxidation peak around −0.3 V is associated with PYO, while the second and third are respectively associated with 5-MCA (5-methylphenazine-1-carboxylic acid) and PQS (2-heptyl-3-hydroxy-4-quinolone). 6,31,40 The peaks are first noticed after 12 h and kept increasing within 48 h and then decayed over time. It should be noted that the peak current is higher than our previous work with electrodeposited MoSx-LIG, and hence, shows higher sensitivity of L-Au/LIG to phenazines. 31 To further confirm the presence of PYO in PA14 cultures, we performed Liquid chromatography – Mass Spectrometry (LC-MS). Figure S8 shows the MS ion images of synthetic PYO in LB and PA14 culture in LB at 18 h after incubation. The ion abundance of m/z = 211.086 indicates the existence of PYO in the 18 h cultures, consistent with previous reports. 41,42

Figure 4. Real-time monitoring of PA14 in the presence of ampicillin. The SWV curves of PA14 biofilm on LB agar (A) without antibiotic (control) and (B) with 50 μg ml−1 ampicillin over 96 h.
Download figure:
Standard image High-resolution imageIn the first set of experiments with antibiotics, we tested PA14 with ampicillin which is added at 50 μg ml−1 to the agar slab. Ampicillin is known to be ineffective in treating P. aeruginosa. 43 Based on the results shown in Fig. 4B, the growth of P. aeruginosa and phenazine production show that such a high concentration of ampicillin (above its breakpoint concentration according to CLSI guidelines) cannot inhibit the growth of P. aeruginosa biofilms. 44 Interestingly, PYO level is much higher in the presence of ampicillin compared to the control test. This result suggests that with ampicillin treatment, the PYO is accumulated which in turn suggests that PYO production could be correlated to the antibiotic resistance of P. aeruginosa. Previous studies have also shown that PYO level goes up during antibiotic treatment. 45 On the other hand, while PYO peak increases in the presence of ampicillin, the other two peaks are reduced compared to the control test (in particular, the third peak is almost completely diminished). This behavior demonstrates the existence of complex chemical signaling pathways in biofilms and importance of phenazines in developing antibiotic resistance.
After studying antibiotic resistant cells, we investigated the response of PA14 to gentamicin to which P. aeruginosa is susceptible. In particular, we investigated the effect of gentamicin on PA14 colony biofilms through two important studies, i.e., adding antibiotics to the agar slab from the start when the cells are still in planktonic (free-swimming) phase and adding antibiotics on mature biofilm (after 48 h). We first confirmed the susceptibility of PA14 to gentamicin by determining the minimum inhibitory concentration (MIC) in broth via the broth microdilution (BMD) method. 46 The optical density data is shown in Fig. 5A, confirming a MIC value of 0.5 μg ml−1 which is below the breakpoint concentration (hence, confirming the susceptibility of PA14 to gentamicin). In addition to broth tests, different dosages of gentamicin were mixed with agar, followed by inoculation of PA14 to determine the MIC on agar. As the results in Figs. 5B–5E suggest, gentamicin MIC in agar is 1 μg ml−1, twice that in broth. Similar to ampicillin experiments, the PYO level in the subinhibitory concentration groups (Figs. 5B and 5C) increases significantly over time compared to control (Fig. 4A), which implies that PYO promotes antibiotic tolerance in P. aeruginosa. The role of phenazines in antibiotic resistance development is two-fold: (1) Phenazines regulate biofilm formation, in which cells are surrounded by an extracellular polymeric substances (EPS) matrix, which reduces the effect of antibiotics. 17 Secondly, pyocyanin upregulates the efflux pump to remove the toxicity from the periplasm and cytoplasm. 47 It should be noted that to ensure those peak changes are not because of possible redox activity of the antibiotics, we tested E. coli K12 with gentamicin and ampicillin (Fig. S9). We also performed SWV with 50 μg ml−1 ampicillin and gentamicin spiked in BHI to further confirm that the antibiotics themselves are not redox-active. As can be seen, there are no significant redox peaks, confirming that the antibiotics on their own do not contribute to the redox peaks observed with PA cells.
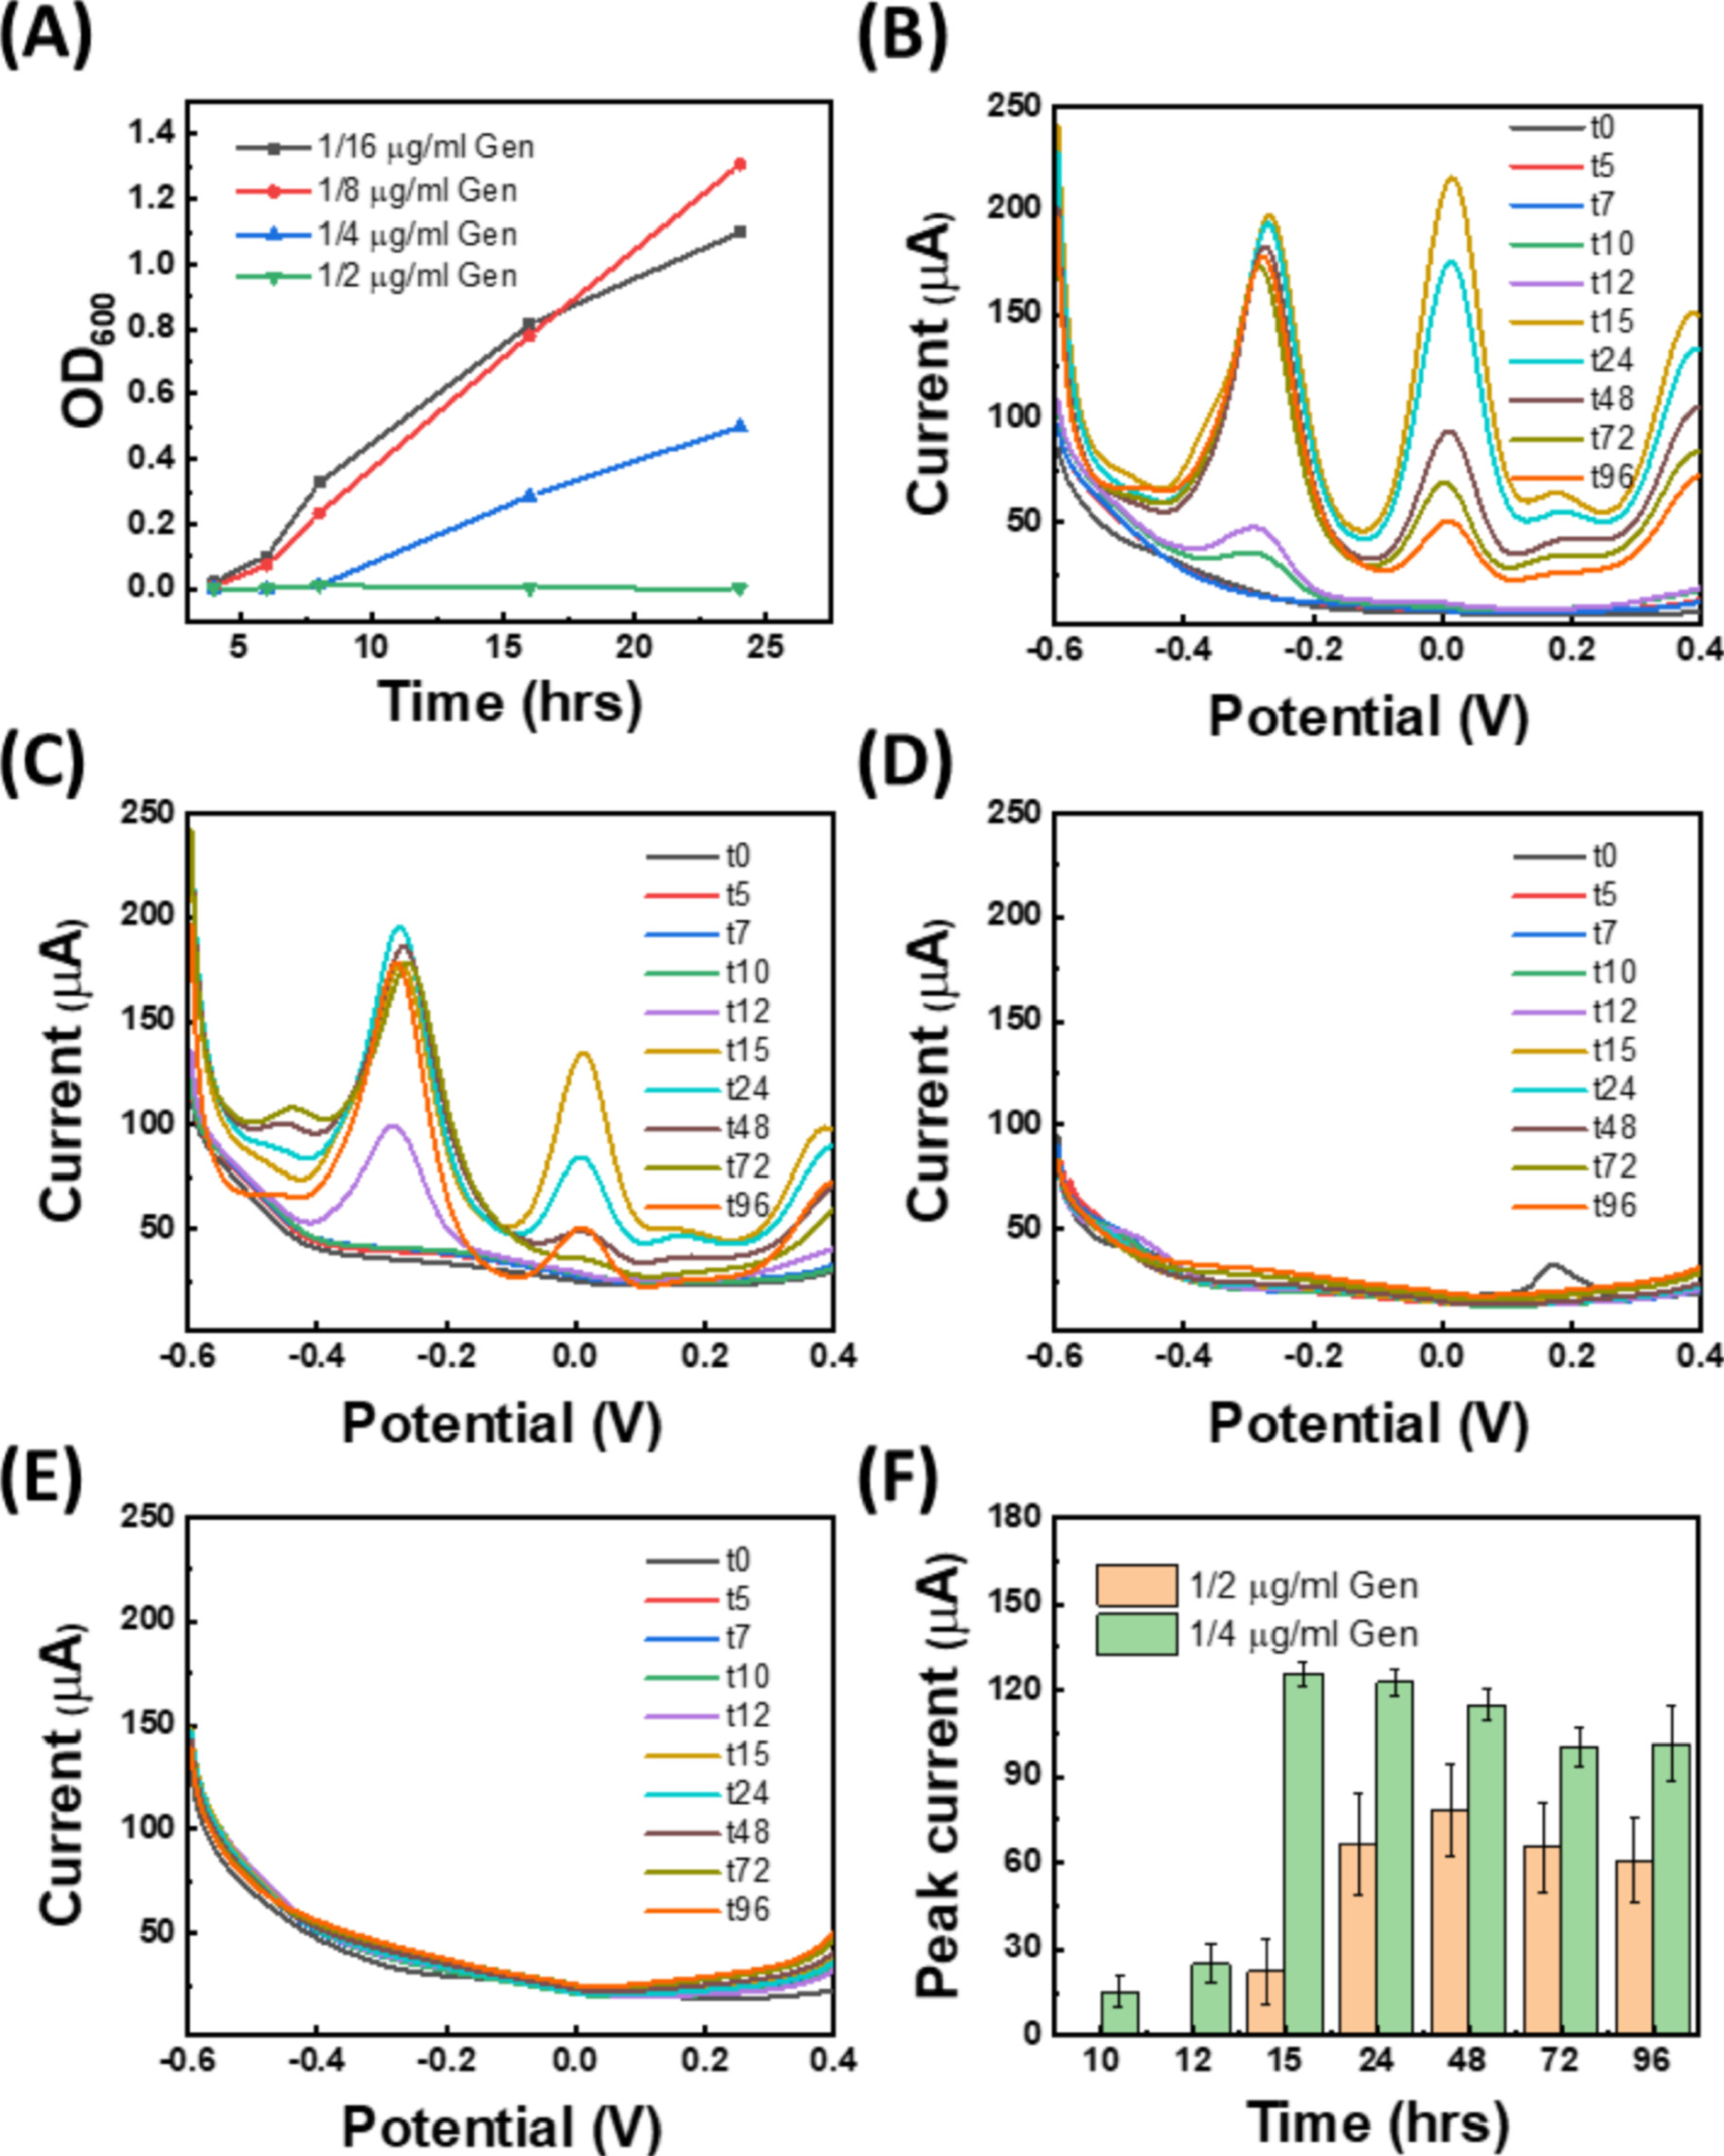
Figure 5. Real-time monitoring of PA14 colony biofilms when gentamicin is added at the seeding stage (i.e., when cells are still in planktonic phase) . (A) The OD600 values of planktonic PA14 in LB with different concentrations of gentamicin over time. The SWV curves of PA14 biofilm on LB agar with different gentamicin concentrations added in agar in the seeding stage: (B) 0.25 μg ml−1, (C) 0.5 μg ml−1, (D) 1 μg ml−1, and (E) 2 μg ml−1. (F) The time-evolution of the first oxidation peak in parts (B) and (C).
Download figure:
Standard image High-resolution imagePrevious studies have shown that MIC will increase up to 1000-fold when P. aeruginosa forms biofilm.
12
To better understand the production dynamics of PYO when mature biofilms are treated with antibiotics, we cultured PA14 cells on LB agar for 48 h to form biofilm, followed by adding gentamicin solution on top of the agar. Figures 6A–6D compare a series of gentamicin treatments ranging from 1–100 μg ml−1.  represents the time when gentamicin is added (corresponding to t48 in experiments in Fig. 5). The PYO peak (the first SWV oxidation peak) is normalized to its value at
  and plotted in Fig. 6E to demonstrate the PYO dynamic and production rate among different doses of gentamicin. The results show that the PYO level with 1–10 μg ml−1 gentamicin is significantly higher than the control group, highlighting the PYO-mediated antibiotic tolerance. On the other hand, the PYO level with 50 and 100 μg ml−1 gentamicin is lower than the untreated group, suggesting that the cell population started to decrease with the increase of the gentamicin dosage.

Figure 6.
Real-time monitoring of PA14 colony biofilm when gentamicin is added after biofilm formation.
The SWV curves of PA14 biofilm on LB agar with different gentamicin concentrations added on agar at  (the time biofilm is formed, ∼48 h post-seeding): (A) 1 μg ml−1, (B) 5 μg ml−1, (C) 10 μg ml−1, (D) 50 μg ml−1, and (E) 100 μg ml−1. (F) Normalized peak current (the first oxidation peaks in parts (A)-(E)) with respect to
Download figure:
Standard image High-resolution image
To better understand the relation between PYO level and bacterial population, we monitored the number of cells using the colony counting method. Two strains of P. aeruginosa were studied: PA14 and ATCC 9027, which according to our previous work, is a defective mutant and does not produce PYO on LB agar. 31 At different time points, LB agar with bacteria was dropped into 1 ml PBS, followed by ultrasonication to dislodge cells from agar. Fig. S10A and S10B compare the population of cells without gentamicin (control) and the biofilm treated with 1 μg ml−1 gentamicin for PA14 and ATCC 9027, respectively. The samples were first incubated for 48 h to form biofilms, followed by the addition of 1 μg ml−1 gentamicin. The results show that in both control and antibiotic-treated cells, the population of ATCC 9027 strain is lower than PA14. Consistent with our prior report, ATCC 9027 does not show PYO peak over time (see Fig. S11) and there was also no visible biofilm formed on agar, suggesting this strain is more susceptible to antibiotics compared with PA14. The higher antibiotic susceptibility of the PYO-lacking strain compared to PA14 is consistent with other works which report phenazines to promote antibiotic tolerance in P. aeruginosa. 20,48,49 The sensor results show a higher antibiotic tolerance of PA14 compared to the PYO-lacking strain as well as the increased antibiotic tolerance of biofilms compared to planktonic cells. These results are consistent with prior studies where they showed that the production of PYO promotes antibiotic resistance by regulating biofilm formation and/or upregulating pathways for efflux pumps to prevent drugs from reaching the cells. 17,47
Conclusions
In this study, gold-functionalized LIG-based flexible electrochemical sensors are developed for real time monitoring of response of P. aeruginosa colony biofilms to antibiotics based on the production dynamics of phenazines. The effect of the functionalization method was thoroughly studied to optimize the sensor performance. In particular, two facile approaches are investigated: electroless deposition (E-Au/LIG) and direct laser functionalization (L-Au/LIG). While sensitivity of both methods for detecting phenazines is similar, the biocompatibility of L-Au/LIG with bacteria makes it a suitable material for sensor fabrication for bacterial studies. We investigate the sensor performance for real time monitoring of P. aeruginosa colony biofilms under two different antibiotic treatments, i.e., when the antibiotic is added in the planktonic phase vs when added in the biofilm phase. By comparing the SWV peak currents over a long period of time (4 days), we show that the production rate of phenazines in P. aeruginosa biofilms depends on the antibiotic concentration. Specifically, our results confirm that PYO plays an essential role in developing antibiotic tolerance in P. aeruginosa. Au-functionalized LIG electrodes are manufactured using an all-direct laser writing process which is mask-less, simple, rapid, and offers a flexible sensor design compared with other carbon electrodes (such as glassy carbon electrodes) and the sensors in which the carbon material is modified with either drop-casting or electrodeposition. The sensor has the potential to be integrated into smart dressings in clinical applications, for example, for early detection of P. aeruginosa infection in wounds as well as obtaining real time bacterial viability information for timely treatment with antibiotics and prevention of the collective antibiotic tolerance.
Materials and Methods
Materials
Polyimide (PI) sheets are purchased from American Durafilm Co., Inc. (Kapton® HN, 500 mils). Pyocyanin (CAS: 85-66-5), gold (III) chloride solution (CAS: 16903-35-8), L-ascorbic acid (CAS: 50-81-7), sodium bisulfite (CAS: 7631-90-5), sodium thiosulfate (CAS: 7772-98-7), ampicillin (CAS: 7177-48-2), gentamicin (CAS: 1405-41-0), brain-heart infusion powder, and Lennox L agar are purchased from Sigma Aldrich. Phenazine-1-carboxylic acid (CAS: 2538-68-3) is purchased from Apollo Scientific. Nafion D-521 dispersion and the anhydrous ethanol (64-17-5) are purchased from VWR. Dragon Skin™ silicone rubber is bought from SmoothOn, Inc.
LIG fabrication and electrochemical functionalization
The LIG electrode pattern is designed in AutoCAD®, and then manufactured by the laser engraving machine (VSL2.30, Universal Laser Systems) using the processing parameter we previously reported. To create L-Au/LIG, after printing the LIG working electrode (WE), 5 μl of HAuCl4 solution is dropped on it and left for 10 min to dry. Then the gold nanoparticles are formed by an additional laser scribing step while the counter electrode (CE) and reference electrode (RE) are also being written/patterned.
For E-Au/LIG, the printed 3-electrode LIG is immersed in 0.6 wt% HAuCl4 in ethanol for 30 min, and then ascorbic acid is added to get to a final concentration of 1 mM, followed by an additional room temperature incubation for 1 h. The sensor area is separated from the contact pads using Dragon Skin silicone rubber to prevent liquid diffusion toward the contact pads. The RE is electrodeposited with silver on LIG with a constant current density of −150 μA/mm2 for 5 min in a solution containing 250 mM silver nitrate, 750 mM sodium thiosulfate, and 500 mM sodium bisulfite. The device is then triple-washed in ultrapure deionized (DI) water and dried. Finally, 5 μl of 2% Nafion in ethanol is dropped on the sensor with 30 s of spin-coating at 3000 rpm. The sensors are kept in a N2-filled desiccator prior to tests.
Characterization of the functionalized LIG electrodes
Scanning electron microscopy (SEM) micrographs are taken using a ThermoFisher Q250 instrument. Energy dispersive X-ray spectroscopy (EDS) measurements are taken using a 15 kV beam to ensure all relevant elements are detected. X-ray photoelectron spectroscopy (XPS) measurements are performed using a Physical Electronics VersaProbe II instrument with an Al Kα X-ray source (1.49 keV). Charge calibration is done using the sp2 carbon peak at 285 eV. Spectra are processed and analyzed with the CasaXPS software, and the program's instrumental relative sensitivity factors are used to calculate atomic percentages.
The LIG powder are scratched from LIG films to perform the XRD and BET measurements. For XRD tests, the samples powders are loaded into a silicon holder, and diffraction data are collected from 10 to 70° 2θ using a Malvern Panalytical Empyrean® diffractometer fitted with a copper (Kα1–2 = 1.540598/1.544426 Å) long-fine-focus tube operated at 45 kV and 40 mA. The incident beam path included iCore® optics fitted with a BBHD® optic with 0.03 radian Soller slits, a 14 mm primary beam mask, a 6 mm secondary beam mask, and a fixed 0.25° divergence slit. The diffracted beam path incorporated dCore® optics with a 0.25° fixed anti-scatter slit and 0.04 radian Soller slits. A PIXcel® detector is used in scanning line (1D) mode with an active length of 3.347°. Data is collected with a nominal step size of 0.026°.
The surface area measurement using the BET method is performed on a Tristar II Plus surface area/porosity analyzer (Micromeritics, GA, USA). Samples are first degassed on a Smart VacPrep (Micromeritics, GA, USA) degassing unit. The secondary degassing step is at 100 °C for 300 min. Samples are put on the instrument for an 18-point BET-specific surface area test using nitrogen as the absorbent. Equilibrium time was set at 20 s per point.
Electrochemical characterizations with synthetic phenazines
Stock solutions (2 mM PYO and 500 μM PCA) are first prepared in ethanol, then serially diluted to 100 nM, 1 μM, 5 μM, 10 μM, 50 μM, and 100 μM in BHI every time before the measurements. Electrochemical data is measured using a multi-channel potentiostat. (MultiPalmSens4, PalmSens) The sensor is attached to a Zero Insertion Force (ZIF) socket and connected to the potentiostat with Dupont wires. To benchmark the sensor, 100 μl solution containing the synthetic PYO or PCA is dropped on the sensors. SWV measurements are performed with a frequency of 15 Hz and potential range from −0.6 to 0 V after 3 min of holding (to reach equilibrium after depositing the solution on the sensor). Between different testing solutions, the samples are cleaned by pipetting a drop of deionized water, allowing it to sit for at least 10 s, then removed with a clean Kimwipe tissue.
Liquid chromatography-Mass spectrometry for identification of pyocyanin
The LC-MS data was acquired on a Thermo QExactive mass spectrometer with a Thermo Vanquish LC system. Mobile phases A and B were water containing 0.1% formic acid and acetonitrile containing 0.1% formic acid, respectively. The LC gradient was 0%–6% B in 5 min, followed by 7 min of high-organic wash and re-equilibration at 0% B. The flow rate was 0.3 ml min−1. The column was a Waters Acquity UPLC CSH C18 1.7 μm (micrometers), 2.1 × 100 mm. The column was maintained at 45 °C. The mass spectrometer acquired the data in an alternating polarity mode over 100–500 m z−1 with a resolving power of 70,000, AGC target of 106, and a maximum ion accumulation time of 200 ms for each polarity.
P. aeruginosa cultures and biofilm studies with antibiotics
P. aeruginosa strain PA14 (BEI Resources, NR-50573) and ATCC 9027 are cultured from frozen stock at −80 °C with lysogeny broth (LB, Lennox). The initial cultures are then streaked on LB agar and incubated to obtain single colonies. The overnight cultures are prepared by resuspending a single colony from the sub-streaked plate in LB and cultured overnight at 37 °C.
Next, cells from the overnight culture (∼1.4 × 10⁹ CFU/ml) are inoculated/seeded on an LB agar slab (diameter: 6 mm and thickness: 2 mm, punched using a sterile tissue puncher, Ted Pella Inc.) and placed on the sensor. The initial cell seeding density is 5,000 CFU/mm2. The sensors with P. aeruginosa-seeded agar slabs are then placed in a custom-made incubator (37 °C, 90% humidity). The electrochemical measurements are performed using a script to control MultiPalmSens4 at specific time points after starting the inoculation. For studies with antibiotics added at the planktonic stage, LB agar is mixed with antibiotics (with the desired concentration as noted in the Results and Discussion Section) after sterilization in an autoclave while the liquid is still warm enough (before agar solidifies). For studies with antibiotics added at the biofilm stage, after ∼48 h of incubation of the seeded cells (on antibiotic-free LB agar) in the humidity chamber, 5 μl of antibiotics with the desired concentration is dropped over the biofilm and monitoring continues.
To estimate the population of the colonies in Fig. S8, agar samples are prepared following the same method discussed for the electrochemical measurements. At different times, the agar sample is transferred into a microcentrifuge tube containing 1 ml PBS. After vertexing and ultrasonicating for 2 min, the suspension is diluted 10-fold and 100 μl suspension is inoculated on LB agar. Inoculated plates are then incubated at 37 °C for 16–20 h and colonies are counted to determine the CFU/ml at each time point. All experiments were completed using three replicates and average values are plotted. For example, at  1:1000 dilution of PA14 agar slab yields 12.3 colonies on average, the final cell population is
Studying the toxicity effect of Au-functioned LIG on bacterial cells
The L-Au/LIG and E-Au/LIG samples are first patterned into squares of 10 mm x 10 mm, followed by coating with Nafion. To estimate the impact of Nafion, uncoated samples are also prepared. All samples are attached with double-sided adhesive tape to a sterile glass slide and put inside a 6-well plate. After sterilization with UV irradiation for 30 min, 25 μl of 1:10 diluted overnight culture is added to each sample. After 2 h and 4 h, the samples are transferred to a vial containing 1 ml PBS and sonicated for 1 min to transfer cells to the solution. Then the solution is diluted and spread on LB agar plates (10 cm diameter), followed by overnight incubation at 37 °C in order to quantify viable colonies.
Acknowledgments
We thank the Center for Biodevices for the Riess Graduate Fellowship awarded to K. Z. and V. K. and the start-up funding to A.E. by the Pennsylvania State University, as well as partial support from the National Science Foundation (NSF: I/UCRC Phase II: award #2113864) and the National Institutes of Health (NIH, award# R21EB031354 and R21GM132793). The content of this report is solely the responsibility of the authors and does not necessarily represent the official views of NSF or NIH. The PA14 strain (NR-50573) was obtained through BEI Resources, NIH: National Institute of Allergy and Infectious Diseases (NIAID). The authors thank Dr. Nichole M. Wonderling and Gino Tambourine at the Materials Characterization Lab (MCL, Penn State University) for their help with XRD and BET measurements and analyses. The authors also thank Dr. Tatiana Laremore of the Huck Proteomics and Mass Spectrometry Core Facility for the LC-MS data acquisition and helpful discussions.
Supplementary data (3.6 MB DOCX)