
Abstract
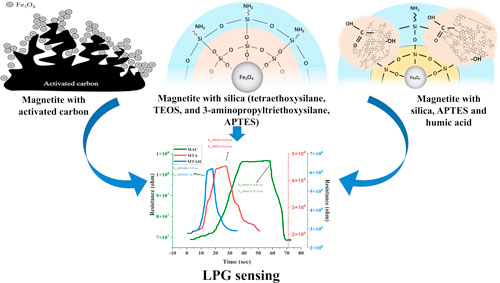
The present work focuses on the synthesis of Fe3O4 magnetite core@shell type nanoparticles modified with three types of ligands: Magnetite with activated carbon (MAC), Magnetite with silica (tetraethoxysilane, TEOS, and 3-aminopropyltriethoxysilane, APTES) (MTA) and Magnetite with silica, APTES and humic acids (MTAH). The MTAH sample shows greater porosity in comparison to MTA, and MAC samples. The band gap of MTAH is 4.08 eV, which is higher than MTA (2.92 eV), and MAC (2.80 eV). Rietveld quantitative phase analysis of all derivatives was performed and compared with all three samples. The LPG sensing at room temperature shows the highest sensor response of 9.42, in comparison to 3.87 sensor response for MAC, and 4.60 for MTA. This approximately double sensor response increment is justified with the help of band gap, porosity, and size of all 3 the samples. The MTAH sample shows the lowest response-recovery time of 9.33 and 10.78 s respectively in comparison to MAC and MTA samples. In conclusion, this manuscript describes the synthesis procedure of different derivatives of Fe3O4 core@shell materials along with the relation of LPG sensing with different parameters of the materials.
Highlights
Fe3O4 based magnetite core@shell type nanomaterials were synthesized using sol-gel method.
Comparative analysis of different derivatives of magnetite materials was carried out.
Application as resistive LPG sensing and proportional analysis was performed.
Effect of size, porosity, and band gap on LPG sensing were analyzed.
Rietveld quantitative phase analysis of all derivatives was performed and compared.
Export citation and abstract BibTeX RIS

This is an open access article distributed under the terms of the Creative Commons Attribution 4.0 License (CC BY, http://creativecommons.org/licenses/by/4.0/), which permits unrestricted reuse of the work in any medium, provided the original work is properly cited.
Iron oxide has a unique property to be considered as an outstanding metal oxide semiconductor for gas detection due to its existence in three main forms FeO, Fe2O3, and Fe3O4, depending on their crystal structure and geometry. 1–4 The α-Fe2O3 has long been known as a sensitive material in the manufacture of gas sensors for the detection of H2, 5 LPG, 6 CO, 7 NO2, 8 H2S, 9 O2, 10 and ethanol. 11,12 demonstrated that polyaniline/γ-iron oxide (PANi/γ-Fe2O3) nanocomposite films have excellent LPG sensitivity at room temperature, the nano-sized composites provide a large surface area for gas molecule adsorption resulting in improved gas permeability and sensitivity. Also, more complex iron compounds have been studied as LPG sensors. So, Goutham et al. 13 showed that Mg(x)Fe(1−x)2O4 (x = 0.5) exhibited the highest sensitivity at 90 °C for 500 ppm LPG at 1 V applied compared to commercially available gas sensors. Bhaduri et al. 14 revealed that Ni0.4Zn0.6Fe2O4 (NZF) can be a highly sensitive LPG sensor that can effectively detect LPG below the lower explosive limit (LEL). According to Singh et al., 15 Nanocrystalline neodymium iron oxide (NdFeO3) has superior LPG sensing properties in comparison to the pellet sensor.
According to various studies, parameters such as morphology, size, surface area, and porosity of iron oxide nanostructures can significantly affect the sensitivity of the sensor. 16–18 Biocompatibility, outstanding stability, low toxicity, and exceptional magnetic characteristics make nanosized Fe3O4 the most promising metal oxide for sensor research. 19,20 It is reported that the catalytic activity of Fe3O4 can be affected by the size and shape of the particles. 21,22 However, practical applications have shown that aggregation due to their low melting point and high cohesive energy hinder the stability and selectivity of metal nanoparticles. 23,24 From a practical point of view, these disadvantages can be overcome by impregnating various porous materials, such as zeolite, 25,26 carbon, 27 silica, 19 and metal-organic frameworks (MOFs). 20,21 The porous structure of these materials can prevent the aggregation of metal nanoparticles and affect their size, which in turn increases the catalytic activity and size selectivity of the reagents. 22 To obtain nanoparticles with uniform size distribution and, consequently, with a reduced number of active OH– adsorption centres, a stabilizer or an additive was added during the synthesis. 28–30 An increase of active sites of Fe3O4 for OH– adsorption can be used with the combination of activated carbon or silica or silica and humic acids and Fe3O4 because they have a high surface area or/and rich functional groups. 31–33 Functionalization of activated carbon using Fe3O4 nanoparticles increases electrocatalytic activity, enhances the ability to transfer electrons, improves magnetic properties, and also prevents the aggregation of iron oxide nanoparticles. 34–36
In the present study, experiments were carried out for a selective LPG sensor based on core@shell type Fe3O4 nanoparticles. There is hardly any report on LPG sensor based on Fe3O4 nanoparticles. The Fe3O4 nanoparticles were modified with three types of ligands: activated carbon, silica (tetraethoxysilane, TEOS, and 3-aminopropyltriethoxysilane, APTES), and silica plus humic acids. The sensitivity characteristics of magnetite nanoparticles functionalized with various LPG ligands were systematically investigated.
Materials and Methods
Preparation of the Fe3O4 MNPs
The bare Fe3O4 magnetic nanoparticles (MNPs) were prepared by the coprecipitation of Fe (II, III) salts in the base solution. Briefly, 29.15 g of FeCl3 6H2O and 10.7 g of FeCl24H2O were dissolved in 1 L deionized H2O, then added to 190 ml of 10% solution of NaOH (pH = 10) at 60 °C with vigorous stirring at 600 rpm. The resulting Fe3O4 nanoparticles were washed three times with deionized water to remove impurities from the synthesis. The molar ratio of Fe(III) and Fe(II) salts is equal to 2:1. This ratio corresponds to the ratio of Fe(III): Fe(II) ions in the magnetite Fe3O4. According to the stoichiometry, the amount of sodium hydroxide is 0.4 mol.

To carry out the reaction, a 1.25 molar excess of NaOH is taken in order to increase the quantitative yield of the reaction.
Preparation of the magnetic activated carbon (MAC) sample
A 1:4 suspension of activated carbon (Fe3O4:AC, where AC is activated carbon) was added to the precipitate of the resulting Fe3O4 nanoparticles. The resulting suspension was shaken on a rotary shaker (200 rpm) at 25 °C for 24 h (Fig. 1c).

Figure 1. Principal schemes of the structure of synthesized samples (a) MTA, (b) MTAH, (c) MAC.
Download figure:
Standard image High-resolution imagePreparation of the magnetite-TEOS-APTES (MTA)
9 g of Fe3O4, 57.6 ml of TEOS, and 14.4 ml of APTES were mixed in 1 L of distilled H2O and the mixture was shaken on a stirrer (1000 rpm, 60 min), pH = 10. The solution was washed with distilled water (pH = 7) and centrifuged (15 min 3000 rpm). The sample was dried in an oven (T = 50 °С, 24 h) (Fig. 1a).
Preparation of the magnetite-TEOS-APTES-Humic acids (MTAH)
9 g of Fe3O4, 57.6 ml of TEOS and 14.4 ml of APTES, and 0.3 g of HA were mixed in 1 l of distilled H2O, 1 g of HA was added and shaken on a stirrer (1000 rpm, 45 min). The solution was washed with distilled water (pH = 7) and centrifuged (15 min 3000 rpm). The sample was dried in an oven (T = 50 °С, 24 h) (Fig. 1b).
The characterization of samples
The phase composition and primary particle size of the samples were determined by X-ray phase analysis (XPA) on a Philips X-pert diffractometer (Philips Analytical, Eindhoven, The Netherlands, CrKα radiation, λ = 2.29106 Å). The experimental data were smoothed with the well-known algorithm by A. Savitzky and M.J.E. Golay [described in Ref. 37, corrected by Steinier, Termonia, and Deltour in Ref. 38 was used. The measurements were performed at room temperature in the angular range of 10° < 2Θ < 110° with 0.025° resolution and exposure 1 s.
Quantitative analysis was performed by refinement of the total multiphase spectrum method (the Rietveld method) with a fundamental parameters approach, 39 using the Math!3 software. A fixed Kα emission profile of seven lines was adopted plus an intensity-refined Kβ emission profile. Particle size was determined using the Scherrer equation using full width at half maximum (FWHM) 40 using Match!3 software. The surface morphology of all three samples was analyzed by scanning electron microscopy (JEOL JSM-6490 LV).
Microstructure Investigation
Characterization by XRD
The diffraction patterns of the samples MTA and MTAH contain six intense and broadened diffraction reflections, slightly differing in position and varying greatly in width and height (Fig. 2) with Miller indexes: (202, ∼45°), (311, ∼54°), (400, ∼66°), (422, ∼84°), (511, ∼90°), (404, ∼101°). The diffractogram of the magnetite-activated carbon sample contains the same peaks that differ significantly in width from the samples of magnetite-silica and magnetite-silica in the humic acid shell. In this case, the MAC sample contains only two broad groups of peaks: (311, ∼54.1°) and (440, ∼101.8°), which probably indicates a strong oxidation of magnetite to another species of iron oxide—maghemite during functionalization or its low concentration.
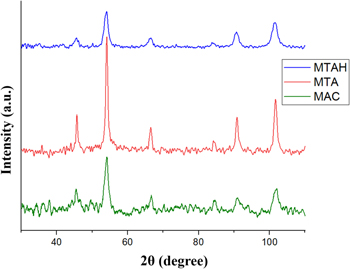
Figure 2. XRD of samples MTAH, MTA, and MAC.
Download figure:
Standard image High-resolution imageThe quantitative analysis by the Rietveld method shows all diffractograms can be interpreted as a face-centred cubic (Fd3m) lattice. The lattice parameter a for the magnetic nanoparticles has been calculated. Table I shows the unit cell parameters of each sample, the compounds, and χ2, which is used as a Rietveld error indices and can be determined from the expected and weighted profile R factors χ2 = (RWP/Rexp)2 ratio. 41 According to, 41 the value of χ2 close to 1 is suggested to be satisfactory. The fit for all samples is excellent, both from the χ2 and from visual inspection of measured and calculated patterns, and the residue (Fig. 1).
Table I. Rietveld quantitative phase analysis and magnetite stoichiometry (δ).
| Sample | MTA | MTAH | MAC |
|---|---|---|---|
| a, Å | 8.3689 ± 0.0005 | 8.3665 ± 0.0002 | 8.3482 ± 0.0003 |
| χ2 | 1.2 | 1.1 | 1.5 |
| δ | 0.13 | 0.14 | 0.265 |
| Compound Fe3−δ O4 | Fe2.86O4 | Fe2.85O4 | Fe2.73O4 |
| XRD size, nm | 18.4 ± 0.1 | 10.2 ± 0.4 | 9.4 ± 0.3 |
The preparation and functionalization of magnetite NPs could lead to their partial oxidation, which can be determined by comparing the diffraction patterns for the obtained samples with the reference ones. The lattice parameters for modified magnetite nanoparticles are smaller than the same for bare magnetite [JCPDS-ICDD 19-629] but larger than for maghemite [JCPDS-ICDD 39–1346]. This phenomenon is explained by the partial oxidation of iron ions (II) during functionalization due to an additional oxidative effect on Fe3O4 by oxidizing Fe2+ to Fe3+ by quinoid groups 42 and phenolic moieties 43 of humic acids, for example, during the synthesis in situ ("the one pot"), which correlates with the results of electron-paramagnetic resonance spectroscopy, 43 showed a direct relationship between the concentration of free radicals in HS and the amount of Fe (III) reduced by them. 44 Functionalization with activated carbon to a greater extent leads to the oxidation of magnetite nanoparticles due to the oxidation by the OH-group of activated carbon.
The change of the lattice parameters indicates the formation of nonstoichiometric magnetite Fe3−δ O4 with Fe2+/Fe3+ ratio from 0 for Fe2O3 to ½ for Fe3O4 due to partial oxidation of Fe2+ during drying, functionalization, and oxidation. According to Gorski, 45 stoichiometry can easily be converted to the following relationship.

The value of the unit cell parameter obtained by Rietveld's refinement and expression (1) makes it easy to calculate the compound Fe3−δ O4 (Table I), which shows a decrease of the content of stoichiometric magnetite to Fe2.86O4, Fe2.85O4, and Fe2.73O4 after silica, , and HA and activated carbon functionalization, respectively.
The coherent-scattering region size was derived from powder XRD data by Scherrer's method (Table I). Functionalization with silica and humic acids leads to a decrease in particle size, in contrast to functionalization of only silica due to the presence of two types of ligands in the nucleation stage.
Surface morphological investigation
The surface morphology of all three samples was analyzed by scanning electron microscopy (JEOL JSM-6490 LV). It is clearly visible from Figs. 3a–3d that the surface morphology of all three core–shell type magnetite samples were different and their porosity and particle sizes are also different. Figure 3a shows the SEM micrograph of MAC in which very pure porosity was observed. The particles have a bigger grain size along with irregular grain morphology. Figure 3b displays the SEM micrograph of MTA in which better porosity than MAC was observed, however, the particles have bigger grain sizes along with irregular grain morphology. Figures 3c and 3d demonstrate the surface morphology of sample MTAH. In which higher porosity is clearly visible. Also, particles are nearly spherical in shape with a minimum particle size of ∼74.44 nm, probably due to the encapsulation of magnetite nanoparticles in the shell of humic acids and silicaat the nucleation stage, which prevents the growth or aggregation of nanoparticles. By visualizing the surface morphology of all three samples, it is very easy to predict that sample MTAH will show higher reactivity to exposed gas because of its smaller particle size (hence higher surface-to-volume ratio) and larger pore size.
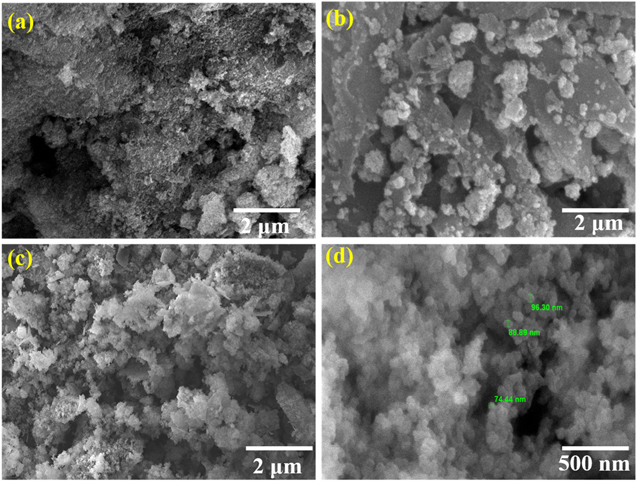
Figure 3. SEM analysis of (a) MAC, (b) MTA, (c) MTAH, and (d) higher resolution image of MTAH.
Download figure:
Standard image High-resolution imageFTIR analysis
The FTIR spectra of MTAH, MTA and MAC nanoparticles are compared in Fig. 4. FTIR spectrum of MTAH and MTA exhibits infrared absorption bands at 500 cm−1, which can be assigned to the Fe–O–Si stretching mode. 46 The three common bonds between 500 and 760 cm−1 observed on MTAH and MTA can be ascribed to the stretching and deformation vibrations of Si–O, reflecting the coating of silica on the magnetite surface. Surface modification with TEOS and APTES is a complex process as it involves many different intermediates. 47 The FTIR spectra showed the wide and intensive band at ∼1100 cm−1 of MTA and MTAH which can be attributed to a superposition of the silanol (Si–O–H) and siloxane (Si–O–Si) groups, confirming the adsorption of APTES on MNP surface. At the same time, the Si–OH group band appeared at 960 cm−1 as a shoulder at the Si–O–Si skeletal band and was slightly weaker in intensity than ever found in ordinary Stober silica particles, which showed a well-defined peak of Si groups –OH. 48 The common band of MTA and MTAH at 1543 cm−1 was assigned to the δNH groups of −NH2, both of which can be attributed to being present in the APTES structure. Also, the peak at 1640 cm−1 for both MNPs was assigned to adsorbed water, and the broad peak centred at about 3400 cm−1 was assigned to νO–H for adsorbed water or νN–H of the amino group.
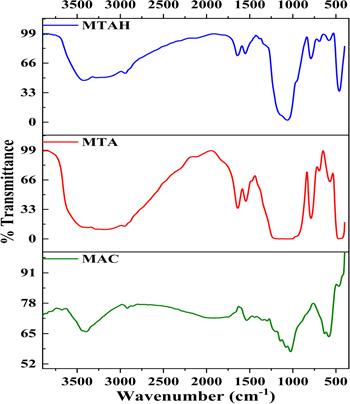
Figure 4. Stacked FTIR-spectra of MTAH, MTA and MAC.
Download figure:
Standard image High-resolution imageIn the spectra of the obtained MAC nanoparticles, a peak of the characteristic vibration band of the carbonyl group (νСО = 1725–1680 cm–1) is observed. At the same time, bands corresponding to symmetric (νsCOO = 1420–1360 cm–1) and asymmetric (νasCOO = 1610–1550 cm–1) vibrations of carboxylate ions appear in the spectra (Fig. 3). The interaction of iron ions is reflected in the bands for carbonyl groups: aliphatic (1100 cm–1) and aromatic (1300 cm–1, shoulder of 1100 cm−1) present in phenolic and quinoid compounds in activated carbons.
UV-spectroscopy characterization
Band gap analysis through UV-Visible spectroscopy is shown in Fig. 5. The band gap analysis is very important in the case of sensors. 1,2 This is well known that when the band gap of material is increased, this shows the reduction in the size of particles. As the particle size reduces, the corresponding surface-to-volume ratio increases, which increases surface reactivity. 1,2 This can be visualized from Figs. 5b–5d that band gap increases from 2.80 eV to 2.92 eV and then 4.08 eV for MAC, MTA, and MTAH samples. From SEM images in Fig. 3, it can be seen that MTAH is in nano-dimension, which can be used as a sensing material. This is the reason for high sensitivity of MTAH than the other two samples, which is discussed in detail later.
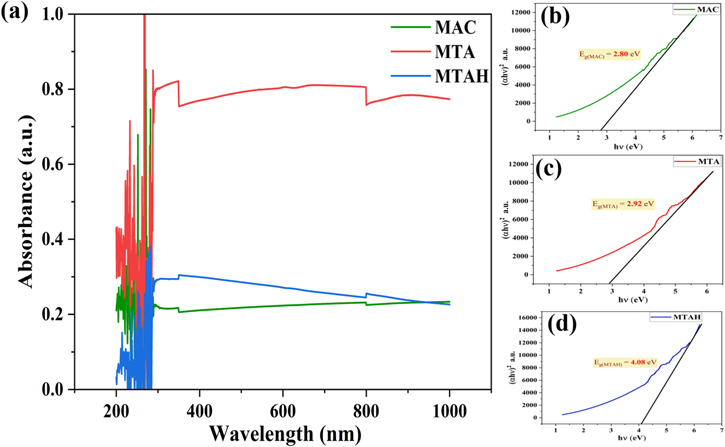
Figure 5. (a) UV-Visible spectroscopy of MAC, MTA, and MTAH with (b)–(d) their Tauc Plot.
Download figure:
Standard image High-resolution imageIt is known that the band gap of semiconductors often depends on the particle size. And in our case, indeed, with a decrease in the particle size of magnetite-based composites in the MAC-MTA-MTAH series, in accordance with the SEM data, the value of the band gap increases.
Sensing Mechanism and Characteristics
A schematic picture of the complete LPG detection unit is visualized in Fig. 6. The LPG contains butane (C4H10) and propane (C3H8) mostly. 49,50 The least explosion limit (LEL) of LPG is recognized as the lowest concentration of an LPG in an exposed environment that can cause fire straightaway in the existence of any ignition source.

Figure 6. Schematic diagram of LPG sensing unit.
Download figure:
Standard image High-resolution imageDifferent protection and health establishments (e.g. OSHA, NIOSH etc.), marked 1.8 vol% for C4H10 and 2.2 vol% for C3H8 as an LEL limit, which is quite low and cause fire accidents. This is the foremost motive to produce sensing materials, which are exceedingly reactive below LEL at room temperature.
The reaction of desired gas at the outermost exterior of the material administrates the response of the sensing film towards the exposed gas i.e. adsorption properties which are chemical in nature occurs at the outermost layer of the sensing element. 51 When a material is core@shell in nature; the following two phenomenons affect the sensing performance of the film:
1. Nature and reactivity of the shell material, and 2. The junction between the core and shell. Upon film's introduction in the air, the O2 molecules chemically adsorbed on the outer surface, which is shell material. The higher the number of surface electrons at room temperature, the higher will be adsorption. 14 Due to the synergetic effect of both materials, electron transfer occurs between conduction bands of the core to shell material. 52 By adsorption O2 molecules form oxygen ionic molecules. The chemisorption frequency is subjected to particle size, vacancies in the outer layer, dangling bonds, carrier concentration etc. There are two types of reaction that occur, which is based on operating temperature:


Thus, at a functioning temperature lesser than 200 °C, the O2 molecule present in the atmosphere obtains an e─ from the external surface of the shell and is chemically adsorbed on the film exterior by creating an O2 ─ ion. 52 These adsorbed ions produce a coating of O2 ─ ions on the shell surface, which react with the exposed LPG. This adsorption process upsurges the potential barricade height, which confines the motion of electrons across the shell surface. This incident boosts the material resistance of the film in air (Ra). After the introduction of LPG within the sensing section, the component of hydrocarbons reacts with the enormously responsive chemisorbed O2 ─ ions:

The recombination of free electrons formed via above Eq. 4 and the holes existing on the shell exterior lowers the total amount of the charge transporters. By this, the potential barricade of the sensing component increases, thus, raising the net resistance of the detection film. The resistance boosts as the rate of reaction intensifies because of the growth in net gas pressure of LPG in the detection chamber. A stable net resistance is attained when all reactions are completed.
Now all three films of Magnetite activated carbon (MAC), Magnetite/TEOS/APTES (MTA), and Magnetite/TEOS/APTES/Humate (MTAH) were exposed to LPG at different concentrations of 0.5, 1.0, 1.5 and 2.0 vol%, which is shown in Fig. 7. All the sensing experiments were performed under 37 °C temperature and 56% humidity condition. When all three samples were exposed to air, the different resistances in the air (Ra) were observed due to their different shell compositions. MAC, MTA, and MTAH show the Ra value at 68946227 Ω, 211771364 Ω, and 276143748 Ω respectively. When film resistance was stabilized then LPG gas of different concentrations (0.5, 1.0, 1.5. 2.0 vol%) were dropped onto the sample. The corresponding output resistance curves were shown in Figs. 7a–7c. Very important parameters like sensor response, and response-recovery times were calculated and tabulated in Table II.

Figure 7. Change in resistance on exposure of LPG in (a) MAC, (b) MTA, (c) MTAH, and (d) comparison of minimum response and recovery time of all samples at 0.5 vol% concentration of LPG.
Download figure:
Standard image High-resolution imageTable II. Maximum Sensor response, minimum recovery time and response time of all 3 samples.
| S. No. | Sample name | Maximum sensor response (Rg/Ra) | Minimum response time (s) | Minimum recovery time (s) |
|---|---|---|---|---|
| 1. | MAC | 3.87 | 22.87 | 27.23 |
| 2. | MTA | 4.60 | 12.91 | 21.23 |
| 3. | MTAH | 9.42 | 9.33 | 10.78 |
The sensor response (SR) is given by Eq. 5.

The response and recovery times are demarcated as the time taken by a sensor to reach up to 90% of the maximum output value. 53 From Table II we can see that the sample MTAH shows a very high sensor response of 9.42 with response and recovery time of 9.33 s and 10.78 s. Figure 7d displays the comparison of response and recovery times of all three samples at 0.5 vol% LPG concentration.
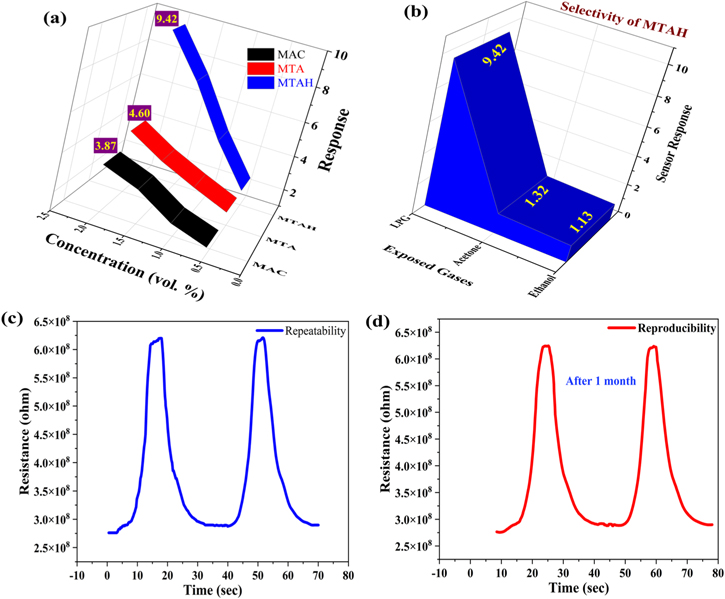
Fig. 8a denotes the sensor response at different LPG concentrations of MAC, MTA and MTAH. Selectivity is demarcated as the recognition of desired gas in the existence of different gases i.e. when a gas sensor is extremely selective then it only senses the mandatory desired gas. For this best responsive sample, MTAH was exposed to other volatile gases like Acetone and Ethanol. It can be visualized from Fig. 8b that MTAH is highly selective. The repeatability and reproducibility (after 1 month) of the resistance curve at 0.5 vol% (MTAH sample) were performed and shown in Figs. 8c and 8d respectively. It is clearly visible that the MTAH resistance curve is almost similar even after 1 month.
Figure 8. (a) Response vs LPG concentration, (b) Selectivity, (c) Repeatability, and (d) reproducibility.
Download figure:
Standard image High-resolution image
Conclusions
In conclusion, this manuscript describes the synthesis procedure of different derivatives of Fe3O4 core@shell materials. Their size and porosity relation with the sensing property is also discussed thoroughly in this paper. The MTAH sample in SEM analysis shows the highest porosity than MTA, and MAC, and hence MTAH possess the highest sensitivity towards LPG. The band gap of MTAH is 4.08 eV, which is higher than MTA (2.92 eV), and MAC (2.80 eV). LPG sensor response of MTAH film is 9.42, which is far better than MAC (3.87), and MTA (4.60). In conclusion, this research paper explains the effect of band gap, size, and porosity on LPG sensing performance and is better than previously reported iron oxide papers. 54–57
Acknowledgments
This work has been carried out in accordance with the state tasks, state registration AAAAA19119032690060-9 (by G.D. and G.K.) The study of UV spectra was supported by a grant from the President of the Russian Federation MK-398.2022.4. (by A.B.) Author Contributions: Shakti Singh: Sensing, characterization and writing, All Authors Contributions: Methodology and conceptualization, G.D.; investigation (IR, XRD), GK; Bal Chandra Yadav: Methodology and conceptualization and supervision. All authors have read and agreed to the published version of the manuscript. The authors declare that no funds, grants, or other support were received during the preparation of this manuscript.
Competing Interests
The authors have no relevant financial or non-financial interests to disclose. Data availability. The datasets generated during and/or analyzed during the current study are available from the corresponding author on reasonable request.
Supplementary data (1.2 MB DOCX)