
Abstract
Interleukin-31 has been reported to be involved with chronic skin conditions like atopic dermatitis (AD). This work focuses on the development of a portable IL-31 detection system that works with passive sweat over the physiologically relevant range-150–620 pg ml−1. Four simulated flaring profiles were used to benchmark the IL-31 rise and fall detection capabilities of the sensor. These temporal profiles were generated according to the SCORAD range for severity of AD and were spanned across different dosing regimens. The sensing platform displays good sensitivity with a limit of detection of 50 pg ml−1 and dynamic range of 50–750 pg ml−1 for the flaring profiles in synthetic and human sweat, and with coupled portable electronics. Furthermore, in order to create a robust and predictive system, a machine learning algorithm was incorporated to create a flare prediction system. This algorithm shows high accuracy for the test data sets and provides the proof-of-concept for the use of ml coupled electrochemical systems for chronic diseases like AD.
Export citation and abstract BibTeX RIS

This is an open access article distributed under the terms of the Creative Commons Attribution 4.0 License (CC BY, http://creativecommons.org/licenses/by/4.0/), which permits unrestricted reuse of the work in any medium, provided the original work is properly cited.
Interleukin-31 (IL-31) is a T-cell derived cytokine that is associated with pro-inflammatory pathways. IL-31 belongs to the class of IL-6 cytokine family and has been reported to be involved with autoimmune skin conditions. 1 Atopic dermatitis (AD) is one such example of a chronic inflammatory skin condition that is characterized by cutaneous hyperreactivity to triggers. It presents a complex etiology because of the involvement of numerous immunologic and inflammatory pathways. Skin biopsies highlight elevation of IL-31 in AD patients, that is often connected to appearance of eczematous flares or lesions. 2 The onset of acute AD lesions is reported to be associated with an increased gene expression of TH 2-defining cytokines, for e.g., the largest quantitative gene expression is associated with IL-31. In addition to this, chronic lesions are also characterized by significant increase in IL-31. 3 Thus, IL-31 is associated with disease severity in patients suffering from AD and can be effectively used to characterize the flare profile for the patient. The pathogenesis of AD through IL-31 contributed flare is described in Fig. 1a. As discussed earlier, IL-31 originates from TH2 helper cells, which are recruited from the circulating dendritic and memory T cells. These TH2 helper cells then secrete IL-31. This biomarker contributes to various pro-inflammatory/barrier disruptive events as shown with e1, e2, e3, and e4 in Fig. 1a. From the figure, it is evident that there is often a complex interplay of different pathways that alter the epidermal barrier and create an itch stimulus. IL-31 receptors are also expressed by several cells such as macrophages, basophil, eosinophil, and mast cells, which are responsible for increasing inflammation 1,4 (Figs. 1a, e1). The phenomenon of secretion of pro-inflammatory cytokines by these cells was significantly upregulated with the stimulation of IL-31. 5 Increased expression of IL-31 also contributes to severe pruritus that leads to a vicious cycle of the scratch-itch stimulus phenomenon. This in-turn leads to increased disruption of the skin barrier, thus, exacerbating the epidermal layer deterioration that is caused by decreased filaggrin (critical to skin barrier maintenance and keratinocyte differentiation). 5 However, there is a need for further elucidation of the mechanistic pathways associated with filaggrin gene and inflammation. 6 Reports have suggested that IL-31 promotes sensitivity to minimal stimulus by contributing to increased neuronal growth and nerve elongation. 5,7 Increased expression of the TH2 cytokines leads to increased expression of chemokines (Figs. 1a, e4). These chemokines affect the epidermal barrier by protein expression suppression. The epidermis has an outermost protective layer of proteins and lipids that prevents dryness by reducing transepidermal water loss (TEWL). The damage to the epidermal barrier is increased by depletion of natural moisturizing factors, along with long-chain ceramides and fatty acids. Due to the decreased production of anti-microbial peptides, there is an increase in Staphylococcus aureus infection at scratched sites. Atopic flares are often accompanied by an abundance of S. aureus colonies on the surface that might also be a contributing factor to disease severity. 8
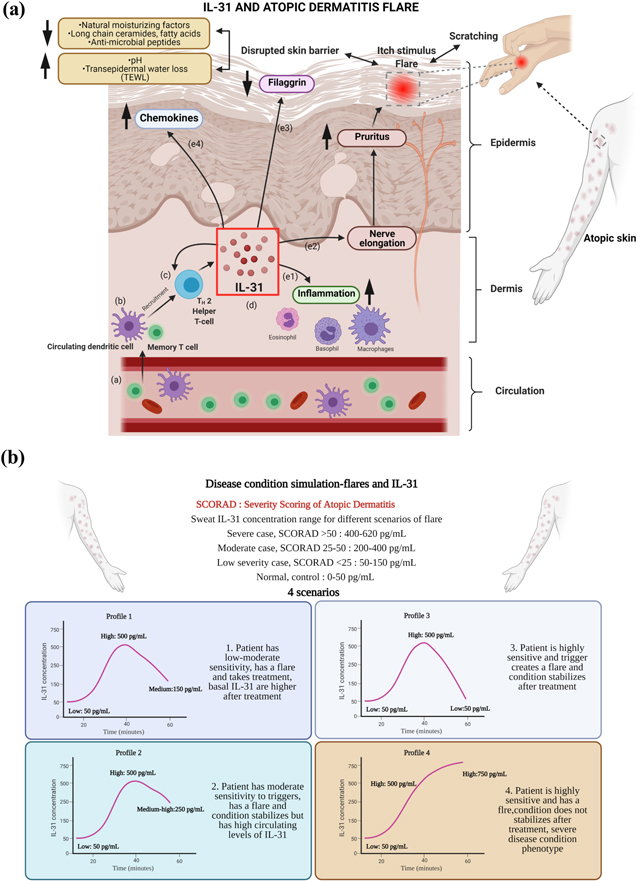
Figure 1. (a) Schematic explaining the secretion of IL-31 and its relationship with Atopic Dermatitis flaring, and (b) Four temporal flaring profiles for simulating conditions according to severity of Atopic Dermatitis (AD), created in Biorender.com with the help of Refs. 3, 5, 8.
Download figure:
Standard image High-resolution imageThe key involvement of IL-31 in pruritus has led to it becoming a potential therapeutic target for AD and several other pruritic diseases. In the study by Hawro et al., patients suffering from moderate to severe pruritus reported significant loss in quality of living, work productivity, and mental health. They were also reported to be under severe mental stress with increased cases of depression and anxiety and in some cases, suicidal ideations were observed. 9 In addition to this, chronic pruritus has been rated to be as debilitating as chronic pain and plays a negative role in daily routines. Current anti-pruritic plans are reported to be ineffective and there is a need for new therapeutic approaches for pruritic diseases. 7 As discussed earlier, IL-31 levels correlate with severity of AD. Thus, this biomarker can serve as a potential target for tracking disease progression in a non-invasive manner. It also has a potential use in creating a personalized treatment approach as targeting IL-31 pathways has been found to reduce scratching in patients. 10 Thus, tracking IL-31 offers a promising approach in efficient disease management and improved prognosis of AD.
The current state of healthcare, specifically dermatology helps with the accurate diagnosis of AD. However, the problem lies in assessment of disease severity over time. Another gap includes guidelines for treatments based on disease severity, as it often needs a deeper understanding of disease burden over time e.g., persistent, frequently recurring, or remission. There are several scoring systems in place that can help with the understanding of flaring, however they cannot distinguish between patient with intermittent flares vs one with rapid recurring flares. 11 For addressing these problems, the solution of real time tracking of IL-31 seems to be an attractive approach. IL-31 is expressed in eccrine sweat in the physiological level of 150–620 pg ml−. 12 Over the last decade, sweat-based tracking of biomarkers has gained significant traction. Some of these examples include recent reports on tracking molecules like cortisol/DHEA, 13 glucose, 14,15 electrolytes, 16 and cytokines 17 in eccrine sweat for health and lifestyle management. Sweat biomarker detection is a non-invasive way of monitoring real time secretion of molecules. It offers a convenient platform for performing point-of-need biosensing for health monitoring and chronic disease management. In addition to this sweat biomarker levels have been reported to be correlated with biomarker levels in gold standard biofluids (e.g., blood, serum). 18 Sweat based sensing technologies work either with stimulation-based sampling or with passive sampling. The former technique uses iontophoresis, which includes using pilocarpine for induction of sweat and a macroduct for collection of sweat. A small current (1.5 mA) is applied to the skin surface and it usually generates 200–250 μl of sweat after each stimulation. 19 Passive sampling ensures that the user does not have to generate a sample, it is collected on to the sensing platform passively. This work uses passive eccrine sweat based sampling, and it works with ultralow volumes of sample, i.e., 10 μl. Adult AD patients have reported to show a significant decrease in sweat volume production. 20 Also, using iontophoretic stimulation for sweat generation has a potential of aggravating the current flaring condition of the user. Thus, passive sweat based methods are ideal for developing wearable flare tracking platforms. The work described here uses a novel sensor stack fabricated using a nanoporous polyamide substrate along with serpentine gold electrodes. The sensor stack utilizes an inert porous medical gauze base layer that isolates the sensor surface from the skin and adds hybrid porosity to the sensor platform. This design improves the sensitivity of the platform while providing comfort at the same time. A schematic along with the sensor layer split up is provided in Fig. S1 (available online at stacks.iop.org/ECSSP/1/031602/mmedia). This also ensures that the sensor substrate is able to work with low volumes of sweat that are often associated with AD patients. Also, most importantly, it provides comfort and reduces any epidermal irritation associated with patches. This is of prime importance while designing passive sweat based wearable system for tracking skin related chronic conditions. This platform also attempts at solving the problem of non-compliance often associated with pediatric or geriatric population, which is due to the discomfort of traditional sampling for sweat sensing.
The work in this paper uses a modified SLOCK (Sensor for circadian clock) 19,21 sensing platform that is tuned to perform detection of IL-31 in sweat, as shown in Fig. S1. This serpentine gold-electrode based sensor displays good mechanical resiliency against wearable form factor contributed motion artifacts. 21 The system uses affinity-based sensing for performing detection of the biomarker using an antibody-based system. This affinity-based sensing chemistry was previously characterized using FTIR, SPR, and impedance analysis. 19,22 This confirmed the successful functionalization of immunochemistry on the electrode surface. Non-faradaic electrochemical impedance spectroscopy (EIS) is used as the detection modality in this work. The advantage of using non-faradaic EIS is that a labelling probe is not needed to perform detection, making it truly a "label-free" platform. Also, it ensures easy integration with portable electronics for wearable applications. Furthermore, some of the other advantages include lower detection limits, wider dynamic range, simpler fabrication, and cost-effectiveness. 23 This work presents a portable IL-31 detection system that uses a nanoporous substrate that is highly sensitive to the physiological range of IL-31 in sweat (150–620 pg ml−1). This work uses the Severity Scoring of Atopic Dermatitis (SCORAD) scaling to create a system that is trained in different flaring scenarios to predict a flare using sweat IL-31 levels. The severity assessment combines objective AD related symptoms (i.e. lesional severity) with subjective symptoms (pruritus and sleep deprivation). 24 For clinical disease severity evaluation, mild < 25, moderate = 25–50, severe > 50 is used as a scoring threshold. 25 IL-31 levels correspond to the disease severity and are often correlated with SCORAD ranges. 26 This work evaluates the performance of the wearable sensor in four different simulated flare conditions. An evaluation of the sensing platform using a benchtop potentiostat state system (Gamry) is provided using synthetic sweat and human sweat. In addition to this, the sensor performance coupled with the portable electronics is presented in this paper. The reason for using two different potentiostats is for understanding the performance of the coupled portable electronic to the commercial gold standard, i.e., Gamry. Bland-Altman and correlation studies highlight the comparable performance of the portable sensing system to the conventional benchtop sensing system. In addition to this, the paper presents a novel machine learning approach to provide a proof-of-concept of a flare prediction system. The system offers a platform that is disposable but can perform multiple readings before the sensor can be replaced. This work is envisioned to be a wearable IL-31 monitoring system that will help with efficient management of acute and chronic AD. This also paves the path for designing wearable eczema tracking systems for pediatric and geriatric population, where gaps in communication often lead to misdiagnosis or poor prognosis of the disease.
Materials and Methods
Reagents and materials
The platform uses a thiol linker, DTSSP, 3,3-dithiobis(sulfosuccinimidyl propionate) formulated in PBS (phosphate-buffered saline), which was purchased from Thermo Fisher Scientific Inc. (Waltham, MA, USA). The IL-31 specific biorecognition probe, IL-31 antibody was also procured from Thermo Fisher Scientific Inc. (Waltham, MA, USA). IL-31 antigen used to simulate flaring profiles was purchased from Abcam (Cambridge, MA, USA). Synthetic sweat was prepared according to the protocol described in the previous work. 21 Human sweat was procured from Lee Biosolutions Inc. (Medix Biochemica Group, MO, USA). Milipore DI water was used for formulations. Additional details about the substrate and fabrication has already been provided in the previously published works. 21,22,27
Experimental design for single frequency EIS
Single frequency EIS was performed using a Gamry Reference 6000 potentiostat (Gamry Instruments, PA, USA). The EIS experiments involved a 10 mv sinusoidal input and the impedance was recorded as the output. The temporal analysis was performed at 15 hz, where maximum capacitive behavior of the system was observed. 22 Simulated profiles were created by dosing with spiked synthetic and human sweat. These concentrations are presented as ratio change from baseline, which is blank synthetic sweat or unspiked human sweat. The experiment length was simulated over the period of 60 min with two dosing concentrations per regime (low, high, or medium).
Experimental design for portable device
For this work, the group chose to use the emStat Pico for our portable measurements. This board is a collaborative effort between PalmSens (Houten, The Netherlands) and Analog Devices (Wilmington, MA, USA). The Pico has two onboard potentiostats, one of which was used to collect this data. To interface with our sensor, we used pogo-style pins which provide ohmic performance when actuated. When paired with a 3D printed housing, the sensor can be loaded into the cartridge and connected to the "snap-fit" base of the case. This actuates the pins, providing excellent electrical contact. To provide power to the device and collect the data, a wiring harness was constructed to connect to a computer with a USB to UART connector (UMFT234XD-NC, FTDI). Female headers were soldered to a daughter board, which was then connected to the emStat Pico. This was to maintain cleanliness inside the device and provide a simple plug and play system for the user. To load scripts and collect data, the group chose to use PSTrace: a programming and data collection/visualization suite provided alongside the emStat Pico.
Statistical analysis
All the data sets have been presented as mean ± SEM. The data is presented as N = 3, unless otherwise stated. The inter- and intra- assay variation lies under 10%, which is CLSI guideline compliant. 28 All the statistical analyses, including BA analysis, were performed in Graphpad Prism v 9.0 (Graph Pad Software Inc., La Jolla, CA, USA). The BA analysis was performed by plotting the difference of measure a: gamry against measure b: portable emstat pico device for all four temporal profiles.
Results and Discussion
Temporal profiles-simulating atopic flares
The platform in this work focuses on capturing the different scenarios associated with eczematous flares and creating a predictor model for the same. The scenarios or profiles for simulating these disease conditions have been described in Fig. 1b. The profiles are based on the Severity Scoring of Atopic Dermatitis (SCORAD), which is a clinical tool for rating the severity of atopic dermatitis. As discussed earlier, this range spans across different conditions of AD that are classified on its severity. The low severity case SCORAD is <25 and has corresponding sweat IL-31 levels between 50–150 pg ml−1. The moderate severity case SCORAD is between 25–50 and has corresponding sweat IL-31 levels between 200–400 pg ml−1. Similarly, the severe case has a SCORAD > 50 and the sweat IL-31 levels range from 400–620 pg ml−. 29 In order to train the SLOCK platform for detection of AD severity, the system was tested against 4 simulated temporal profiles. This is illustrated in Fig. 1b. Profile 1 consists of low-high-medium profile, where the patient has low-moderate severity and encounters a flare, but it subsides post-treatment. Temporal profile 2 consists of a low-high-medium-high profile, where the patient has moderate sensitivity to triggers, encounters a flare and condition stabilized post-treatment but the basal IL-31 levels is at a higher concentration. Profile 3 simulates a condition where the patient is sensitive, encounters a flare and the flare subsides completely post-treatment. This profile is a low-high-low biomarker concentration profile. Finally, temporal profile 4 consists of a low-high-high profile, where patient is sensitive, and the flare condition does not stabilize even after treatment. This is modeled for severe disease condition phenotypes of AD. These 4 scenarios cover the different types of patient populations associated with the prognosis of AD and help with designing a customized treatment plan according to the severity of the condition. The platform is characterized using Electrochemical Impedance Spectroscopy (EIS). Previously, the SLOCK platform (Sensor for circadian clock) was characterized for its sensitivity to IL-31 in sweat. 22 The results from this work highlight the ability of the platform to detect IL-31 over the dynamic range of 50–1000 pg ml−1. It also shows high specificity to IL-31 even in the presence of similarly structured molecules like IL-6. This work builds on the platform and explores the temporal dynamic sensing capabilities of the serpentine wearable IL-31 detection platform. From the previous work, 15 Hz was chosen as the optimal frequency of operation due to the maximum capacitive response observed for the sensing platform. 22 This was chosen as the frequency to characterize the dynamic sensitivity to rising and falling IL-31 concentrations in synthetic sweat pH 6, human sweat, and using a portable electronic device. The sensing platform is highly specific to IL-31 as it was tested previously in the presence of interferents like cortisol, DHEA, and IL-6. 22 The sensor response was significantly higher for IL-31 (p<0.05) as compared to the non-specific interferents. With this specificity established, this work presents the sensor's response to the 4 different temporal profile scenarios. This is further explored in the next few sections.
Flare profile characterization of atopic dermatitis using EIS
The simulated flare profiles for the SLOCK platform are evaluated in synthetic sweat pH 6 (SS pH 6) and human sweat using a commercial Gamry Reference 6000 potentiostat (Gamry Instruments, PA, USA). These flare profiles are also characterized using a portable benchtop potentiostat, which uses a EmStat pico system (PalmSens BV, Netherlands) to characterize the impedance response of the sensing platform.
Flare profile characterization in synthetic sweat
As discussed earlier, the four temporal profiles tested were temporal profiles 1–4, where they were scenarios which involved the following sequence of biomarker cycling: profile 1: low-high-medium, profile 2: low-high-medium/high, profile 3: low-high-low, and profile 4: low-high-high. The results for the temporal sensing performance are depicted in Figs. 2a–2d for synthetic sweat pH 6. The concentrations of biomarker were chosen as a representative of the SCORAD dependent IL-31 levels. Thus, 50 pg ml−1 was chosen as low, 500 pg ml−1 as the high, 150 pg ml−1 as the medium, 250 pg ml−1 as the medium-high, and 750 pg ml−1 as the severely high concentration point. Ratio change in modulus of impedance (Zmod) was calculated using the formula described in the previous work. 30 The ratio change is calculated from the baseline, which included blank doses of buffer. An equivalent circuit for this response is presented in Fig. S2. This modified Randle's circuit provides the modulations associated with binding. For temporal profile 1, it can be observed from Fig. 2a, that the curve shows an increase in response while transitioning from the low to high zone. The response keeps increasing going from the high to the medium zone. This is because the principle of the detection system is affinity-based sensing, so once the capture probe is bound, the probes are not regenerated. So, the impedance response is a cumulative response of addition of biomarker in the system. Extracting the slopes gives a clear idea about the response to the rising and falling IL-31 levels. This is illustrated in the inset for the graphs presented in Figs. 2a–2d. For temporal profile 1, the impedance response slope increases with the rise in concentration from 50–500 pg ml−1 and the slope drops going from the 500–150 pg ml−1 range. This highlights the ability of the sensing platform to respond to rising and falling levels designed to simulate scenario 1 described in Fig. 1b. The temporal response 2 shows a similar response where the response increases with increments of 50 pg ml−1 and 500 pg ml−1 of IL-31 in SS pH 6. For the falling profile going from high to medium/high, there is an increase in the rate of change of the impedance response, highlighted by the inset slope graph in Fig. 2b. This highlights the ability of the platform to distinguish between the low and moderate severity profile of AD patients. Similarly, the temporal profile 3, illustrated in Fig. 2c presents a standard low-high-low scenario of biomarker fluctuation. A similar increase in temporal profile is observed going from 50 to 500 pg ml−1, however with this response the transition of 500–50 pg ml−1 is highlighted by the flat-lined profile between the two last loading points of 50 pg ml−1. The cumulative response is extracted to show the fall in this range, where we see the change in slope drop to value approximately close to zero, highlighting the low biomarker concentrations in the system. This steep slope change from 500 to 50 pg ml−1 also highlights the sensitivity of the system to the rapidly falling levels of IL-31. Finally, the temporal profile 4 presents a low-high-high scenario, which is modeled after the severe case of AD, where treatment is often ineffective and is characterized by high circulating concentrations of IL-31. From Fig. 2d, it can be observed that the response is linearly increasing with the increase in biomarker concentration. This is confirmed by the extracted slope, where the rate of change of the slope is increasing with each biomarker concentration transition. This confirms the sensitivity of the sensor to simulated flaring profiles based on IL-31 biomarker levels in sweat. This also highlights the ability of the sensing platform to be able to differentiate between the 4 scenarios of varying severity of AD flares.
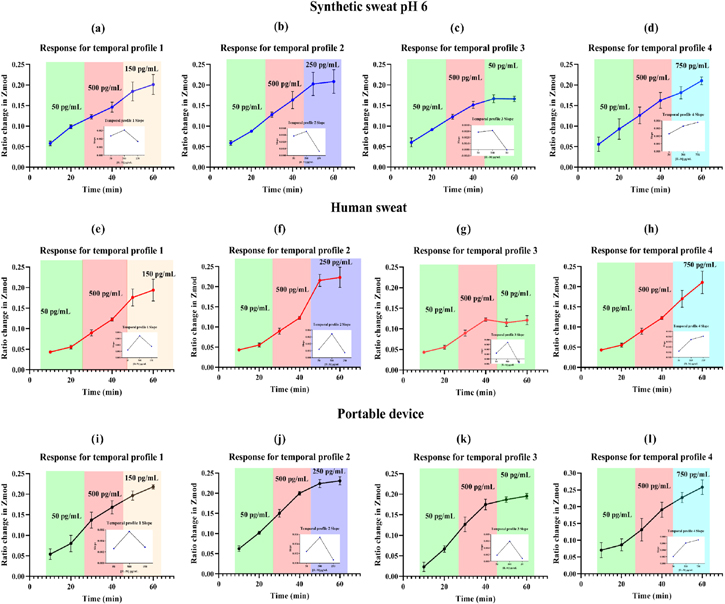
Figure 2. Flare profile characterization for all four temporal profiles in (a)–(d) performed in Synthetic sweat pH 6, (e)–(h) performed in human sweat, and (i)–(l) performed in portable device.
Download figure:
Standard image High-resolution imageFlare profile characterization in human sweat
Synthetic sweat profiles helped establish the dynamic sensing response in a controlled environment where only the ionic components were modulated. In order to truly understand the performance from a wearable perspective, the sensing performance was characterized in human sweat. This is presented in Figs. 2e–2h. The sensor performance for the same four simulated flaring profiles were characterized using single frequency EIS. The output response is very similar to the performance in synthetic sweat. Profiles 1 and 2, presented in Figs. 2e and 2f highlight the sensitivity of the sensing platform to low and moderate severity flares. The slopes are in agreement with the slopes observed with synthetic sweat. Similarly for temporal profile 3, there is a similar flat-lined response observed in the 50 pg ml−1 dosing regimen (high-low region), highlighting the fall in concentration in the presence of already bound capture probes. The slopes highlight the sharp rise and fall of the impedance in response to the biomarker concentration in the system. Similarly for temporal profile 4, there is an increase in the sensing response with the addition of 750 pg ml−1 of IL-31. This also confirms that the sensor has the ability of working over the physiologically relevant range of 150–620 pg ml−1 and does not saturate at higher concentrations. Also, it can be inferred that the sensing platform can detect severe flaring conditions typically associated with high amounts of circulating IL-31 levels. With the increasing concentrations of IL-31, the system responds by modulating the capacitance of the electrical double layer (EDL) at the electrode-electrolyte interface. This addition of biomarker and the binding associated with it leads to re-arrangement of ions that leads to change in the impedance. 21 This is typical of a non-faradaic system, where an external redox probe is not added. 31 This system allows for a label-free wearable platform that is sensitive to rising and falling concentrations of IL-31 in human sweat in simulated flaring conditions.
Flare profile characterization using portable device
A portable potentiostat was designed using an EmStat pico system (PalmSens BV, Netherlands), housed with the sensor in a 3D printed casing. A description of the fabrication related process of this portable electronic setup is provided in section 3.3. The work presented here is focused on building a portable system that is a proof-of-feasibility for a flare predictor system for AD. The portable device impedance response was characterized in a similar manner to the synthetic sweat and human sweat responses presented in the previous sections. The portable system output in different flaring scenarios is presented in Figs. 2i–2l. All four temporal responses show similar trends to the ones observed in synthetic and human sweat. The response to temporal profile 1 highlights the increase in ratio change of Zmod from 0.054 ± 0.013 to 0.13 ± 0.019 from 50 pg ml−1 to 500 pg ml−1, 0.16 ± 0.015 to 0.21 ± 0.005 from 500 pg ml−1 to 150 pg ml−1.
The extracted slopes highlight the rise and fall of the impedance response going from 50–500 and from 500–150 pg ml−1. Similarly for the temporal profile 2, the response increases as highlighted by the slope increase from 0.0024 to 0.0053 and it falls to 0.0006 for the response between 500–250 pg ml−1. This observation confirms the ability of the system to distinguish between the medium range (150 pg ml−1) and medium-high (250 pg ml−1) range for IL-31. Temporal profile 3 is also in agreement with the observations from the Gamry based synthetic sweat and human sweat data. The slope shows a clear rise and fall in the impedance change of the sensing platform in response to the flaring biomarker concentration simulation. Lastly, temporal profile 4 shows a similar increasing change in response observed with the complementing slope change in Fig. 2l. The Zmod ratio change increases from 0.086 ± 0.017 to 0.13 ± 0.019 from 50 pg ml−1 to 500 pg ml−1, 0.19 ± 0.022 to 0.25 ± 0.021 from 500 pg ml−1 to 750 pg ml−1. The corresponding slope shows a cumulative increase from 0.002 to 0.006 and 0.007 across the three dosing regimens. The portable benchtop impedance data establishes the performance parameters of the SLOCK sensing platform. This confirms that the sensor is able to perform detection over and above the physiologically relevant range of 150–620 pg ml−1. The benefits of the sensing system can be attributed to the electrochemical detection modality used, which makes the response sensitive, highly specific, label-free, provides easy coupling to portable electronics, offers wide dynamic ranges, provides ability to work with low sample volumes, and is easy to fabricate or mass-produce. 32
Correlation studies between benchtop and portable device
The performance of the commercial or standard potentiostat (Gamry Inc.) and the portable benchtop system was compared using correlation studies and Bland-Altman analysis. The following section explores the performance between the two systems with respect to the four different simulated flaring profiles.
Pearson's correlation study
The performance of the Gamry based temporal profiles and portable device based temporal profiles was compared by performing correlation studies. Figures 3a–3d depict the correlation curves between the portable device and Gamry for all four flare simulated profiles. The x-axis depicts the data obtained using Gamry and the Y -axis depicts the data obtained using the EmStat pico portable device for the profiles. Pearson's r measures the strength and direction of a linear relationship between the X- and Y- variables. 33 From the graphs presented in Figs. 3a–3d the Pearson's r values for temporal profiles 1–4 are 0.9848, 0.9933. 0.9974, and 0.9856 respectively. This observation highlights that there is a strong positive correlation observed between the two measurement techniques for all four temporal profiles. This highlights proportional growth over the dosing range for both the platforms. In addition to this, linear regression analysis was performed between the two data sets. The R2 values calculated from the analyses are 0.9698 for profile 1, 0.9866 for profile 2, 0.9948 for profile 3, and 0.9714 for profile 4. An R2 > 0.95 indicates good linear correlation between these two variables, i.e., portable device and Gamry. A summary of this response is presented in Table I. From the correlation studies, it can be inferred that the two methods have comparable performance. Also, the portable electronic coupled wearable SLOCK platform performs with similar efficiency to the commercial gold standard-Gamry.

Figure 3. Performance comparison of portable IL-31 detection platform and commercial standard-Gamry using (a)–(d) correlation for temporal profiles 1–4 and (e)–(h) Bland-Altman analysis for temporal profiles 1–4.
Download figure:
Standard image High-resolution imageTable I. Correlation study details for temporal profiles 1–4.
| Profile (Correlation between Gamry and portable device) | Pearson's r | R squared |
|---|---|---|
| Temporal profile 1 (50–500–150 pg ml−1) | 0.9848 | 0.9698 |
| Temporal profile 2 (50–500–250 pg ml−1) | 0.9933 | 0.9866 |
| Temporal profile 3 (50–500–50 pg ml−1) | 0.9974 | 0.9948 |
| Temporal profile 4 (50–500–750 pg ml−1) | 0.9856 | 0.9714 |
Bland-Altman analysis
Bland-Altman (BA) analysis is performed in conjunction with correlation analyses to determine the agreement between two methods. 34 The BA analysis is illustrated in Figs. 3e–3h for all the four temporal profiles. The analysis is performed between the data obtained from the portable EmStat pico device and gamry and is plotted as difference against the average. For profiles 1 and 2, it is evident from the graphs (Figs. 3e and 3f) that the data is distributed across the mean bias and is within the ±95% confidence intervals. For profile 1, the mean bias lies at −0.0007 and the 95% confidence intervals span from −0.03696 to 0.02260. These are also the accepted limits according to clinical standards and hence can be labelled as limits of agreement. Similarly, for profile 2, the mean bias lies at 0.01083 and the 95% confidence intervals span from −0.04122 to 0.00123. The minimal bias between the two methods for both of these profiles highlights that there is good agreement between the methods. In addition to this, the points lie within the limits of agreement and hence, show comparable performance across the two measurement techniques. Similarly for profiles 3 and 4, presented in Figs. 3g and 3h, respectively, highlight a similar response. For profile 3, mean bias lies at −0.002589 and the limits of agreement span across the range −0.05640 and 0.05123. Furthermore, for profile 4, mean bias lies at −0.02252 and the limits of agreement spans from −0.06558 to 0.02054.
However, there is a proportional bias observed in these two profiles because there is an increase in scatter with the increase in dose concentrations. 34,35 The reason for this is because the portable device has a wider range of operation for the low and high biomarker changes. This wider operational dynamic range highlights greater sensitivity to minimal fluctuations in the biomarker concentration. However, despite this observation, the methods show good agreement as the mean bias lies close to zero and the points lie within the limits of agreement. Overall, both the correlation and BA analysis highlights that the performance of the wearable platform is comparable to the commercial standard for impedance measurements. Once the performance of the wearable platform was established, the data was used to create an algorithm for prediction of flare using machine learning (ML).
Machine learning for flare prediction-proof of concept
Machine learning paves the way for transforming biosensors to "intelligent" biosensors that have predicting capabilities. These algorithms have the capacity to account for non-linear dependencies for complex biological matrices and offer solutions to pressing challenges in the biosensing realm. 36 Some of the factors that affect the response of electrochemical sensing platforms are ionic strength, temperature, pH, biofouling, etc. Coupling of ML with electrochemical sensing can help with increasing the accuracy and reliability of sensing performance in complex biological matrices. In this work, the simulated flare profiles were used as the data to create a predictive model for flaring in AD patients. The human sweat temporal data was chosen for the predictive model due to the closeness of the data to real-life scenario of on-body use. The machine learning algorithm was created in MATLAB (Natick, MA, USA). Artificial datasets with inter and intra assay variabilities obtained from benchtop measurements were created from the original extracted slope datasets of the human sweat profiles. This allowed for the use of machine learning to develop a predictive model for continuous data from the sensors to function as a proof of concept for a continuous sweat-based monitoring platform. Figure 4 shows the (a) ROC curve and (b) confusion matrix of the predictive binary classifier model developed to characterize high and low concentrations of IL-31 in sweat. The model is a Support Vector Machine (SVM) classifier, which utilizes a Fine Gaussian kernel function. An SVM classifier classifies data points by using a hyperplane to separate them. The aim of the hyperplane is to maximize the width of the space parallel to it, which divides the data points of the two classes. While in the case of a linear separation, the hyperplane is a straight line, in order to separate non-linear data points, a kernel function is required to project the data to a higher dimension so that the hyperplane can be found. 37,38 This is achieved through the use of the Gaussian function, which is characterized by a bell-shaped curve (normal distribution) and is calculated from the Euclidean distance between the data points and the parameter σ, which determines the width of the curve. 39,40

Figure 4. Predictive classifier model, (a) ROC curve depicting Area Under Curve (AUC) characteristics and (b) Confusion matrix depicting True Class vs Predicted Class.
Download figure:
Standard image High-resolution image
The confusion matrix depicts the results of the validation testing from the training dataset, a 5-folds cross validation test as a four-by-four matrix of the true values by the predicted values. The Receiver Operating Characteristic (ROC) curve depicts the false positive rate (1- specificity) by the true positive rate (sensitivity) of the model, which are calculated from the results of the validation testing. The Area Under the Curve (AUC) is calculated from the sensitivity and specificity and is used to indicate the classifier performance. 41 In order to compensate for the inter- and intra-assay variation, the extracted slope datasets from the human sweat profiles 1–4 were used to create artificial datasets by two different methods. The first artificial datasets were created by modifying the extracted slopes from the human sweat datasets with the addition of a uniform variation of +/−5%–30% across all slope values. These new datasets were then tested with the predictor function. It was found that the percent variation that could be introduced to the original slope datasets without increasing the prediction error to a value higher than what was obtained from testing with the original slope datasets was in the range of −27% to +5%, which encompasses the range of percent variation obtained from the benchtop sensor readings. This method of using artificial data sets for creating a predictive function is a widely employed strategy in the field of biosensors. One such example includes the work by Nakhleh et al., 42 where a gold nanoarray impedimetric biosensor was developed for the detection of 17 different diseases from patterned analysis of exhaled molecules. This work utilized a supervised discriminant factor analysis (DFA) linear regression model of a binary classifier to identify the different diseases. For evaluating the stability of the biosensor, the authors measured the sensor response against a fixed calibration gas mixture over the period of 16 weeks. The average percent variation in the sensor response over 16 weeks was found to be <2%. This value is within the range of variation introduced to the original slope datasets, for which the model described in this paper was found to be accurate.
For the work presented here, the second method employed to create the artificial datasets involved the use of a random number generator to generate a unique variation for each element of the original slope datasets in the range of +/−1%–10%. These new datasets were then tested with the same predictor function, which did not result in any increase in prediction errors. In a practical setting, with data collected continuously from human subjects over a period of several hours, the sensor readings can be expected to increase and decrease at varying rates of change when exposed to different levels of the target molecules over time. However, these readings are expected to fall within the physiological range and exhibit similar trends across different profiles of the same dosing regimens. Therefore, the use of artificial datasets to test the predictor function in the absence of sufficient experimental human subject data shows that accurate results can be obtained for data that follows the same trend across profiles with similar dosing regimens of the target molecule. This provides the proof-of-concept for the use of ML for creating a flare simulation system. The ML system is employed to offer the advantage of predictive learning for creating alarm systems for flares. This pilot data set provides the proof of concept for the smart sensing system. Future work involves further investigation of the predictor function with larger data sets along with the inclusion of clinical samples.
Conclusions
The work presented in this paper revolves around the development of a portable IL-31 detection system that uses an electrochemical detection modality. The novel sensing stack involves a multilayer system composed of a porous substrate along with a gauze base layer. The combined porosity ensures that the sensing system is able to sample sweat passively and not irritate the epidermis, making it ideal for future applications of sampling on irritated eczematous skin. Due to the rapidly wicking nanoporous layer utilized, the portable system works with 10 μl of sample volume and performs detection over the physiologically relevant range of 150–620 pg ml−1. This work focused on designing an IL-31 flare prediction system using four simulated temporal profile with varied dosing regimens. These temporal flare simulations were tested using sweat on a commercial potentiostat and a portable potentiostat. The performance of the portable electronic coupled sensor is comparable to the commercial analysis. This is confirmed by correlation, linear regression, and Bland-Altman analysis. The data from the portable sensor shows a strong positive correlation (r>0.9, R2 > 0.95) with the commercial standard. Bland Altman analysis also confirms the sensitivity and agreement of the portable sensor performance with the commercial standard. In addition to this, machine learning was incorporated in this work to create a flare predictor function. This algorithm provided the proof-of-concept for utilizing a predictive system to create a robust and highly sensitive biosensing platform. This paves the way for a new generation of sensors that have the ability to predict the outputs in complex biological environments.