

Abstract
Interleukin-6 (IL-6) as a pro-inflammatory cytokine demonstrate a critical role in the inflammatory response. Especially, the high levels of IL-6 measured in plasma have been associated with pathological inflammation. In this report, new molecularly imprinting biosensor on graphene quantum dots (GQDs)/functionalized multi-walled carbon nanotubes (f-MWCNTs) composite were prepared for IL-6 protein detection. The structures of GQDs, f-MWCNTs and GQDs/f-MWCNTs composite were highlighted by scanning electron microscope (SEM), transmission electron microscopy (TEM), raman spectroscopy, UV–vis spectroscopy, fourier transform infrared spectroscopy (FTIR), electrochemical impedance spectroscopy (EIS), cyclic voltammetry (CV) and X-ray diffraction (XRD) method. Surface morphology characterization shows the nanoporous cavities as an effective biosensing area. IL-6 protein imprinted electrode was prepared on GQDs/f-MWCNTs composite in the presence of 100.0 mM pyrrole containing 25.0 mM IL-6 protein. 0.01–2.0 pg ml−1 and 0.0030 pg ml−1 were found as linearity range and the detection limit (LOD) for analytical application in plasma samples. Finally, the validated biosensor was examined in terms of stability, repeatability and reproducibility.
Export citation and abstract BibTeX RIS
Inflammatory cytokines are important biomarkers that are associated with chronic inflammation. This inflammation may lead to many chronic disease processes such as cognitive impairment, heart disease and arthritis. 1 Among cytokines, IL-6 is an inflammatory pluripotent cytokine and secreted by non-lymphoid cells. IL-6 is an important biomarker and utilized for monitoring immune response in treatment of cancer. 2 Elevated levels of IL-6 has also been linked with acute stressors and cortisol secretion. 3 Further, IL-6 play important role in metabolism that increases basal glucose intake and can influence insulin activity. 4 In addition, IL-6's overexpression was studied in types of tumors involving in tumor genesis and microenvironment, immunomodulation. 5 The high IL-6 levels show the relation between inflammation and cancer. 2,6 The normal level in serum is in the range of 10–75 pg ml−1. However, its level increases up to ng ml−1 range in some patients. 7 High amounts of IL-6 trigger the formations of prostate and breast cancers. 8,9 Owing to its diagnosis of diseases progression, IL-6 determination is very significant in medicine. 10 Conventional methods such as enzyme-linked immunosorbent assay and chemiluminescence are developed for protein quantification. 11,12 In addition, SERS-based lateral flow assay biosensor was prepared for IL-6 quantification. However, long analysis time and costly instrumentation are needed on these methods. 13 Hence, more simple and easy analytical methods such as plasmonic biosensor microarrays 14 and surface plasmon resonance 12 were prepared and applied for IL-6 quantifications. Nonetheless, crucial disruptions occur due to low sensitivity towards analyte molecule. Especially, nano structured materials have important attention in high sensor responses. 15–20 In this regard, biosensors based on nanocomposites are important alternative to complex-bulky devices. Integrating graphene structures enhances development of a new generation of biosensors. Graphene nanostructure is biocompatible and has extraordinary structural and optical properties. 21 For example, graphene's two-dimensional (2D) nanostructure provides homogeneous functionalization. Graphene's electrical properties such as high charge mobility are significant in especially sensor systems. 22–25 However, since graphene sheets are zero-bandgap semiconductor, the electronic and optoelectronic applications are limited. GQDs, which are known as graphene sheets smaller than 100 nm, are especially great nanomaterial in electronic and optoelectronic applications 26 and utility of graphene quantum dots in electronic, optical and biomedical applications has increased in recent years. MWCNTs present significant properties such as high chemical stability and mechanical strength. They also accelerate electron-transfer during electrochemical process. 27 Especially, f-MWCNTs including oxygen groups makes easy carbon nanotube exfoliation and increases the solubility. 28 Thus, wider applications based on functionalization are emerging. When MWCNTs utility can be considered in composite formation, the addition of oxygen groups on graphitic surface is significant factor for interfacial adhesion. Thus, MWCNTs based nanocomposites have increased chemical stability and mechanical strength. 29
Molecularly imprinting polymers (MIPs) with specific recognition areas are prepared by molecularly imprinting technique. This technique based on polymerization forms specific cavities in polymeric matrices. There are several techniques such as UV and electrochemical polymerization for preparing MIPs. 30,31 Due to their superior stabilities and easy preparation, MIPs are currently utilized in place of natural receptors. MIPs having high specificity and selectivity also create alternative sensor materials instead of enzymes and antibodies. 32 In addition, binding kinetics, short analysis times and easy template removal provide the successful application of MIPs. 33 Because molecularly imprinting sensors based on nanomaterials enhance the sensor surface area 34,35 these sensors are significant devices for different applications such as pharmaceuticals, toxic chemicals and biomolecules. 36 Currently, modified electrochemical electrodes including organic subtracts, MIPs, nanomaterials and nanocomposites have powerful sensor applications for sensitive detection of biomolecules owing to high catalytic effect and low toxicity. 37
Herein, molecularly imprinted electrochemical biosensor including graphene quantum dots/multi-walled carbon nanotubes composite was developed for detection of IL-6. To the best of authors' knowledge, fast, simple and selective IL-6 detection on MIPs and graphene quantum dots/multi-walled carbon nanotubes composite is not yet available in literature. The linearity range and LOD values proved that the developed biosensor is more sensitive than the other similar biosensors in literature. Moreover, an environmentally friendly biosensor was presented to the literature. Hence, this study offers socio-economic benefit for better health and life quality.
Experimental
Materials
Human IL-6 standard grade antigen (1.0 mg·ml−1), tumor necrosis factor alpha (TNF-α), human immunoglobulin G (IgG), bovine serum albumin (BSA), Mucin 1 (MUC1), Mucin 4 (MUC4), Mucin 16 (MUC16) and carcino-embryonic antigen (CEA) were purchased from Sigma-Aldrich and used by dilution in pH 7.4 phosphate buffer solution (PBS, 0.1 mol·l−1).
Instrumentation
SEM and XRD images were obtained by using ZEISS EVO 50 SEM analytical microscopy and Rigaku X-ray diffractometer, respectively. Gamry Reference 600 work-station (Gamry, USA) was performed for electrochemical measurements such as Differential pulse voltammetry (DPV), CV and EIS. In addition, glassy carbon electrodes (GCE) as working electrode were utilized and cleaned according to our previous study. 38
Synthesis of nanomaterials
The synthesis of GQD and f-MWCNTs were explained detailed in our previous works. 39,40 Firstly, the thermal deoxidization of graphene oxide at 300 °C for 1 h provided graphene sheets. Then, the prepared graphene sheets (0.20 g) was subjected to oxidation process in H2SO4-HNO3 (1:1, v/v) for 10 h and GQDs were collected and dried at 25 °C. Finally, 5.0 ml dispersion of GQDs and the prepared f-MWCNTs (0.5 mg·ml−1) were mixed under vigorous stirring followed by centrifuged at 10000 rpm. Subsequently, as-obtained GQDs/f-MWCNTs composite were dried at 100 °C overnight, then dispersed in ultra-pure water at a concentration of 0.5 mg·ml−1. 41
Electrode preparation
0.5 mg·ml−1 of GQDs, 0.5 mg·ml−1 of f-MWCNTs and 0.5 mg·ml−1 of GQDs/f-MWCNTs dispersions (10.0 μl) were dropped onto the clean GCE surfaces. After that, solvent evaporation was performed by infrared lamp.
Preparation of IL-6 imprinted biosensors and IL-6 removal from electrode surfaces
After the preparations of GQDs/GCE, f-MWCNTs/GCE and GQDs/f-MWCNTs/GCE, 100.0 mM pyrrole containing 25.0 mM IL-6 in 0.1 mol·l−1 PBS was prepared in voltammetric cell for preparations of IL-6 imprinted GQDs/GCE, IL-6 imprinted f-MWCNTs/GCE and IL-6 imprinted GQDs/f-MWCNTs/GCE during 15 cycles at 100 mV·s−1 (MIP/GQDs/GCE, MIP/f-MWCNTs/GCE and MIP/GQDs/f-MWCNTs/GCE). Scheme

Scheme 1. Schematic preparation of MIP/GQDs/f-MWCNTs/GCE.
Download figure:
Standard image High-resolution imageSample preparation
IL-6-free plasma samples provided from a Blood Bank in Turkey were prepared in four different ways in order to determine the selectivity of the developed biosensor against IL-6 protein. 3.0 ml of methanol was poured onto a 0.5 ml aliquot of each plasma samples followed by centrifugation at 20000 rpm for 20 min. Subsequently, the supernatants were prepared by analysis by diluting with 0.1 M PBS, pH 7.4. 31
Results and Discussion
Physicochemical characterizations of nanomaterials
The inter-connected tubular formation of f-MWCNTs verified specific structure of carbon nanotubes (Fig. 1A). 43 GQDs' diameters of 5–9 nm and the uniform dispersion of GQDs were showed on Fig. 1B. In addition, the wrap of f-MWCNTs with GQDs was demonstrated on SEM image of GQDs/f-MWCNTs composite (Fig. 1C). Hence, the aggregation of nanomaterials (GQDs and f-MWCNTs) was prevented by the conjugated GQDs/f-MWCNTs composite which was stable in aqueous solutions.

Figure 1. SEM images of (A) f-MWCNTs, (B) GQDs and (C) GQDs/f-MWCNTs composite.
Download figure:
Standard image High-resolution imageThe morphologies of GQDs, f-MWCNTs and GQDs/f-MWCNTs composite were investigated by TEM. Figure 2A demonstrates GQDs having uniform shape and their average diameter was found to be 5–8 nm. A typical TEM image of acid-purified MWCNTs is shown in Fig. 2B. After the synthesis of GQDs on f-MWCNTs under strong stirring, Fig. 2C confirmed the successful conjugation between GQDs and f-MWCNTs.

Figure 2. TEM images of (A) GQDs, (B) f-MWCNTs and (C) GQDs/f-MWCNTs composite.
Download figure:
Standard image High-resolution imageRaman spectroscopy was used to show specific bands of nanomaterials. D band and G bands were shown at ∼1340 cm−1 and ∼1600 cm−1, respectively (Fig. 3A). The peak at ∼1340 cm−1 indicated disordered structure and local defects. The peak at ∼1600 cm−1 is corresponded sp2 bonds of carbon atoms relating to graphitization. ID/IG ratio of about 0.85 (5000 a.u./5882 a.u.) is corresponded to characteristic Raman spectra of GQDs. 44 ID/IG ratio of GQDs/f-MWCNTs composite is 0.81 (6000 a.u./7401 a.u.) and this value is higher than that of f-MWCNTs (6000 a.u./7895 a.u. = 0.76), indicating the formation of GQDs/f-MWCNTs composite via π–π interaction. The XRD peak at 24.4° (002) indicated GQDs formation (Fig. 3B). 45 Interlayer space of 0.39 nm in comparison with graphite (0.33 nm) was attributed to the presence of oxygen in GQDs. The peak at 24.4° (002) and a minor peak at 42.6° (100) emerged on XRD pattern of f-MWCNTs. Finally, the successful synthesis of GQDs/f-MWCNTs was confirmed by presence of the peaks at 24.3° and 42.6°.

Figure 3. (A) Raman spectra and (B) XRD patterns of GQDs, f-MWCNTs and GQDs/f-MWCNTs composite.
Download figure:
Standard image High-resolution imageUV–vis spectroscopy was utilized to investigate the optical properties of GQDs, f-MWCNTs and GQDs/f-MWCNTs composite (Fig. 4A). π–π* transition of aromatic C=C bonds corresponding to at about 355 nm was confirmed by blue spectrum of GQDs. 46 Two bands at about 225 and 335 nm also indicated π–π* and n–π* transition, respectively (black spectrum of f-MWCNTs). Finally, similar bands were seen for GQDs/f-MWCNTs composite (red spectrum) in comparison with f-MWCNTs.

Figure 4. (A) UV–vis spectra of f-MWCNTs (black), GQDs (blue) and GQDs/f-MWCNTs (red) composite, (B) FTIR spectra of f-MWCNTs (black), GQDs (blue) and GQDs/f-MWCNTs (red) composite.
Download figure:
Standard image High-resolution imageFTIR (Fig. 4B) was used for demonstrating functional groups of nanomaterials. C=O stretching at 1550 cm−1, C–O stretching at 1275 cm−1, −CH2 asymmetric stretching at 2980 cm−1, symmetric stretching at 2985 cm−1 and O–H stretching at 3325 cm−1 showed characteristic stretching bands of GQDs (blue spectrum). 47 Black spectrum of f-MWCNTs belonging to ύOH at 3325 cm−1, ύC=O at 1585 cm−1 and ύOH at 1031 cm−1 verified −COOH and –OH functional groups. C=O symmetric stretching (1710 cm−1) of −COOH groups, C=C stretching aromatic vibration (1530 cm−1), −CH2 bending vibration (1530 cm−1 and 650 cm−1) and C–O stretching (1185 cm−1) indicated the presence of GQDs/f-MWCNTs composite. Furthermore, asymmetric and symmetric −CH2 stretching bands at 2938 and 2881 cm−1 shifted to red area in comparison with GQDs. Hence, this red shift confirmed the formation of GQDs/f-MWCNTs.
In addition, Figs. 5A and 5B show SEM images of MIP/GQDs/f-MWCNTs/GCE and NIP/GQDs/f-MWCNTs/GCE, respectively. Polymer layer with porous structure and polymer layer without porous structure were obtained for MIP/GQDs/f-MWCNTs/GCE (Fig. 5A) and NIP/GQDs/f-MWCNTs/GCE (Fig. 5B), respectively. Thus, we can say that molecularly imprinting technique provided the specific cavities to IL-6 protein.
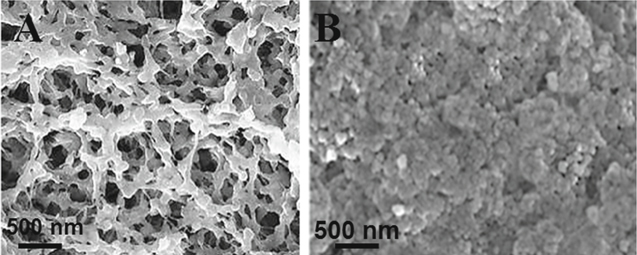
Figure 5. SEM images of (A) IL-6 antigen imprinted GQDs/f-MWCNTs/GCE (MIP) and (B) IL-6 antigen non-imprinted GQDs/f-MWCNTs/GCE (NIP).
Download figure:
Standard image High-resolution imageElectrochemical characterizations
Thanks to the high specific surface area of GQDs the more certain peaks were perceived for GQDs/GCE (curve b of Fig. 6A) while for bare GCE the anodic and cathodic peaks potential difference (ΔEp) was obtained as 120 mV (curve a of Fig. 6A). 39 Even, the higher electrochemical responses and reversible peaks were obtained by using GQDs/f-MWCNTs/GCE (ΔEp = 59.5 mV) (curve c of Fig. 6A). The increased electrode surface area and the synergistic effect between graphene quantum dots and multi-walled carbon nanotubes can cause the enhanced performances. In addition, effective surface areas were calculated in presence of 1.0 mM [Fe(CN)6]3− solution containing 0.1 M KCl by Randles–Sevcik equation of ip = 2.69 × 10⁵ A n3/2 D1/2 C v1/2. The effective surface areas of the electrodes were found by using ip − v1/2 graphics (n = 6) which were formed to use current signal values against different scan rates. Consequently, the electrochemical active areas of bare GCE, GQDs/GCE and GQDs/f-MWCNTs/GCE were calculated as 0.170 ± 0.002 cm2, 0.515 ± 0.009 cm2 and 0.981 ± 0.005 cm2, respectively. 48

Figure 6. (A) Cyclic voltammograms at (a) bare GCE, (b) GQDs/GCE, (c) GQDs/f-MWCNTs/GCE, Scan rate: 100 mV s−1; (B) EIS response at (a) GQDs/f-MWCNTs/GCE, (b) GQDs/GCE, (c) bare GCE (Frequency range: 100000–0.1 Hz, Wave amplitude: 15 mV and formal potential: 0.172 V); In the presence of 1.0 mM [Fe(CN)6]3− containing 0.1 M KCl.
Download figure:
Standard image High-resolution imageCharge transfer resistance (Rct) values are 175 ohm (curve c of bare GCE), 75 ohm (curve b of GQDs/GCE) and 25 ohm (curve a of GQDs/f-MWCNTs/GCE), respectively by EIS spectra (Fig. 6B). Hence, the highest conductivity was obtained by GQDs/f-MWCNTs/GCE. Two obvious reasons explain the optimal electrochemical responses which are caused by GQDs/f-MWCNTs/GCE:
- (1)GQDs demonstrated a highly size-dependent electrocatalytic activity. 49 Nonetheless, owing to oxidation processes, obvious degree of graphitization was destroyed. GQDs also tend to aggregation. 50 Due to these reasons, GQDs/f-MWCNTs can not only prevent the stacking of GQDs but also has larger surface area. f-MWCNTs can also accelerate charge transfer in electrochemical reactions due to their conductivity. 51
- (2)GQDs/f-MWCNTs composite has important functional groups and conjugation. Synergistic effect between GQDs and f-MWCNTs facilitates the electron transfer on GCE. 41 Hence, the highest sensitivity was achieved for IL-6 protein detection by GQDs/f-MWCNTs/GCE.
Formation of IL-6 imprinted polymer on GQDs/f-MWCNTs/GCE and DPV characterizations
Irreversible peaks at about +0.70 V belonging mixture containing pyrrole and IL-6 protein diminished gradually (Fig. 7A). Especially, the irreversible peaks disappeared at 15th cycle on GQDs/f-MWCNTs/GCE. These disappearing peaks indicated the formation of IL-6 imprinted polymer layer on electrode surface. Differential pulse voltammograms (DPVs) were also recorded to show imprinting selectivity. As seen on curve a of Fig. 7B, any current signal was not observed in only 0.1 mol l−1 PBS (pH 7.4). However, In presence of 0.2 pg ml−1 IL-6 protein, MIP/GQDs/f-MWCNTs/GCE showed the clear current signal at +0.20 V in (curve c of Fig. 7B). Finally, NIP/GQDs/f-MWCNTs/GCE showed the smaller current signal (curve b of Fig. 7B). Hence, we can indicate that molecularly imprinting technique can provide obvious sensitivity and selectivity in sensor studies. Also, the effect of nanomaterials was investigated on signal of molecularly imprinting sensor. The highest catalytic effect was observed by using MIP/GQDs/f-MWCNTs/GCE (curve a of Fig. 7C) in comparison with MIP/GCE (curve c of Fig. 7C) and MIP/GQDs/GCE (curve b of Fig. 7C).
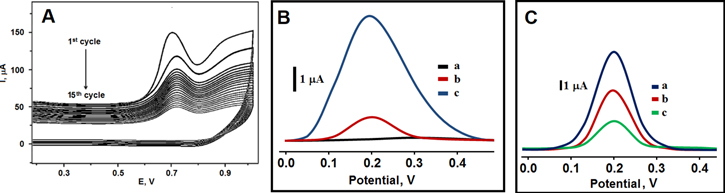
Figure 7. (A) Electrochemical polymerization of 100 mM pyrrole containing 25.0 mM IL-6 on GQDs/f-MWCNTs/GCE (Scan rate: 100 mV s−1); (B) DPVs of MIP/GQDs/f-MWCNTs/GCE in the presence of 0.1 mol l−1 PBS (pH 7.4) (curve a), NIP/GQDs/f-MWCNTs/GCE in the presence of 0.2 pg ml−1 IL-6 protein (curve b), MIP/GQDs/f-MWCNTs/GCE in the presence of 0.2 pg ml−1 IL-6 protein (curve c) (frequency of 50 Hz, pulse amplitude of 20 mV, scan increment of 3 mV); (C) DPVs on imprinted electrodes in the presence of 0.2 pg ml−1 IL-6 protein (a) MIP/GQDs/f-MWCNTs/GCE; (b) MIP/GQDs/GCE; (c) MIP/GCE (frequency of 50 Hz, pulse amplitude of 20 mV, scan increment of 3 mV).
Download figure:
Standard image High-resolution imageOptimization studies
Mole ratio IL-6 molecule to pyrrole effect
Firstly, mole ratio IL-6 protein to pyrrole effect was investigated on signal of MIP/GQDs/f-MWCNTs/GCE (Fig. 8A). When 100.0 mM pyrrole and 25.0 mM IL-6 protein were used for biosensor preparation, the optimal biosensor signals were observed. However, non-specific interactions between pyrrole and IL-6 protein were observed at higher concentrations of monomer ratios and the optimal biosensor signals deformed. Thus, 25.0 mM: 100.0 mM (1:4) was chosen as ideal ratio.

Figure 8. Effect of (A) mole ratio, (B) elution time, (C) scan cycle, (D) pH, (E) incubation time on DPVs (in presence of 0.2 pg ml−1 IL-6) (n = 6) (frequency of 50 Hz, pulse amplitude of 20 mV, scan increment of 3 mV).
Download figure:
Standard image High-resolution imageRemoval (regeneration) time effect
Removal time effect was investigated for of IL-6 protein removal from MIP/GQDs/f-MWCNTs/GCE (Fig. 8B). Until 15 min of removal time, the biosensor responses gradually increased. After 15 min, these responses remained steady. Hence, no IL-6 protein was found on MIP/GQDs/f-MWCNTs/GCE and IL-6 protein removal was carried out.
Scan cycle effect
In sensor science, scanning cycle is one of the most important factors affecting the sensitivity of the signals obtained. Variable scan numbers were tried for obtaining optimal interactions between pyrrole and IL-6 protein (Fig. 8C) and the optimal signals were observed at 15th of scan cycle
pH effect
pH effect was also investigated on biosensor signals. According to obtained DPVs from MIP/GQDs/f-MWCNTs/GCE, the current signals increased up to pH 7.4 (Fig. 8D). This situation resulted from protein denaturation under acidic or alkaline medium. Hence, the working pH was chosen as 7.4.
Validation
Linearity range
The linearity and correlation between MIP/GQDs/f-MWCNTs/GCE and IL-6 protein was shown on Fig. 9. Inset of Fig. 9 showed the calibration equation "y (μA) = 50.029× (pg ml−1) −0.1701." 0.010 pg ml−1 and 0.0030 pg ml−1 were found as quantification limit (LOQ) and LOD, respectively. LOQ and LOD were calculated by Eqs. 1 and 2:


Where S is standard deviation of intercept and m is slope of calibration equation. When we consider linearity range and LOD of the developed biosensor in this study, some comparisons are performed according to other techniques in literature (Table I). Firstly, the MIP/GQDs/f-MWCNTs/GCE is the more sensitive than other biosensors. In addition, MIP/GQDs/f-MWCNTs/GCE is simple, fast, selective and stable biosensor. Finally, when GQDs/f-MWCNTs composite was prepared, a small amount of chemicals was used. Thus, we can say that environmentally friendly biosensor was presented in the literature. The developed biosensor, which is alternative to the other biosensors, can be used for clinical applications.
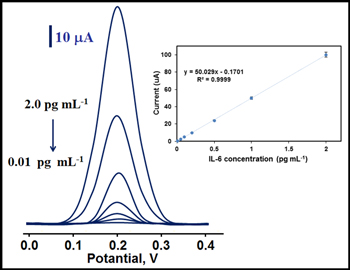
Figure 9. Effect of concentration on DPV current signals: Inset: Calibration curve of IL-6 protein concentrations at MIP/GQDs/f-MWCNTs/GCE in pH 7.4 of 0.1 mol l−1 PBS (from 0.01 to 1.0 pg ml−1 IL-6 protein) (frequency of 50 Hz, pulse amplitude of 20 mV, scan increment of 3 mV).
Download figure:
Standard image High-resolution imageTable I. Comparison of the biosensor with other methods.
| Biosensor/Method | Linear Range | LOD | References |
|---|---|---|---|
| Impedimetric | 5.00–100.0 pg ml−1 | 1.60 pg ml−1 | 52 |
| Impedimetric | 1.0 pg ml−1–15.0 μg ml−1 | 0.33 pg ml−1 | 53 |
| DPV | 0.0−100.0 pg ml−1 | 1.0 pg ml−1 | 54 |
| AgNP–TiP | 0.0005−10.0 ng ml−1 | 0.1 pg ml−1 | 55 |
| SERS | 1.0 pg ml−1−1.0 μg ml−1 | 1.0 pg ml−1 | 56 |
| LFIA | 2.0−500.0 pg ml−1 | 0.37 pg ml−1 | 57 |
| Aptamer-coated AuNPs | 3.3−125.0 μg ml−1 | 1.95 μg ml−1 | 58 |
| GO thin film | 1.0−300.0 pg ml−1 | 1.0 pg ml−1 | 59 |
| MIP/GQDs/f-MWCNTs/GCE | 0.01−2.0 pg ml−1 | 0.0030 pg ml−1 | This study |
AgNP–TiP: Silver nanoparticle–hollow titanium phosphate sphere; SERS: Surface-enhanced Raman scattering; LFIA: lateral flow immunoassay; AuNPs: Gold nanoparticles; GO: Graphene oxide.
Precision and accuracy
Both the intra-day and the inter-day precision tests, and accuracy tests were conducted for three different concentrations (0.05, 0.10 and 0.20 pg ml−1 IL-6 protein) (Table II). The relative standard deviation (RSD)values were determined as 0.245–0.491 and 0.490–0.976 for intra-day and inter-day precision tests, respectively whereas % bias values as accuracy are obtained as 0.05–0.20 for intra-day and 0.10–0.40 for inter-day. The high precision and accuracy of the developed biosensor for detection of Interleukin-6 was proven by the low RSD and Bias % values. 60
Table II. Intra-day and inter-day precision and accuray results of IL-6 (n = 6).
| Added (pg ml−1) | Intra-day | Inter-day | ||||
|---|---|---|---|---|---|---|
| IL-6 | Found a) (pg ml−1) | Precision b) (%) | Bias c) (%) | Found a) (pg ml−1) | Precision b) (%) | Bias c) (%) |
| 0.0500 | 0.0499 ± 0.0001 | 0.491 | 0.20 | 0.0502 ± 0.0002 | 0.976 | 0.40 |
| 0.1000 | 0.1001 ± 0.0002 | 0.490 | 0.10 | 0.1003 ± 0.0002 | 0.488 | 0.30 |
| 0.2000 | 0.1999 ± 0.0002 | 0.245 | 0.05 | 0.2002 ± 0.0004 | 0.490 | 0.10 |
a)Mean ± Standart Error, b)Precision %: Relative Standart Deviation (RSD), c)Bias %: [(found—added)/added] × 100%.
Recovery
To show IL-6 protein specificity of the developed biosensor, recovery experiments (Table III) were firstly performed. The high recovery indicated that MIP/GQDs/f-MWCNTs/GCE had good specificity to target IL-6 protein in presence of other proteins. In addition, capillary zone electrophoresis—mass spectrometry (CZE-MS) was performed to evaluate the validity of MIP/GQDs/f-MWCNTs/GCE. 61 According to Table IV, important difference between the results of two methods was not found (Wilcoxon test: Tcalculated > Ttabulated, p > 0.05). Moreover, standard addition method was developed to investigate the effects of interference protein. Calibration curve of y (μA) = 50.183 × (pg ml−1) + 1.934 was observed. Thus, almost the same slopes between direct calibration and standard addition methods show the developed biosensor's high selectivity.
Table III. The recovery of IL-6 (n = 6).
| Plasma sample | Added IL-6 (pg ml−1) | Found IL-6 (pg ml−1) | Recovery (%) |
|---|---|---|---|
| a)Sample (1) | 0.100 | 0.101 ± 0.0002 | — |
| b)Sample (2) | Sample(1) + 0.300 | 0.398 ± 0.0003 | 99.50 ± 0.7 |
| c)Sample (3) | Sample(1) + 0.500 | 0.601 ± 0.0004 | 100.17 ± 0.8 |
| d)Sample (4) | Sample(1) + 0.700 | 0.801 ± 0.0001 | 100.13 ± 1.2 |
a)containing 0.100 pg ml−1 IL-6, 0.100 pg ml−1 TNF-α, 0.100 pg ml−1 IgG, 0.100 pg ml−1 BSA, 0.100 pg ml−1 MUC1, 0.100 pg ml−1 MUC4, 0.100 pg ml−1 MUC16, 0.100 pg ml−1 CEA. b)containing 0.100 pg ml−1 + 0.300 pg ml−1 IL-6, 0.100 pg ml−1 TNF-α, 0.100 pg ml−1 IgG, 0.100 pg ml−1 BSA, 0.100 pg ml−1 MUC1, 0.100 pg ml−1 MUC4, 0.100 pg ml−1 MUC16, 0.100 pg ml−1 CEA. c)containing 0.100 pg ml−1 + 0.500 pg ml−1 IL-6, 0.100 pg ml−1 TNF-α, 0.100 pg ml−1 IgG, 0.100 pg ml−1 BSA, 0.100 pg ml−1 MUC1, 0.100 pg ml−1 MUC4, 0.100 pg ml−1 MUC16, 0.100 pg ml−1 CEA. d)containing 0.100 pg ml−1 + 0.700 pg ml−1 IL-6, 0.100 pg ml−1 TNF-α, 0.100 pg ml−1 IgG, 0.100 pg ml−1 BSA, 0.100 pg ml−1 MUC1, 0.100 pg ml−1 MUC4, 0.100 pg ml−1 MUC16, 0.100 pg ml−1 CEA.
Table IV. Comparison of the results obtained by the biosensor and CZE-MS for IL-6 detection (n = 6) (Added IL-6 = 0.400 pg ml−1).
| Found IL-6 | ||
|---|---|---|
| Sample | MIP/GQDs/f-MWCNTs/GCE | CZE-MS |
| Plasma sample (pg ml−1) | 0.398 ± 0.0003 | 0.399 ± 0.0001 |
| SD | 0.00074 | 0.00025 |
| RSD | 0.186 | 0.063 |
 Mean ± Standard Error, SD: Standard Deviation, RSD: % Relative Standard Deviation.
Selectivity
IL-6 is a member of pluripotent cytokines including in interferons, interleukins, lymphokines and tumor necrosis factors. Proinflammatory cytokines greatly stimulate MUC1, MUC4 and MUC16 expressions in various cellular contexts. Common protein interferences (IgG, BSA and CEA) were also selected. Some of these proteins are present in the blood (even in nonpathological conditions). In this work, prepared eight different solutions (0.20 pg ml−1 IL-6, TNF-α, IgG, BSA, MUC1, MUC4, MUC16 and CEA in presence of 0.1 mol l−1 PBS, pH 7.4) were prepared to evaluate the selectivity of the MIP/GQDs/f-MWCNTs/GCE. According to Fig. 10A, the highest sensor signals (ΔI = 10.00 μA) were observed towards 0.20 pg ml−1 IL-6. On the other hand, MIP/GQDs/f-MWCNTs/GCE demonstrated low non-specific sensor signals towards TNF-α, IgG, BSA, MUC1, MUC4, MUC16 and CEA. The results depicted that the MIP/GQDs/f-MWCNTs/GCE was 3.33, 4.00, 5.00, 6.67, 10.00, 20.00 and 40.00 times selective towards IL-6 in comparison with TNF-α, IgG, BSA, MUC1, MUC4, MUC16 and CEA (Table V). In addition, the specificity of imprinting was investigated by using NIP/GQDs/f-MWCNTs/GCE (Fig. 10B). The selectivity coefficients for NIP/GQDs/f-MWCNTs/GCE in respect to TNF-α, IgG, BSA, MUC1, MUC4, MUC16 and CEA were obtained to be 2.67, 3.33, 4.00, 5.00, 6.67, 10.00 and 20.00, respectively. According to imprinting factors (k'), IL-6 imprinted biosensor can recognize IL-6 protein 1.25 times more selective than TNF-α, 1.20 times more selective than IgG, 1.25 times more selective than BSA, 1.33 times more selective than MUC1, 1.50 times more selective than MUC4, 2.00 times more selective than MUC16 and 2.00 times more selective than CEA (Table V). As seen from the results, molecular imprinting process brought high selectivity to IL-6 imprinted biosensor.

Figure 10. (A) DPVs relating to 0.20 pg ml−1 IL-6, TNF-α, IgG, BSA, MUC1, MUC4, MUC16 and CEA on MIP/GQDs/f-MWCNTs/GCE (frequency of 50 Hz, pulse amplitude of 20 mV, scan increment of 3 mV); (B) DPVs relating to 0.20 pg ml−1 IL-6, TNF-α, IgG, BSA, MUC1, MUC4, MUC16 and CEA on NIP/GQDs/f-MWCNTs/GCE (frequency of 50 Hz, pulse amplitude of 20 mV, scan increment of 3 mV).
Download figure:
Standard image High-resolution imageTable V. The selectivity coefficients (k) and relative selectivity coefficients (k') values of MIP/GQDs/f-MWCNTs/GCE and NIP/GQDs/f-MWCNTs/GCE.
| MIP | NIP | ||||
|---|---|---|---|---|---|
| ΔI | k | ΔI | k | k' | |
| IL-6 | 10.00 | — | 2.00 | — | — |
| TNF-α | 3.00 | 3.33 | 0.75 | 2.67 | 1.25 |
| IgG | 2.50 | 4.00 | 0.60 | 3.33 | 1.20 |
| BSA | 2.00 | 5.00 | 0.50 | 4.00 | 1.25 |
| MUC1 | 1.50 | 6.67 | 0.40 | 5.00 | 1.33 |
| MUC4 | 1.00 | 10.00 | 0.30 | 6.67 | 1.50 |
| MUC16 | 0.50 | 20.00 | 0.20 | 10.00 | 2.00 |
| CEA | 0.25 | 40.00 | 0.10 | 20.00 | 2.00 |
k = ΔIanalyte/ΔIinterference and k' = kMIP/kNIP (k' was calculated to obtain the specificity of imprinting for developed biosensor). 62
Stability
When one MIP/GQDs/f-MWCNTs/GCE was used for 60 d, DPVs and observed current signals were recorded (Fig. 11). According to DPVs, the current signals having about 10.0 μA (RSD: 0.16%) were obtained. Thus, the prepared MIP/GQDs/f-MWCNTs/GCE has good stability for clinical applications.

Figure 11. Inter-day measurements for stability of one imprinted electrode (MIP/GQDs/f-MWCNTs/GCE) in presence of 0.20 pg ml−1 IL-6 (frequency of 50 Hz, pulse amplitude of 20 mV, scan increment of 3 mV).
Download figure:
Standard image High-resolution image
Repeatability
Consecutive 60 voltammograms were recorded on same day for repeatability test (in presence of 0.20 pg ml−1 IL-6). Continuous repeatable responses at +0.20 V (RSD: 0.17%) were obtained.
Reproducibility
The differential puls voltammograms were obtained at +0.20 V for 30 different IL-6 imprinted biosensors in presence of 0.20 pg ml-1 IL-6 to evaluate the reproducibility of biosensors. It was proven that the biosensor production pathway was of high reliability since the current signals were obtained as ca.10.0 μA (RSD: 0.12%).
Reusability
Reusability of MIP/GQDs/f-MWCNTs/GCE including 0.20 pg ml−1 IL-6 was investigated. The RSD value for obtained peak currents was 1.48% for at least 35 usage of one MIP/GQDs/f-MWCNTs/GCE. Thus, the prepared molecularly imprinting biosensor had a high degree of reusability.
Conclusions
In this study, novel molecularly imprinting biosensor was prepared and utilized for Interleukin-6 detection. This biosensor was formed based on the combination of selective molecularly imprinted polymers and sensitive properties of graphene quantum dots/ functionalized multi-walled carbon nanotubes nanocomposite. Since the utility of the prepared biosensor in the determination of Interleukin-6 protein was carried out by the electrochemical system, the amount of solvent comsumed was reduced, thus the environmental pollution effect was minimized. At the same time, less costly molecularly imprinted polymer based biosensor was developed instead of expensive systems such as HPLC, GC, MS.
After the successful synthesis of GQDs on f-MWCNTs, the prepared GQDs/f-MWCNTs composite provided the excellent catalytic effect. A linearity range (0.01–2.0 pg ml−1) with LOD of 0.0030 pg ml−1 was obtained for detecting Interleukin-6 protein. Owing to some advantages such as selectivity, stability, repeatability and reproducibility, this developed biosensor suggests socio-economic benefit for better health and life quality.
Acknowledgments
None.