
Abstract
This study systematically analyzed reactive species generated with self-built helium-based low-temperature atmospheric-pressure plasma jet (He-APPJ); we measured the hydroxyl radical (·OH) and hydrogen peroxide (H2O2) above surfaces of plasma–treating solutions and in plasma-treated medium (PTM) of different solutions, including deionized water, phosphate buffered saline, and Dulbecco's modified Eagle medium. The effects of adding O2 into He working gas on ·OH and H2O2 generation were discussed. The MCF7 cell responses to plasma treatment were also observed. The ·OH emission (309 nm) in He-APPJ and above surfaces of plasma–treating solutions were analyzed through optical emission spectroscopy, and concentrations of ·OH and H2O2 in different solutions were measured using terephthalic acid and Amplex Red, respectively. In our plasma system, it was observed that higher conductivity of solutions may cause stronger ·OH emission above solution. The ingredients of the solution may affect the concentrations of ·OH and H2O2. Addition of 0.1% O2 generates strongest ·OH emission above surfaces of plasma–treating solution with our He-APPJ, and thus, the highest H2O2 concentration in PTM. The MCF7 cell viability is influenced by the H2O2 concentration in PTM. The results of this study can facilitate further study of plasma effects on PTM and cell culture.
Export citation and abstract BibTeX RIS

This is an open access article distributed under the terms of the Creative Commons Attribution 4.0 License (CC BY, http://creativecommons.org/licenses/by/4.0/), which permits unrestricted reuse of the work in any medium, provided the original work is properly cited.
In recent years, low-temperature atmospheric-pressure plasma has become popular as a new tool in medical treatment because of its portability, treatment versatility, ingredient adjustability, and penetrative gas. Recent studies have reported that plasma can stimulate cell apoptosis, signal transduction, proliferation, migration, adhesion, gene transfection, and induce cell differentiation.1–7 In addition, previous study has shown that the reactive oxygen species (ROS) produced by cold plasma influence the inter- and intracellular networks in mammalian cells.8
However, the factors causing the reaction of cells in solutions treated by helium-based low temperature atmospheric-pressure plasma jet (He-APPJ) are not clear yet. Interactions of the plasma with solutions have been brought to public attention for their biomedical applications because the cells inside the solutions can either be killed or activated9 by the various types of ROS produced according to the different plasma working gases, discharge power, plasma treatment times, applied voltages, and flow rates, among others. These effects of ROS on the cells in the solutions have not been well studied yet. ROS such as hydroxyl radical (·OH) can degrade recalcitrant organic matter, whereas ozone (O3) or hydrogen peroxide (H2O2) cannot process it sufficiently. Moreover, H2O2 and ·OH can be generated in the cells10 and can break DNA backbone, change proteins, and react with cell membranes.11 Hence, to quantify the optimal ROS concentration for desired effects on cells and understand the ROS generation in plasma, plasma–solution interface, and solution in different solutions are important to further advance the use in biomedical application.
However, previous study only measured the ROS above plasma-treating solution of one or two kind solution.12,13 Most study measured the H2O2 and ·OH concentration only in single solutions, such as DI water,12,14,15 PBS,16 RPMI,17–19 DMEM20–22 or inorganic salt solution.21 Some study reported ROS measurement in three different solutions23–25 and a study reported 4 different solutions,26 but have not discussed the ROS generation above solution at the same time. In short, the effects of using different solution on ROS concentration above surfaces of plasma–treating solution and in solution have not been systematically investigated yet.
In this study, optical emission spectroscopy (OES) was used to analyze the ROS in Helium-based free jet and above surfaces of plasma–treating solution of plasma with different solutions, including deionized water (DI water), phosphate buffered saline (PBS), and Dulbecco's modified Eagle medium (DMEM). We also measured the concentration of ·OH and H2O2 in different solutions with different plasma treatment times. Moreover, the effect of O2 addition into working gas was discussed. The results show that the amount of ·OH generated above surfaces of plasma–treating solution is different for different solutions. In addition, the concentration of ·OH and H2O2 is also different for different solutions. Adding O2 can alter the amount of ·OH generated in He-APPJ, and thus, the concentration of ·OH and H2O2 in solution. The results of this study can facilitate understanding the ROS generation in cell culture medium and determining the applicable medium for plasma treatment in clinical application.
Experimental Methods
Helium-based low-temperature atmospheric-pressure plasma jet device
The low-temperature atmospheric-pressure plasma jet device and experimental setup are shown in Fig. 1.27 A quartz nozzle with 4-mm inner diameter and 8-mm outer diameter was used as a dielectric barrier. A stainless-steel tube with 1.56-mm inner diameter and 3-mm outer diameter was inserted into the quartz nozzle as an electrode. A stable sine wave at a frequency of 19.5 kHz and voltage amplitude of 6 kV was generated by a portable power supply and applied to the stainless-steel electrode. No ground is connected to the jet, so it is floated. A high-voltage probe (P6015A, Tektronix, Beaverton, Oregon, USA) and a digital oscilloscope (TDS1012B, Tektronix, Beaverton, Oregon, USA) were used to monitor and adjust the voltage. The working gas was helium (99.99%) and tubed by PU tube. The gas pressure was controlled by using a regulating valve, and the flow rate was fixed at 5 slm by using a flow controller. The working gas was then injected through the stainless-steel-tube electrode by using a plastic tube. The plasma was generated inside the quartz and a plasma jet was formed at the outlet of the quartz tube. A 3D printer was used to make an insulating cover outside the quartz tube for safety. The distance from the outlet of the plasma jet to the surface of the solutions was 10 mm.

Figure 1. Experimental setup of the He-APPJ treatment on cell-free solution.
Download figure:
Standard image High-resolution image·OH analysis in jet and above surfaces of plasma–treating solution with OES
OES was used to analyze the emission of the ·OH in the He-APPJ and above surfaces of plasma–treating solutions. A monochromator (Acton SP 2500, Princeton Instruments, Trenton, New Jersey, USA) with photomultiplier tubes (R298, Hamamatsu, Japan) was used as a spectrum analyzer to identify the ·OH created by the He-APPJ and measure the relative OES emission intensity at 309 nm. The wavelengths measured in this study ranged from 280 to 400 nm so the emissions of excited N2 were also observed. At a distance of 0 and 10 mm from the He-APPJ nozzle outlet, the receiver of OES was placed respectively to compare the emission-intensity difference of the ·OH. To further discuss the ·OH generation in different solutions, solutions including DI water, PBS (GE Healthcare HyClone™, Logan, Utah, USA), and DMEM (GE Healthcare HyClone™, Logan, Utah, USA), were placed 10 mm from the nozzle outlet, and the ·OH emission intensity above solution was measured through OES. The PBS (10×) was diluted to PBS (1×) in our experiment.
·OH and H2O2 analysis in He-APPJ-treated solutions
To measure the generated amount of ·OH and H2O2 in solutions, terephthalic acid (TA) (Sigma-Aldrich, St. Louis, Missouri, USA) and Amplex Red (Thermo Fisher Scientific, Waltham, Massachusetts, USA) were used to measure the ·OH and H2O2 concentration in solution, respectively. The conductivity and pH value of the solutions were also measured.
Measurement of ·OH concentration and ·OH diffusion in the solutions
In this study, TA was used to measure the ·OH concentration in the solutions after He-APPJ treatment.28,29 As shown in Fig. 2, a quartz cuvette (12.5 mm × 12.5 mm × 45 m) with 4 c.c. solution (NaOH (Merck, Darmstadt, Germany) concentration 5 mM and TA concentration 2 mM) was placed under He-APPJ. The distance between the He-APPJ nozzle outlet and the solution surface was 10 mm. During He-APPJ treatment, TA reacted with ·OH and became 2-hydroxyterephthalic acid (HTA). Same concentration of NaOH (5 mM) and TA (2 mM) were added into the 4 different solutions used in this study. The solution with cuvette was then placed in a dark box and exposed to a 200-W mercury lamp (Spectrasuite, Ocean Optics, Dunedin, Florida, USA) with a 310 nm bandpass (FWHM 10 nm) filter (U347-23, Ocean Optics, Dunedin, Florida, USA). The HTA in solution was excited with 310-nm UV light and emitted 425-nm fluorescence. The fluorescence spectra were analyzed using a spectrometer (USB2000+, Ocean Optics, Dunedin, Florida, USA). Finally, the ·OH concentration in the solutions was quantified with the standard curve. The standard curve was established by measuring the 310-nm emission intensity of DI water with different HTA concentration.
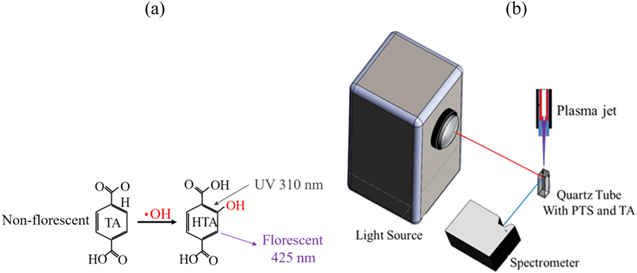
Figure 2. (a) TA reacts with ·OH and becomes fluorescent HTA. The excitation wavelength is 310 nm and the emission wavelength is 425 nm. (b) Measurement setup of HTA in plasma-treated medium (PTM) with filtered 310-nm light source and 425-nm light absorption.
Download figure:
Standard image High-resolution imageMeasurement of H2O2 concentration in the solutions
An Amplex Red assay kit and an enzyme-linked immunosorbent assay (ELISA) reader (Anthos 2020, Biochrom, Cambridge, UK) were used to measure the H2O2 concentration in the solutions.30 The principle of this experiment is shown in Fig. 3. 5-ml solution of Amplex Red assay contained 100 μl of 1 × reaction buffer and horseradish peroxidase admixture, 50 μl of dimethyl sulfoxide (DMSO) and Amplex Red reagent admixture, and 4.85 ml of 1 × reaction buffer. 50 μl of the solutions after He-APPJ treatment and 50 μl of the Amplex Red solution were mixed and incubated for 30 min, protecting them from light. The absorbance of the samples was measured by using an ELISA reader at a wavelength of 570 nm, and the H2O2 concentration in the solutions was quantified with the standard curve.

Figure 3. Amplex Red reacts with H2O2 and becomes a molecule that can absorb 570-nm light.
Download figure:
Standard image High-resolution imageConductivity and pH value of plasma-treated solutions
The conductivity and pH value of plasma-treated solutions were measured using a conductivity meter (Sc-170, Suntex, Taipei, Taiwan) and pH meter (MP6100, Yirher Chem. & Hort, Kaohsiung, Taiwan), respectively.
Effects of O2 addition to working gas on ROS generation
The effects of adding 0%, 0.1%, 0.2%, and 0.3% O2 to helium working gas on the generation of ROS were discussed. OES was used to analyze the ROS in free jet and above surfaces of plasma–treating solutions. ·OH and H2O2 concentrations in solution were measured using TA and Amplex Red, respectively. The O3 concentration in gas phase was measured with ozone meter (EST-1015, Environmental Sensor Technology, New York, USA).
Cell viability after He-APPJ treatment
1 × 10⁴ and 5 × 10⁴ MCF7 cells were cultured in 96-well plates with 100-ml Roswell Park Memorial Institute medium (RPMI) solutions in a 37 °C, 5% CO2 incubator. After overnight incubation, the cells were treated by He-APPJ in two ways:
- (1)Direct exposure (DE) to plasma: plasma treatment applied to the cell-culture medium directly.
- (2)Plasma treated medium (PTM): plasma treatment applied to another RPMI solution (without MCF7 cell); the original cultured RPMI was replaced by the plasma-treated RPMI immediately after plasma treatment. MCF7 cells were cultured for 24 h, and MCF7 cell viability was evaluated through 3-(4,5-cimethylthiazol-2-yl)-2,5-diphenyl tetrazolium bromide (MTT) assay.
The He-APPJ treatment time was 0, 10, 20, 30, 40, 60, and 120 s; 24 h after the treatments, the viability of MCF7 cells was evaluated through MTT assay. The treated cells were washed by PBS twice and cultured in MTT solution with a concentration of 0.5 mg ml−1 at 37 °C in dark for 3 h. Formazan salts were dissolved with 100-μl DMSO and their absorbance at 570 nm was measured using an ELISA reader (Anthos 2020, Biochrom Ltd., Cambridge, UK).
Results and Discussion
Analysis of species generation in He-APPJ
OES was used to identify different types of excited species generation and measure the relative intensity of the ·OH in He-APPJ. The OES spectra and the corresponding species were identified31 and are shown in Fig. 4. The intensity of ·OH and excited N2 species measured at 10 mm from the plasma nozzle outlet was higher than that at 0 mm from the plasma nozzle outlet. The ·OH emission intensity of OES signal relates to both ·OH concentration and ·OH excitation-deexcitation process. The OES intensity difference here might come from the amount of H2O and N2 reacting with plasma at 10 mm, and it was more than that at 0 mm, owing to the diffusion between the plasma and ambient air.
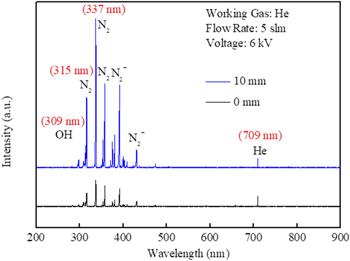
Figure 4. Optical emission spectrum (200–900 nm) of the He-APPJ in air. The OES probe was placed at 0 and 10 mm from the nozzle outlet.
Download figure:
Standard image High-resolution imageAnalysis of ·OH emission intensity above surfaces of plasma–treating solution
OES was used to measure the emission intensity of the ·OH above surfaces of plasma–treating solution and in the free jet. The solutions included DI water, PBS, and DMEM. As shown in Fig. 5, the OES emission intensity of the ·OH above surfaces of plasma–treating solution of all the three solutions was higher than that of the free jet. The emission intensity of ·OH at a wavelength of 309 nm of the solutions was also higher than that of the free jet. The emission intensity of ·OH at a wavelength of 309 nm under free jet condition was approximately 570 a.u., above plasma-DI water interface was approximately 1300 a.u., above plasma-PBS interface was approximately 1600 a.u., and above plasma–DMEM interface was approximately 1600 a.u.
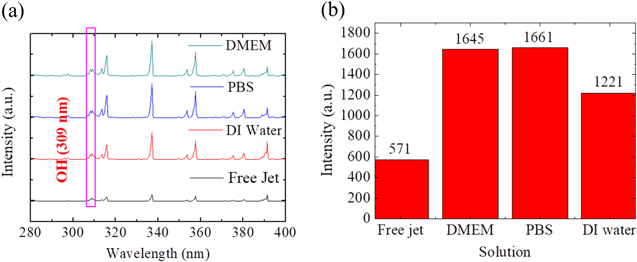
Figure 5. (a) Optical emission spectrum (200–400 nm) of the He-APPJ in air, above plasma–DI water interface, above plasma–PBS interface, and above plasma–DMEM interface. The OES probe was placed at 10 mm from the nozzle outlet. (b) The OES intensity at 309 nm from He-APPJ in air and above the plasma–liquid interface of three different solutions.
Download figure:
Standard image High-resolution imageThis may be because of the accumulation of electric charge at the solution surface, which induced a stronger electric field and enhanced the plasma excitation.32,33 Therefore, the ROS generation and ROS excitation-deexcitation process above solution could be more than that in free jet. Moreover, vapor at the solution surface provided additional H2O molecules and generated additional ·OH after the reaction with plasma.
The conductivity and pH value of the solutions before plasma treatment were measured (Table I). The conductivity of PBS (17410 μS cm−1) and DMEM (17330 μS cm−1) were much higher than that of DI water (8.5 μS cm−1), and the pH values of the three solutions were all nearly 7. The conductivity difference may be the reason why the ·OH intensity above PBS and DMEM was higher than that of DI water. The high conductivity surface served as a floating electrode, and thus, the plasma discharge was prolonged to the solution interface.34 Therefore, the plasma excitation above solution was higher, and increased the ·OH emission intensity. The plasma treatments in this study did not change the pH of the solutions significantly.
Table I. Initial conductivity and pH value of different solutions.
| DMEM | PBS | DI water | |
|---|---|---|---|
| Conductivity (μs cm−1) | 17410 | 17330 | 8.5 |
| pH value | 7.1 | 7.3 | 7.3 |
ROS analysis in solutions
·OH analysis in solutions
TA was used to measure the ·OH concentration in He-APPJ-treated DI water, PBS, and DMEM. The solution with TA was treated with He-APPJ for 10–60 s and then exposed to 310-nm light to emit 425-nm blue light.
The light emission intensity of HTA in the plasma-treated solutions was measured with a spectrometer. The intensity at 425 nm (Fig. 6a) was converted to ·OH concentration (Fig. 6b) with the standard curve. The ·OH concentration in solutions increased linearly with the He-APPJ treatment time, and the increase rate of ·OH in DI water was higher than that in PBS. Owing to DMEM was fluorescent, the blue fluorescence of DMEM might result from the bovine serum albumin (BSA (excitation wavelength 280 nm and emission wavelength 345 nm)) in DMEM.35 In addition, the –SH group on BSA can react with ·OH,36 making the ·OH measurement in DMEM more difficult. Therefore, the ·OH concentration in DMEM could not be derived with the TA method.

Figure 6. (a) HTA absorbance intensity in different solutions treated by He-APPJ. Data are mean and SD values (n = 3). (b) The corresponding ·OH concentration in different solutions treated by He-APPJ was calculated using the standard curve.
Download figure:
Standard image High-resolution imageThe ROS above surfaces of plasma–treating solution was generated by plasma reaction with ambient air and the solution surface.14 When ROS entered solutions, they reacted with the ingredients of the solution and generated several types of particles and ions.37,38 Among these ROS, ·OH is strongly chemically active and can react with glucose and methionine in DMEM.37,39
H2O2 analysis in the solutions
The H2O2 in the solutions reacted with Amplex Red, and the O.D. value was measured using a ELISA reader. The H2O2 concentration was converted from the O.D. value with the standard curve. The measured H2O2 concentration is shown in Fig. 7. The H2O2 concentration in the DI water increased roughly linearly. For PBS and DMEM, the H2O2 concentration increased roughly linearly at beginning, and the increase rate decreased gradually after 30 s for PBS and after 40 s for DMEM. It might be because when the H2O2 concentration increased, the OCl− reacted with H2O2, as given in Eq. 1. In addition, the H2O2 concentration in high to low order was DI water, PBS, and DMEM. This might be because DMEM had the most ions and organic compounds among these three solutions and DI water has the least. The ions and organic compounds reacted with H2O2 and consumed the H2O2 in the solutions.21,37 On the basis of the ·OH and H2O2 reaction equation in Eq. 2 and the measured H2O2 concentrations, the authors suggest that the ·OH concentration in DMEM should be lower than that in DI water and PBS.40–43


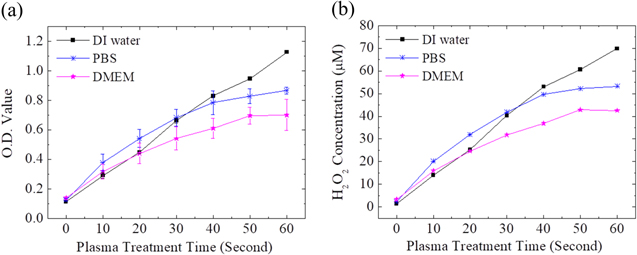
Figure 7. (a) The O.D. value of Amplex Red in different solutions treated by He-APPJ. Data are mean and SD values (n = 3). (b) The corresponding H2O2 concentration in different solutions treated by He-APPJ was calculated using the standard curve.
Download figure:
Standard image High-resolution imageRelationship between ·OH and H2O2 concentration in the solutions
The measurement methods used for ·OH and H2O2 measurement were different. The ·OH measurement chemical, TA, was added before plasma treatment, and thus, the ·OH produced in solution throughout the plasma treatment should be captured. By contrast, the H2O2 was measured by adding Amplex Red after the plasma treatment, and thus, only the H2O2 remaining in the solution was measured. However, the results show that approximately 70-μM H2O2 and 3-μM ·OH in DI water were measured after 60 s of He-APPJ treatment. The H2O2 concentration is much higher than ·OH concentration.
A possible reason why is that ·OH turns into H2O2 vary fast in the solution, as shown in Eq. 2; the reaction coefficient is about 7.7 × 10⁹ M−1 s−1.44 In addition, ·OH react with the ingredients in the PBS faster than H2O2. Hence, only part of ·OH in solution reacted with TA, making the measured ·OH concentration much lower than H2O2 concentration. Moreover, the lifetime of ·OH in the solution was approximately 0.25 ms.45 Therefore, the ·OH that remained and reacted with the cells in the solution was much less than the He-APPJ-generated ·OH.
Effect of O2 addition to working gas on ROS generation in the jet and solutions
The O2 can be used to produce intermediate in plasma and then generate ·OH. Hence, we added O2 into the He working gas and measured the 309 ·OH emission of free He-APPJ and ·OH concentration in He-APPJ treated DI water. Figure 8 shows the OES results in free He-APPJ with 0.1%, 0.2%, and 0.3% O2 addition. Compared to pure helium working gas, adding 0.1% O2 increased the emission signal of ·OH (309 nm); when the O2 was increased to 0.2% and 0.3%, the emission signal of ·OH was less than that of pure helium working gas. This might be because adding a small amount of O2 increased the possibility of O2 reacting with plasma. Therefore, as the possibility of O2 dissociation increased, as shown in Eq. 3, the ·OH generation increased because of O(1D) increase, as shown in Eq. 4. It results in the increase of emission signal of ·OH. Other studies also reported that adding few O2 (about 0.2% or less) into the working gas can increase the amount of O related species.14,46 However, in our self-built He-APPJ, when the O2 addition was further increased to 0.2% and 0.3%, the ·OH intensity decreased. This might be because O2 is electrophile and could thus absorb the electrons in the plasma. The reduction of electrons, which are needed in plasma generation, reduced the plasma intensity and the emission of generated ROS. Besides, the O3 concentration in our He-APPJ, even with O2 addition, is below the ozone meter's detection sensitivity (0.001 ppm).47,48


Figure 8. (a) Optical emission spectrum (200–400 nm) of the free He-APPJ with 0%, 0.1%, 0.2%, and 0.3% O2 addition. The OES probe was placed at 10 mm from the plasma nozzle outlet. (b) The OES intensity at 309 nm from free He-APPJ with different O2 addition percentages.
Download figure:
Standard image High-resolution imageIn addition, we exposed the DI water to plasma with different O2 addition percentages and measured the H2O2 concentration in the DI water. As shown in Fig. 9, the H2O2 concentration in DI water exposed to He-APPJ with 0.1% O2 addition was the highest, and that exposed to He-APPJ with pure helium gas was the second highest. The H2O2 concentration in DI water exposed to He-APPJ with 0.2% and 0.3% O2 addition decreased. This trend fits the ·OH emission intensity in He-APPJ with different O2 addition percentages, indicating that ·OH generated in the plasma jet should relate the H2O2 generation in the solution.
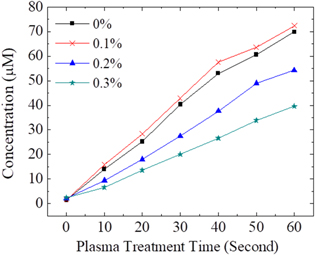
Figure 9. H2O2 concentration in DI water treated by He-APPJ with 0%, 0.1%, 0.2%, and 0.3% O2 addition.
Download figure:
Standard image High-resolution imageHe-APPJ treatment on MCF7 cells
Several studies have measured ROS in RPMI.17–19 Besides, H2O2 plays a key role for inactivation of cancer cell viability.49 Hence, under same plasma treatment condition, the H2O2 concentration in RPMI was measured and the corresponding effect on cancer cell viability was investigated in this study. The H2O2 concentration in He-APPJ-treated RPMI (Fig. 10) was close to that in He-APPJ-treated DMEM. Figure 11 shows the viability of MCF7 cells treated by He-APPJ direct exposure (DE) and by He-APPJ-treated RPMI medium (PTM). For 1 × 10⁴ cells, the viability of the cells treated by PTM and DE decreased. The viability of treated 5 × 10⁴ cells was higher than that of treated 1 × 10⁴ cells, and even enhanced during 20–40 s of treatment. The results show that the initial cell concentration affected the results considerably. This might be because the cells can reduce the ROS in the solution, and thus, the 5 × 10⁴ cells are less vulnerable to H2O2. Moreover, the results also suggest that the cell proliferation was stimulated during 20–40 s treatment, when the H2O2 concentration was about 40–50 μM at that time. Another study also reported similar result that endothelial-cell proliferation was enhanced by low dose plasma.5 On the other hand, a high concentration of ROS decreased the cell viability. The cell viability decreased for treatments longer than 50 s, when the H2O2 concentration was about 50 μM or higher with such treatment time.
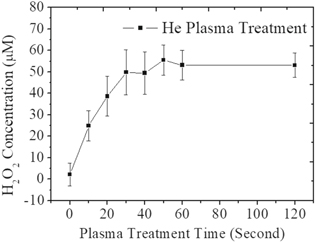
Figure 10. H2O2 concentration in RPMI treated by He-APPJ. Data are mean and SD values (n = 3).
Download figure:
Standard image High-resolution image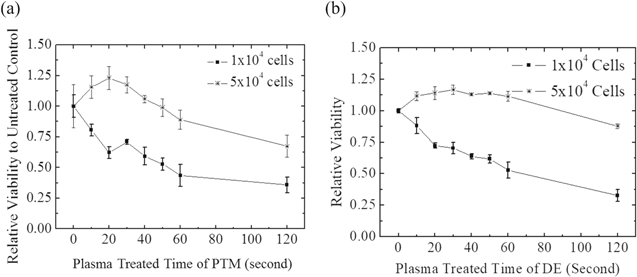
Figure 11. MTT assay of MCF7 cells treated with (a) plasma-treated RPMI medium and (b) direct exposure. After plasma treatment, the MCF7 cells were cultured for 24 h and the viability was measured. Data are mean and SD values (n = 3).
Download figure:
Standard image High-resolution image
Conclusions
This study investigated the H2O2 and ·OH generated with our self-built He-APPJ, above surfaces of plasma–treating solution, and in different solutions. The OES results show that the ·OH and N2 emission intensity increased after He-APPJ reacted with ambient air. The ·OH intensity above surfaces of plasma–treating solution was higher than that in free jet. In addition, the difference in ·OH intensity above surfaces of plasma–treating solution of different solutions might result from the different conductivities of the solutions. In the plasma treated solutions, the ·OH concentration can be influenced by the ingredients. The H2O2 can also react with the ingredients in the solutions, so the H2O2 concentration in high to low order was DI water, PBS, and DMEM. When the H2O2 concentration increases in the PBS and DMEM, the H2O2 might react with Cl− ions. Therefore, the increase rate of H2O2 concentration decreased. By contrast, the H2O2 concentration in DI water increased linearly. In our experimental setup, 0.1% O2 addition generated the strongest ·OH emission and also the highest H2O2 concentration in DI water. This might indicate that the H2O2 concentration in solution could relate to the ·OH. The cells cultured with lower cell density were more vulnerable to H2O2 than those cultured with higher cell density. This study investigated the effects of solutions on ROS generation. These results can be used for choosing the solution for PTM and adjusting the ROS concentration in PTM for future cell culture and clinical applications.
Acknowledgments
This work was supported by the Ministry of Science and Technology, Taiwan [grant numbers 107-2221-E-009-073, 2018].