Abstract
Recent work describing the use of high precision coulometry combined with isothermal heat flow calorimetry has shown promise in studying electrolyte reactivity in Li-ion batteries. In this paper we describe what we term an "integration/subtraction" technique for determining the electrolyte reactivity as a function of cell voltage in Li-ion full pouch cells. We apply this method to the characterization of a base electrolyte blend of ethylene carbonate and ethyl methyl carbonate (EC/EMC 3/7 w/w) with 1 M LiPF6. We then show how the parasitic thermal power and coulombic efficiency are affected by the addition of the reactive carbonates vinylene carbonate and 1-fluoro-ethylene carbonate to the base electrolyte. We show how this method can discriminate the effectiveness of additives used in Li-ion cells as a function of cell voltage and cycle life.
Export citation and abstract BibTeX RIS

This is an open access article distributed under the terms of the Creative Commons Attribution 4.0 License (CC BY, http://creativecommons.org/licenses/by/4.0/), which permits unrestricted reuse of the work in any medium, provided the original work is properly cited.
Li-ion cell technology has reached a level of maturity witnessed by the pervasive applications of the energy storage technology in everything from cell phones to electric vehicles. However there will always be a need and desire to achieve higher energy density, longer cycle life and better safety. Inevitably the cell electrolyte chemistry is a key factor in achieving these goals. Presently there is considerable effort applied to higher voltage Li-ion cells utilizing different positive electrodes. There is also considerable effort being applied to the incorporation of silicon and silicon-based materials into the negative electrode to increase cell energy density. In these examples the electrolyte chemistry and its stability are critical concerns. Therefore techniques or tools that enable sensitive measurement and discrimination of different electrolyte chemistries are very useful and important. For example, cell chemistries beyond Li-ion, such as Li-air, Li-S or Mg-based cell chemistries will rely on unique passivating layers that attempt to protect the reactive metal electrode. Sensitive thermal techniques that can measure the heat produced by irreversible electrolyte reactions with highly reducing or oxidizing electrodes will be important in determining the effectiveness of engineered passivation layers.
Recently Dahn and co-workers have shown how isothermal heat flow calorimetry can be used to discriminate the effects of electrolyte additives in Li-ion cells.1 They also demonstrated a strong voltage dependence on the parasitic thermal power; it increases significantly at higher voltages due to electrolyte oxidation.1 In their method, a mathematical model was developed and fit to experimental thermal data. By simultaneously fitting multiple experimental datasets obtained at different currents, the authors were able to separate the parasitic thermal power from the total cell thermal power. While the method described in the present paper, which we term "integration/subtraction", also discriminates parasitic thermal power from the total thermal power, we also simultaneously acquire useful coulombic efficiency data as well as other cell parameters.
In an earlier publication we described a method for extracting the parasitic thermal energy per cycle from the total cell thermal energy per cycle using symmetric coin cells of graphite and Li4Ti5O12.3 In that work, the cell's energy hysteresis over one full cycle is subtracted from the total thermal energy over a full cycle as measured with the calorimeter. We term this method the integration/subtraction method for convenience. In this paper we extend this method to Li-ion full pouch cells with capacities of approximately 250 mAh. We arrive at an average parasitic thermal power for each of a series of narrow voltage ranges. The effect of vinylene carbonate (VC) and 1-fluoro-ethylene carbonate (FEC) as additives to a base electrolyte on parasitic thermal power is shown.
Experimental
Machine wound pouch cells were used in this work. They were obtained from LiFUN Technology (Xinma Industry Zone, Golden Dragon Road, Tianyuan District, Zhuzhou, City, Hunan Province, PRC, 412000) as sealed dry cells with a nominal capacity of 250 mAh. The negative electrode in these cells is an artificial graphite and the positive electrode was a high voltage LiCoO2. Table I lists the detailed cell information. The cells were balanced to a 4.4 V charge voltage. The cells were first opened in a dry room and then dried at 70°C under vacuum overnight. The cells were then filled with 0.9 g of electrolyte in a dry room with an operating dew point of −50°C. The cell filling procedure employed brief, periodic vacuum degassing in order to allow the electrolyte to access all void volume within the cell's electrodes. The weight before and after the electrolyte filling procedure was recorded in order to ensure the weight of electrolyte added to each cell was consistent. The pouch cell was then sealed under vacuum in a MSK-115A vacuum sealing machine (MTI Corp.) The cells were allowed to stand for 24 hours prior to cycling to ensure complete wetting, no charge was applied during standing.
Table I. Cell information.
| Parameter | Anode | Cathode |
|---|---|---|
| Active material | Artificial graphite | LiCoO2 |
| Active Percent | 96% | 97% |
| Active area (cm2) | 113.1 | 103.7 |
| Coating weight (mg/cm2) | 9.8 | 17.7 |
| Single-sided thickness (μm) | 74 | 35 |
| Nominal porosity (%) | 30% | 20% |
| Collector | Copper | Aluminum |
| Collector thickness (μm) | 12 | 23 |
The base electrolyte used in this work was 1 M LiPF6 in a 3/7 (w/w) blend of ethylene carbonate (EC) and ethyl methyl carbonate (EMC) obtained from BASF and used as received. VC (Novolyte) and FEC (BASF) were also used as received. All solvents, salts and blends were stored in an argon glove box located within a dry room. Table II lists the cells and electrolytes used as well as the corresponding IDs used in the figures and text.
Table II. Electrolytes and corresponding IDs of the graphite/LCO pouch cells. All ratios and percentages are by weight.
| Cell IDs | Electrolyte |
|---|---|
| E37-c1, E37-c2, E37-c3, E37-c4 | EC/EMC 3/7 |
| E37-2VC-c1, E37-2VC-c2, E37-2VC-c3 | EC/EMC 3/7 + 2%VC |
| E37-2FEC-c1, E37-2FEC-c2 | EC/EMC 3/7 + 2%FEC |
| E37-10VC-c1 | EC/EMC 3/7 + 10%VC |
| E37-10FEC-c1 | EC/EMC 3/7 + 10%FEC |
Current Source
Keithley 2602A source-measure units were used to charge and discharge the cells. This equipment is capable of supplying currents in the 10 mA range with an accuracy of ±0.03% + 6 μA with a resolution of 200 nA. The voltage measurement accuracy is ± 0.015% + 1 mV with 10 μV resolution in the 6 V range. Time resolution is < 1 sec. This precision allows the measurement of the coulombic efficiency to within ±0.02%.
Isothermal Heat Flow Calorimeter
The heat flow calorimeter is a TAM III (Thermally Activated Module, TA Instruments) in which 12 calorimeters were inserted. The temperature used throughout this work was 37°C. The TAM III is capable of controlling the bath temperature to within a few micro-degrees centigrade. Reference 3 describes the method and modifications made to the TAM III to allow in-operando calorimetry measurements on Li-ion cells.
The thermal stability of the instrument with these modifications was described in an earlier paper.3 A difference noted in this work compared to the earlier work using coin cells was the observation of "cross talk" between the calorimeters. In coin cell work typically a few dozens to 100 μW of thermal power is produced by a cell. The 250 mAh pouch cells typically could produce 5 to 6 mW. This cross talk affected the overall baseline stability in some calorimeters but the effect was no more than several μW.
A four-wire configuration was used to supply charging and discharging currents. In contrast to our earlier work using coin cells the wiring through the lifters to the pouch cell was different. In charging and discharging the pouch cells, 20 mA was typically used which was nominally a C/11 rate. While the four wire configuration will compensate the voltage drop for the lead resistance there is no compensation for the resistive heating that will occur in the current-carrying leads. The resistive heating of our initial 32 AWG current-carrying leads was being registered by the TAM and we therefore replaced them with 14 AWG wire coated with a polyimide resin. In order to ensure the lead wires did not produce heat at the current levels used in this work the four leads were shorted together and placed into the calorimeter and various currents up to 50 mA were applied and the thermal power recorded. At 20 mA the heat flow was negligible.
Internal calibration of individual calorimeters is provided in the as received equipment but we modified this procedure to better duplicate the response of the cell under measurement. The general calibration procedure was described earlier for coin cells.3 In this work the procedure was very similar with the exception of using a calibration cell that was fabricated by embedding a 250 Ω precision resistor in a dry pouch cell containing the flat wound jelly roll. Typically a current of 3 mA was applied to the calibration cell producing a thermal power of 2.25 mW. The calorimeter gain was then set to this value. The baseline or zero heat configuration was set by inserting a calibration cell and allowing approximately 24 hours for thermal stabilization. The baseline was then set to zero heat flow. In a previous publication we reported an error of +/−1 μW for measurements done on coin cells.3 In the present paper, where the heat flow is much greater and the measurement time much longer, we compared the stability of the baseline thermal power of calibration cells. For example; the calorimeter baseline was measured before and after a measurement of a pouch cell and the variation or drift of the baseline was used as an error in the thermal power. We found that the baseline stability was 5 μW or better between measurements. This is greater than what we found with coin cells and this appears to be the result of the much longer times between baseline calibrations, which could be as long as one month when measuring a large number of voltage segments on pouch cells, and possibly the change from 32 AWG to 14 AWG current leads.
Methods and Cycling Protocol
The treatment of data to arrive at a parasitic energy by this method has been described in detail earlier.3 Here we briefly describe the methods and variations used in the present work.
Equation 1 describes the sources of heat flow in a full cell with intercalation electrodes.
![Equation ([1])](https://content.cld.iop.org/journals/1945-7111/164/4/A889/revision1/d0001.gif)
When a cell is charged or discharged the total heat flowing into or out of the battery is a result of: 1) entropy changes occurring in the intercalation materials, or reversible heating, which is given as the first term in Eq. 1 multiplied by the rate of change in the intercalant, 2) all sources of polarization (e.g. contact resistance, charge transfer resistance, electrolyte resistance and diffusional impedance) which is given as the last term in Eqs. 1, and 3) parasitic reactions occurring within the cell originating from, for example, reduction or oxidation of electrolyte components. This is given by dQp/dt in Eq. 1. The term dQ0/dt represents the calorimeter baseline heat flow.
Our objective is to eliminate the reversible as well as joule heating to arrive at a value for the parasitic thermal power. In the method used here, which is different than that used by Downie,2 the reversible heating is eliminated by integrating the total thermal power from the cell with respect to time over a full cycle to yield a thermal energy for that cycle. If the reversibility of the cycle is greater than 99% the reversible heating will cancel to a good approximation. The result is a thermal energy for that cycle composed of joule heating and parasitic reaction heat. All sources of joule heating, as described above, will be reflected by the area between the charge and discharge curve as described earlier.3 By integrating the voltage hysteresis in a plot of voltage versus capacity the joule heating from that cycle can be determined. Subtracting the thermal energy from polarization sources from the result of integrating the thermal power with respect to time gives the parasitic thermal energy for that cycle. Equation 2 shows the method used.
![Equation ([2])](https://content.cld.iop.org/journals/1945-7111/164/4/A889/revision1/d0002.gif)
Equation 2 yields a parasitic thermal energy which we can convert to an average parasitic thermal power by dividing the parasitic thermal energy, Qp, by the total cycle time (tc + td). Assuming constant currents, the average parasitic thermal power ( ) obtained with the integration/subtraction can be succinctly stated as:
![Equation ([3])](https://content.cld.iop.org/journals/1945-7111/164/4/A889/revision1/d0003.gif)
where  is the average calorimeter power across charge and discharge, I is current,
  is average voltage, t is time and the c and d subscripts correspond to charge and discharge respectively. Assuming perfect coulombic efficiency and charge/discharge currents of identical magnitude, one gets the approximation in Eq. 3, which can be directly compared to Eq. 1 since
  when averaged over a full cycle.
Cycling Protocol
Downie and co-workers used narrow voltage range cycling of full cells to explore the voltage dependence of parasitic thermal power.1,2,4 We also apply narrow voltage segments. In a typical experiment the cells are cycled 10 times between the voltages of 3.0–3.8, 3.5–3.8, 3.6–3.9, 3.7–3.9, 3.8–4.0, 3.9–4.1 and 4.0–4.25. The current for all cycles was 20 mA, nominally a C/11 for a full voltage range of 3.0–4.25 V. Ten cycles per voltage segment resulted in a nominally stable coulombic efficiency and average parasitic thermal power for a given voltage segment as will be shown and discussed below. The last cycle was used to construct a plot of parasitic thermal power versus average voltage. After the ten cycles were completed the cell was left in an open circuit condition for 12 hours before proceeding to the next voltage segment. We note that in the method we use here coulombic efficiency, or inefficiency, is simultaneously collected with the thermal data for each voltage segment.
Results
As noted above, cells were cycled in multiple limited voltage ranges. Figure 1 shows how the limited voltage segments overlay perfectly on the full range voltage curve, indicating excellent reversibility in cell E37-c1. Similarly excellent reversibility was found for all other cells in this study. Figure 2 shows overlays of narrow range cycling and full range cycling for the voltage and thermal measurements obtained with cell E37-2VC-c2. Four different narrow ranges are exemplified and, as in Fig. 1, there is a very good match between the narrow and full range voltage curves. Figure 2 also shows that the same is true for the thermal data and that the entropic and parasitic reaction are to a large extent identical for narrow range and full range cycling. The conclusions reached with the narrow range cycling should therefore be broadly applicable to cells undergoing full range cycling.
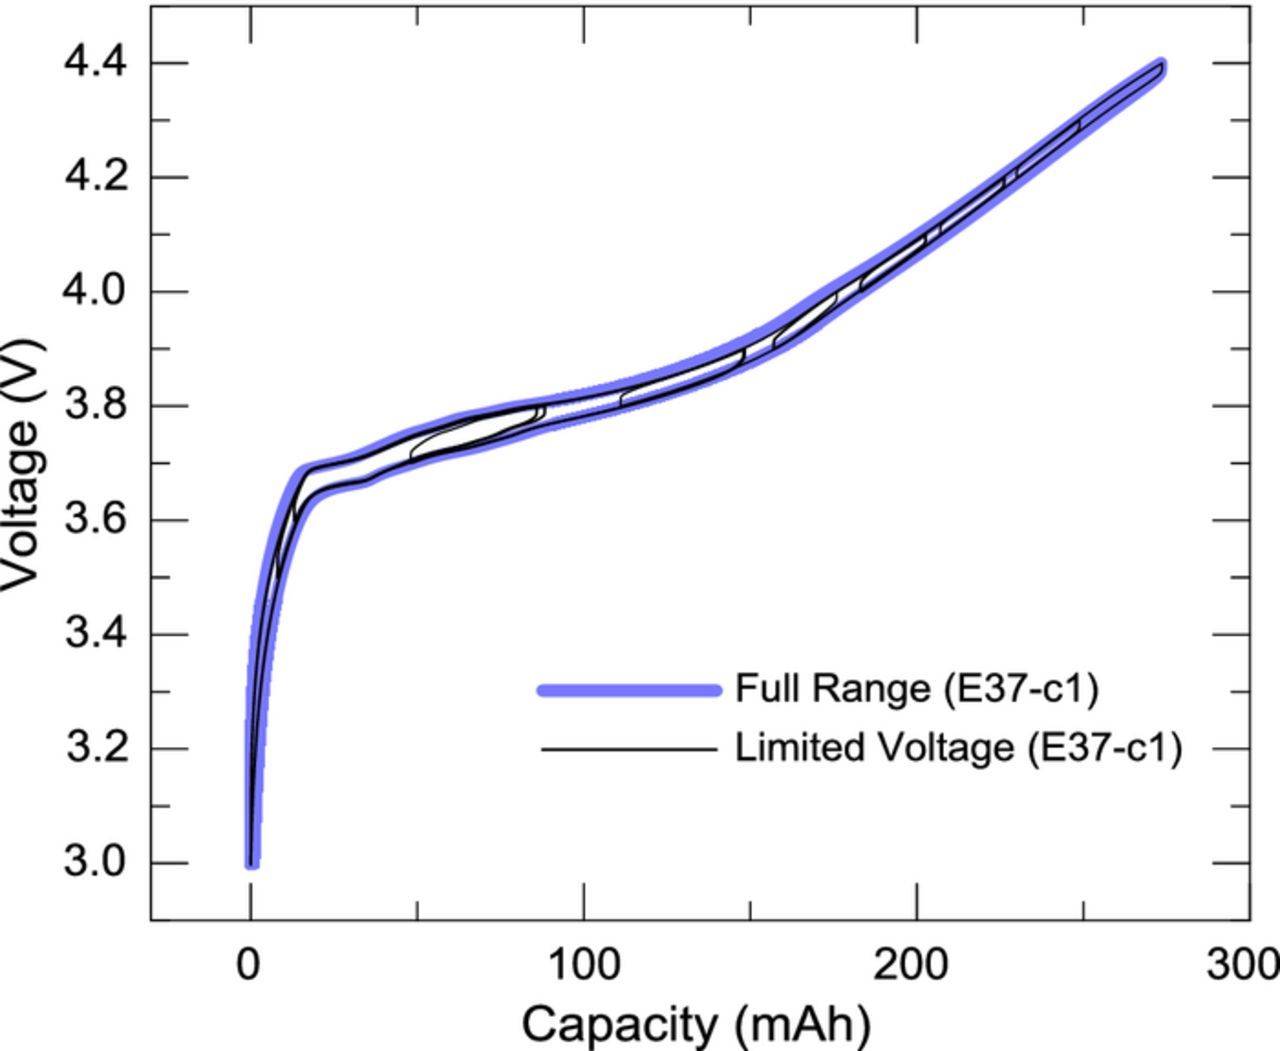
Figure 1. Overlay of limited voltage and full voltage curves for cell E37-c1.
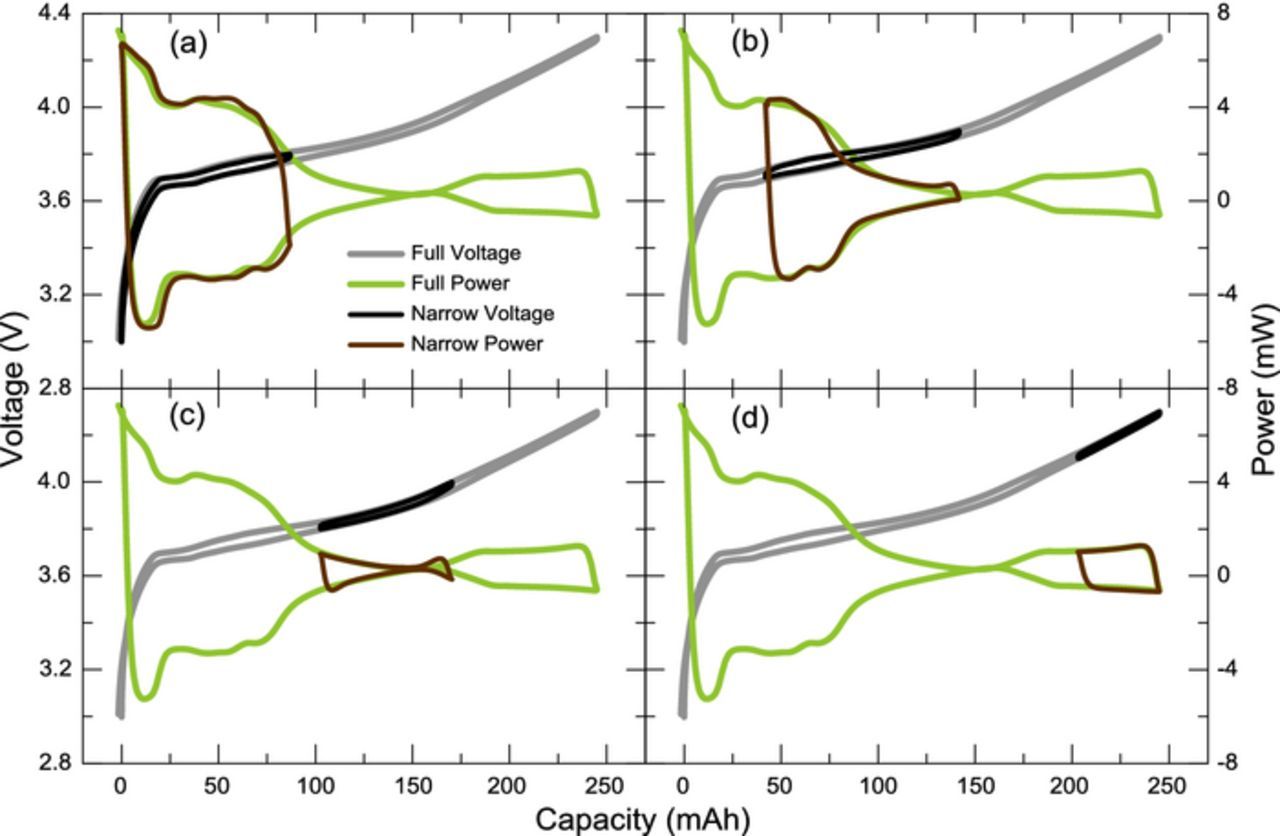
Figure 2. Overlay of narrow cycling and full range cycling for the voltage and thermal measurements for cell E37-2VC-c2. Ranges exemplified are (a) 3.0 V–3.8 V, (b) 3.7 V–3.9 V, (c) 3.8 V–4.0 V, and (d) 4.1 V–4.3 V.
The source of the pouch cells used in this work was the same source used by Dahn and co-workers in a series of recent publications.1,2,4 They noted that the negative electrode has an overhang of 1.5 mm, or is 3.0 mm wider than the positive electrode in these pouch cells. In our cells the overhang was 1.0 mm. This overhang becomes either a reservoir of Li+ or a sink for Li+ depending upon the state of charge and the direction (charge or discharge) one is attempting when cycling the cell. The result of this overhang is a slow equilibration of the state of charge as Li+ can either diffuse into the overhang region or diffuse out of the overhang region. The above references suggest that the complete equilibration of the state of charge from mass transport processes could require 1000 hours.5 Ideally this overhang should be minimized and the speed of the measurement, or the number of cycles required to reach a stable CE or dQ/dt, would be less. While our overhang is less than that of Dahn and co-workers we still observe the effects of this overhang. Thus the 10 cycles at each voltage segment represents a compromise between time and the stability of the CE and parasitic thermal power. Ten cycles typically requires almost 4 days (∼96 h) of cycling for some voltage segments. Figures 3a and 3b show the parasitic thermal power and CE respectively for 10 cycles for cell E37-c2 cycling between 3.8 V and 4.0 V and between 4.0 V and 4.2 V. This cell was cycled 10 times at room temperature between the limits of 3.0 V and 4.25 V prior to inserting into the TAM. Note that while the CE and parasitic thermal power (dQ/dt) are not completely stable, the changes near the end of the 10 cycles become small. The average thermal power for the voltage segment 3.8 V–4.0 V changes by only 2 μW (2%) from cycles 5 to 10 and the change for the 4.0 V–4.2 V voltage segment was 16 μW or about 6%. The 10th cycle for each voltage range measured was then used in a plot of parasitic thermal power versus average voltage.
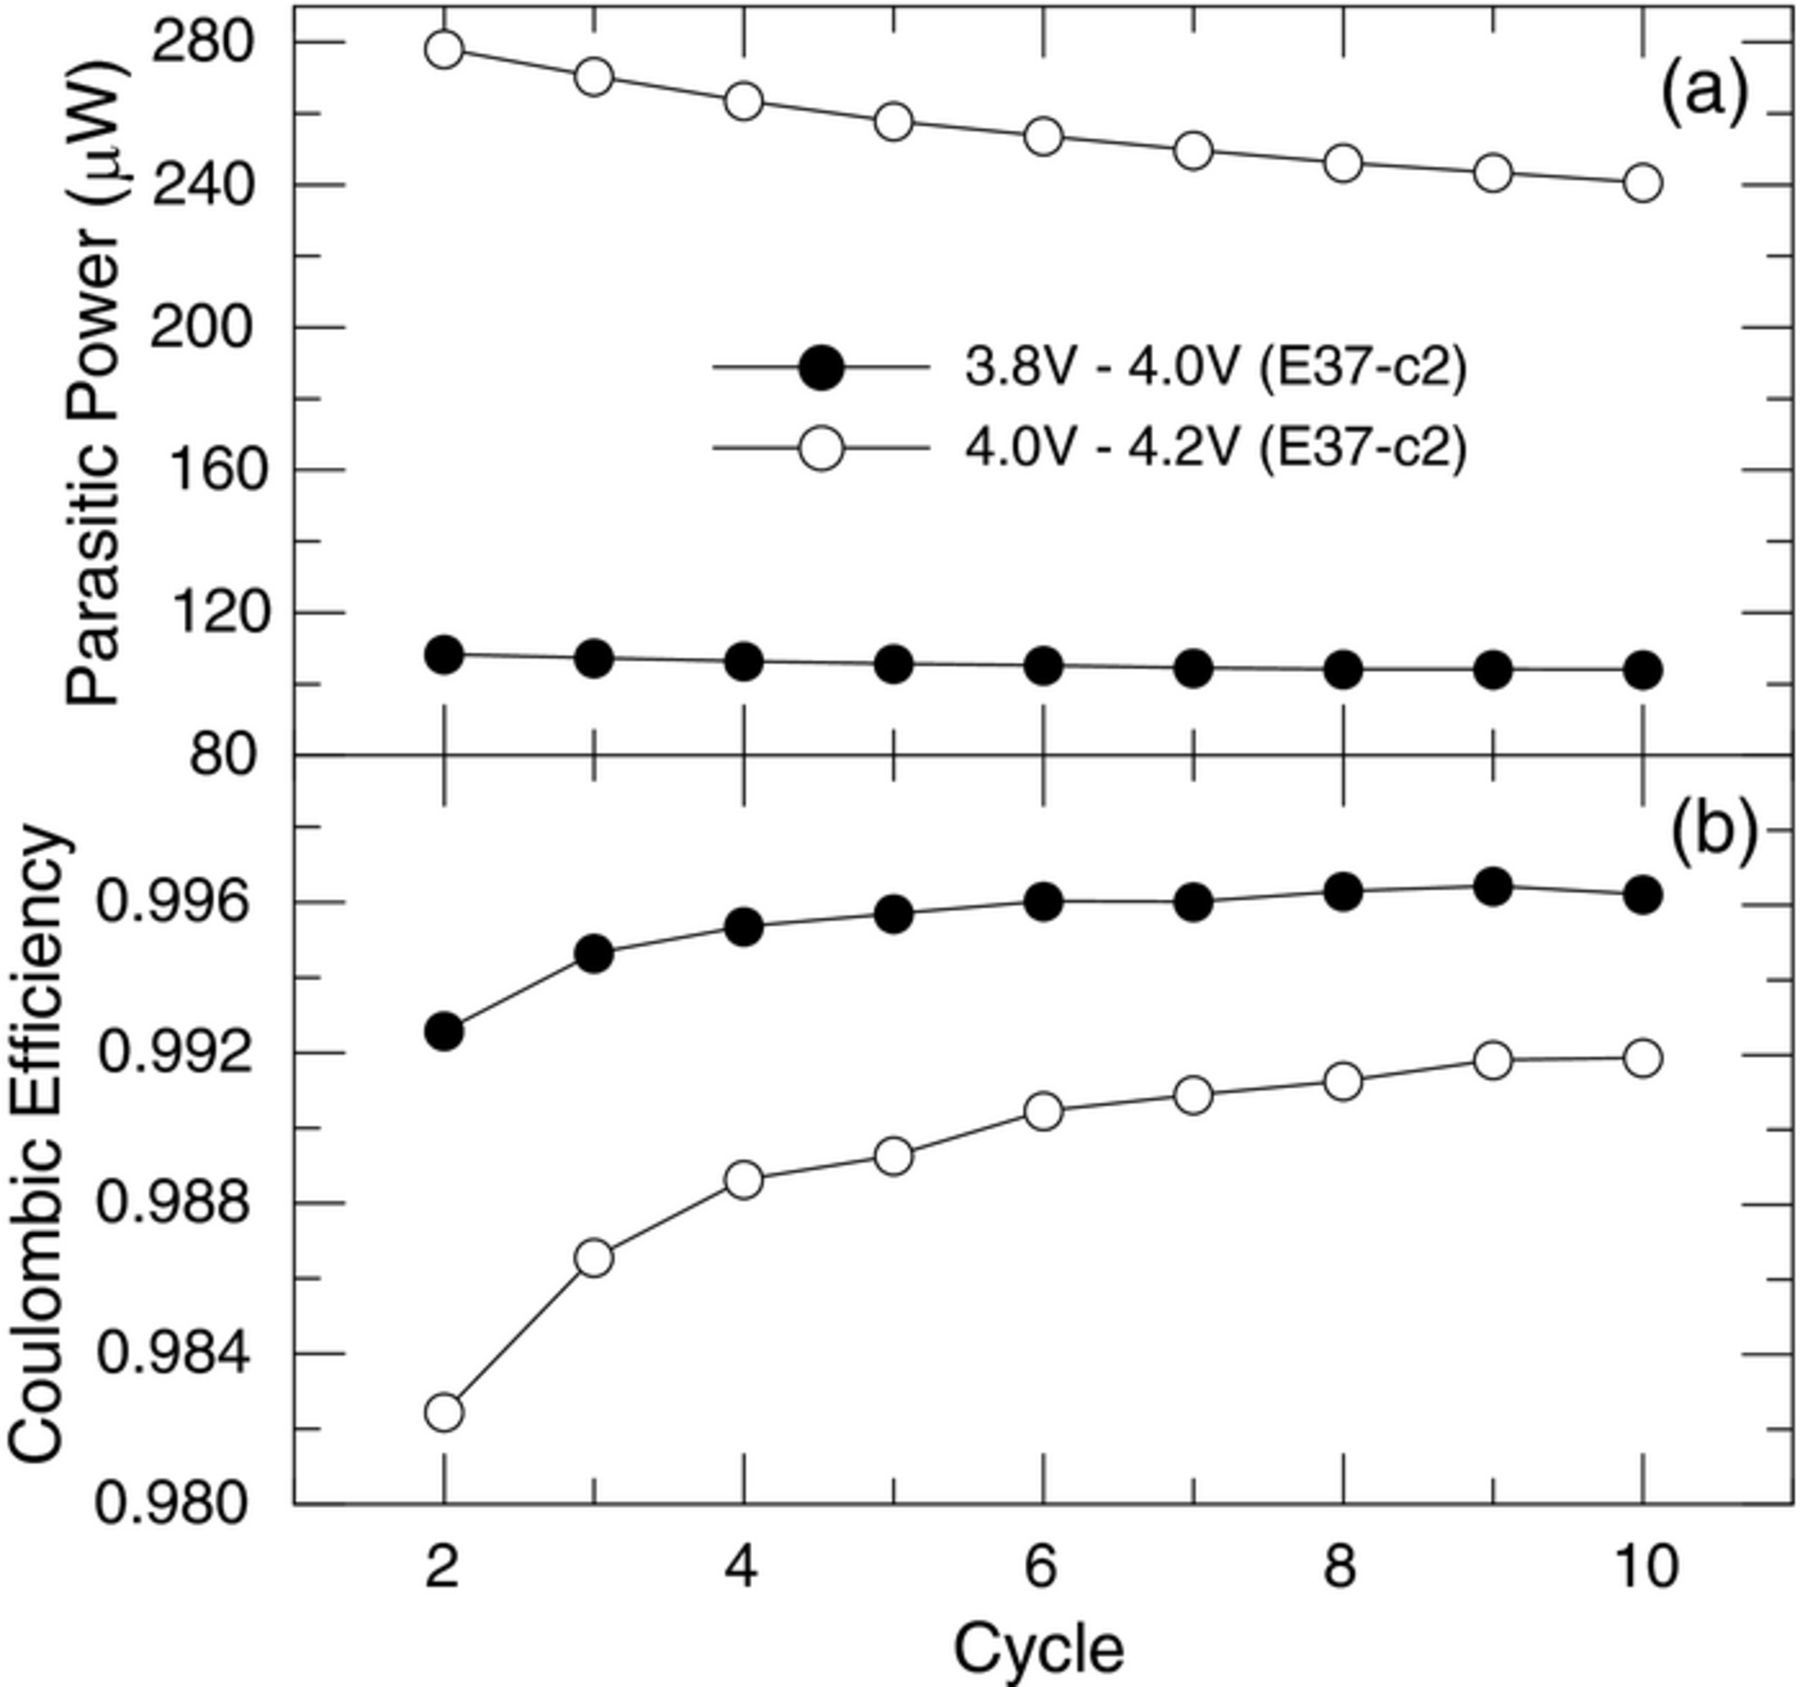
Figure 3. (a) Parasitic thermal power and (b) coulombic efficiency versus cycle number for cell E37-c2 cycled in the 3.8 V–4.0 V and 4.0 V–4.2 V ranges.
Figure 4 shows the average parasitic thermal power and coulombic inefficiency (CIE, calculated as 1-CE) as a function of average voltage for cells E37-c1 and c2. For each of the narrow voltage segments, the cell is cycled 10 times and on the last cycle the average parasitic power is calculated by using the integration/subtraction method with the energy hysteresis of the cell and the thermal data of the calorimeter. The parasitic power and CIE is reported using the average voltage of the narrow voltage segment for clarity. A very clear trend of increasing parasitic power and CIE with increasing voltage is found. Each cell had been cycled 10 times from 3.0 V–4.25 V at room temperature at 20 mA before being inserted into the calorimeter at 37°C. The large circles in both plots correspond to a full cycle (3.0 V–4.25 V) completed after the narrow voltage segments. The agreement between the narrow range voltage segments and the full voltage range in both parasitic power and CIE underscores the voltage dependence of the parasitic thermal power and fidelity of the measurement.
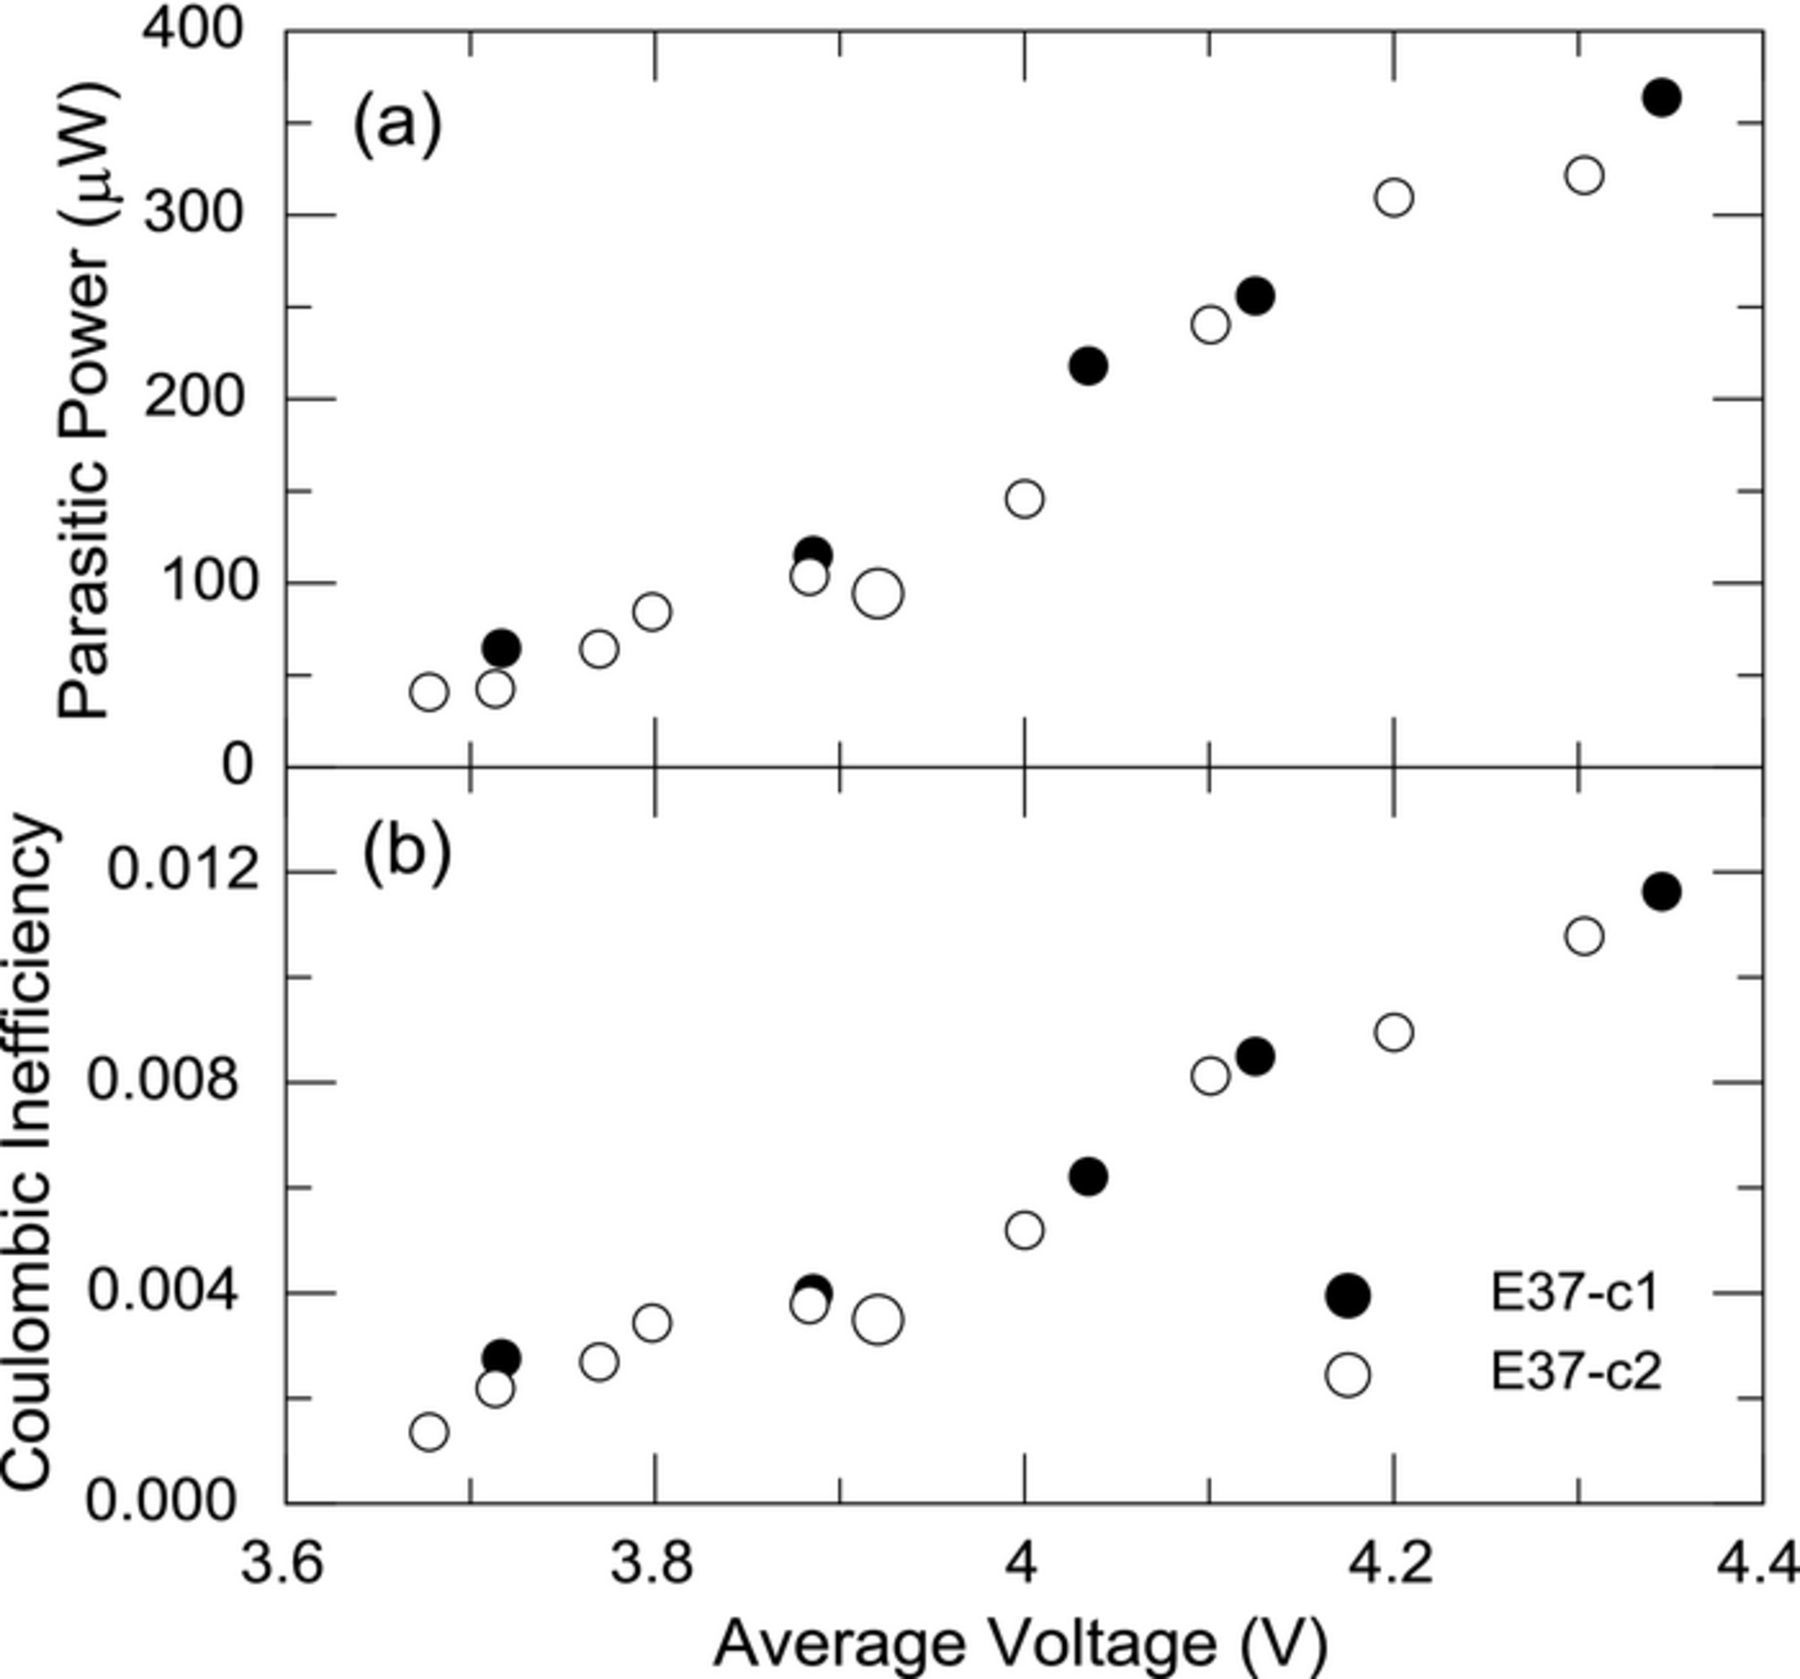
Figure 4. (a) Average parasitic thermal power and (b) coulombic inefficiency for cells E37-c1 and E37-c2 cycled in narrow voltage ranges plotted as a function of the average voltage of the narrow cycling range. The larger circle corresponds to a full voltage range cycle (3.0 V–4.25 V).
Equation 1 states the parasitic power ( ) without any explicit dependence on current or voltage. As detailed in this manuscript, the average parasitic power has a strong dependence on voltage. It is therefore of interest to determine whether a dependence on current is found experimentally. Figures 5a and 5b show plots of average parasitic thermal power and CIE respectively as a function of voltage at two different currents, 10 mA and 20 mA, for control cell E37-c4. The cell was cycled for 50 cycles (30 mA, 3.0 V–4.25 V) at room temperature (RT), then underwent narrow range cycling in the calorimeter, returned to RT for another 50 cycles, then finally placed in the calorimeter for narrow range cycling with currents alternating between 10 mA and 20 mA. Figure 5a shows the average parasitic thermal powers at a given average voltage are practically identical for both currents. The absence of dependence on current is consistent with previous high precision coulometry studies, which showed the CE (or CIE) of cells as being time dependent as opposed to cycle (or current) dependent. Figure 5b shows the CIE is indeed different across currents since the time spent in a cycle is directly proportional to the current.
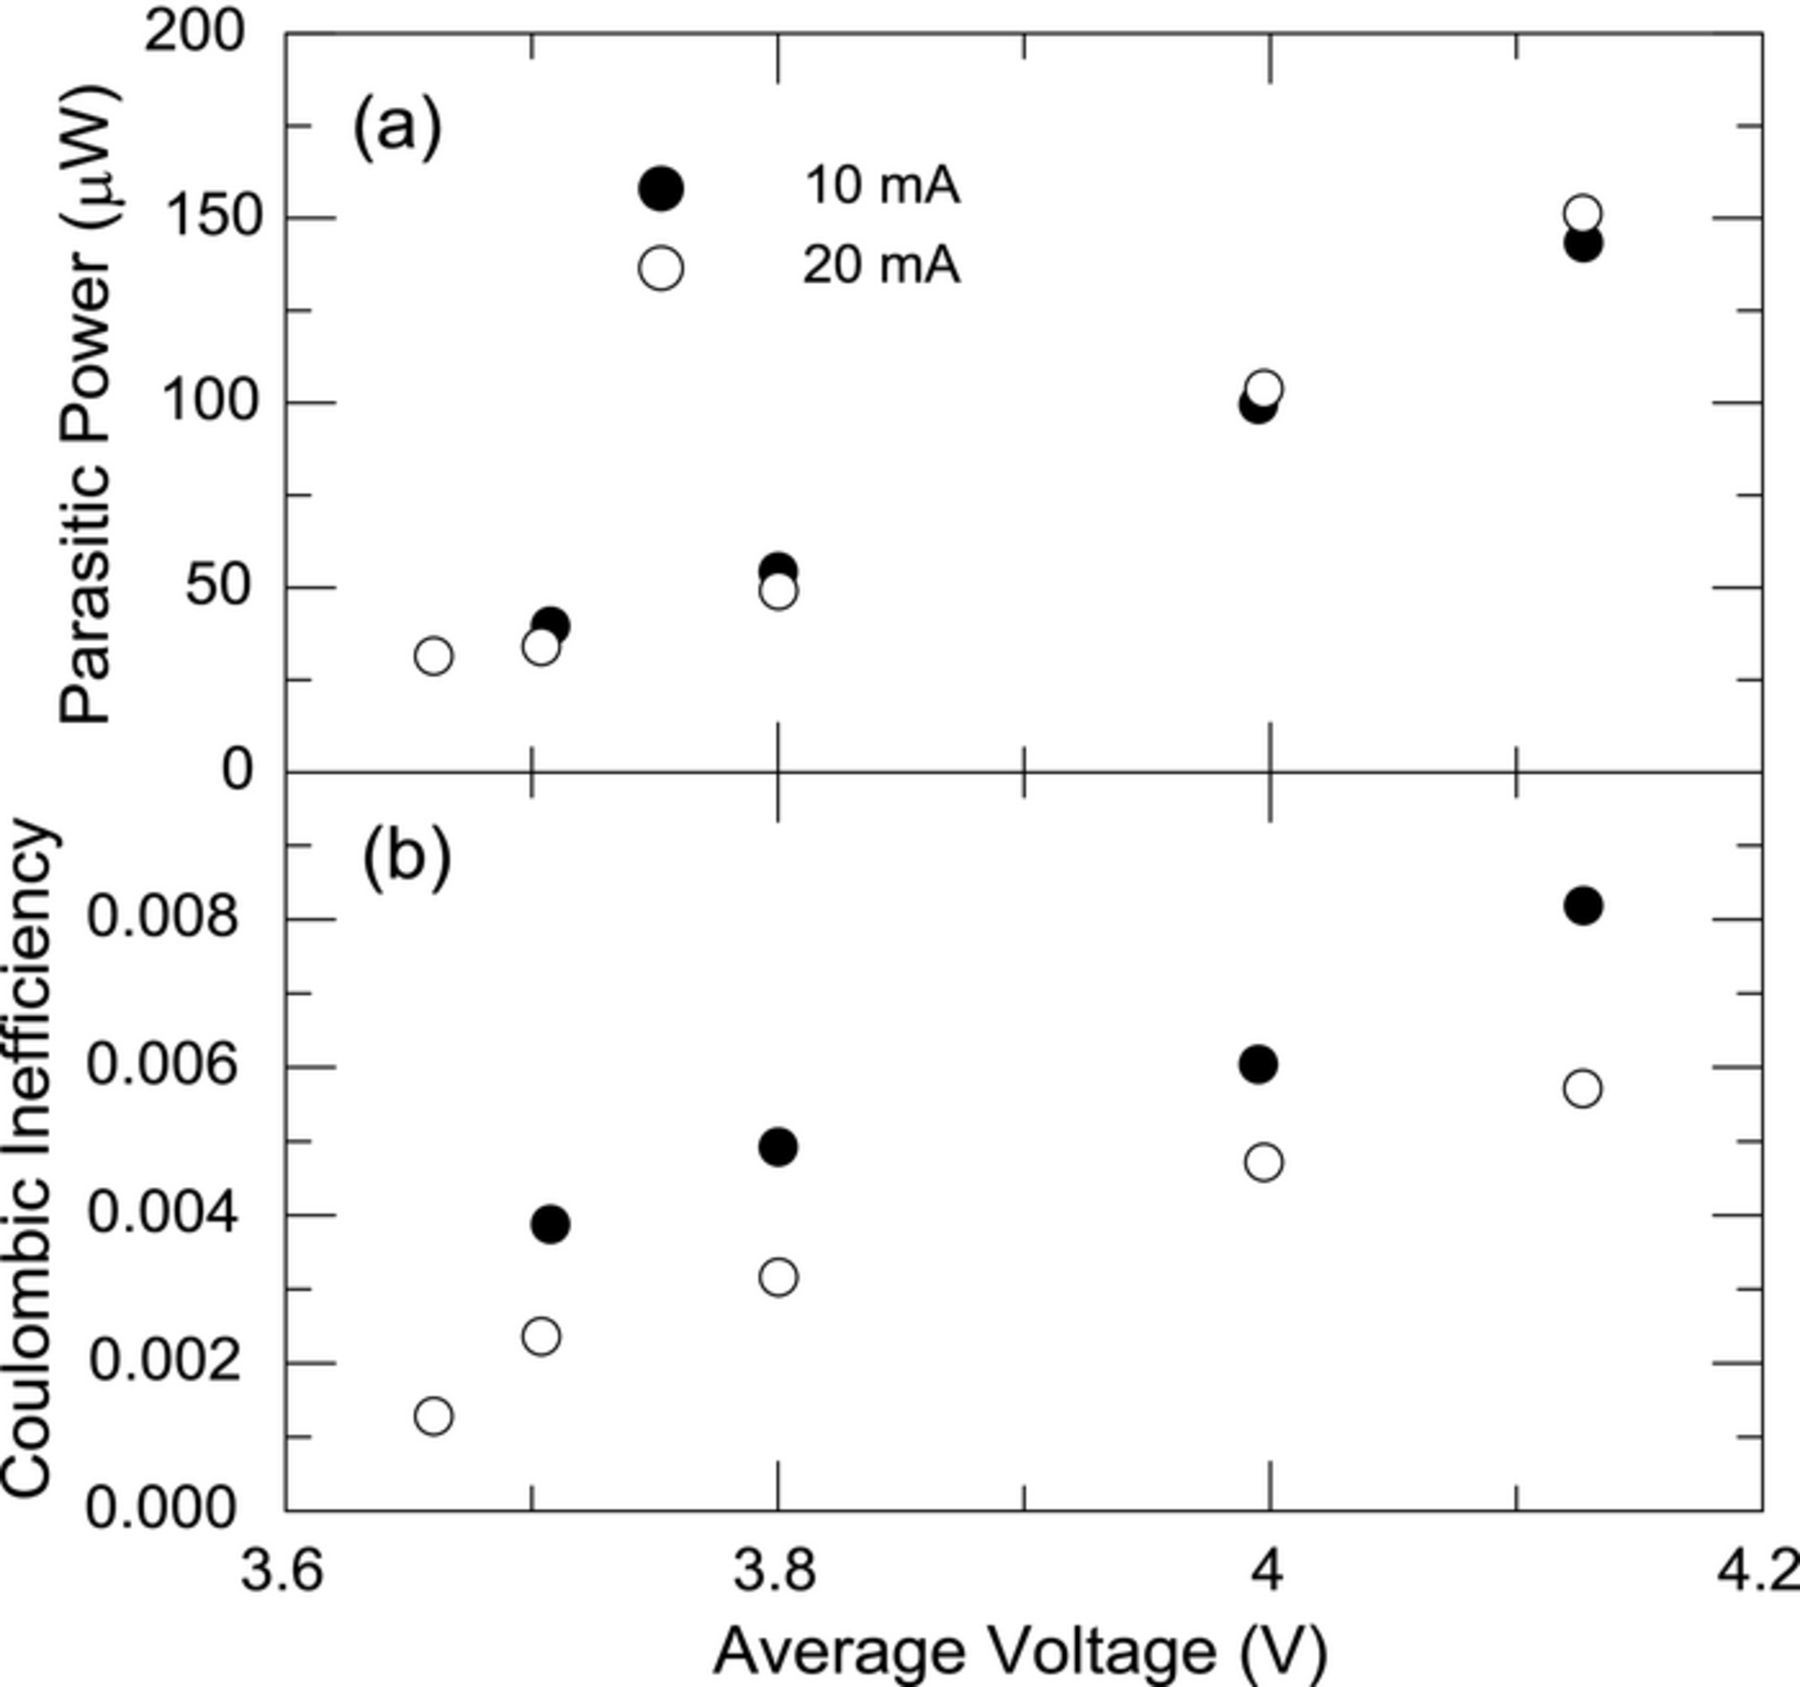
Figure 5. (a) Average parasitic thermal power and (b) coulombic inefficiency for cell E37-c4 cycled in narrow voltage ranges at two different rates as indicated in the legend. See text for cycling history of the cells.
The data in Figure 5 was acquired from a control cell having undergone a number of narrow cycles at 37°C and 100 cycles at RT and thus considered a cell with relatively stable electrode passivation layers. Performing the same experiment without precycling the cells could have resulted in misleading results due to the faster decay of parasitics in the early cycles and the time required to perform the experiment. Even after precycling the cells, the decay of parasitics with passivation could lead to differences across currents if the currents were sufficiently small (and therefore the times sufficiently long).
Vinylene carbonate (VC) is a well-established electrolyte component in Li-ion cells6,7 and has been shown to affect cycle life and capacity retention. The function of VC in the cell is less clear with some authors suggesting its activity is centered on the negative electrode and others indicating the benefit is on the SEI formed at the positive electrode.6,7 Figure 6a shows the parasitic thermal power of cells with VC (E37-2VC-c1, 2) and without (E37-c1, 2) cycled in narrow voltage ranges. Figure 6 shows a dramatic difference in the parasitic power and CIE, especially in the higher voltage regions, suggesting the function of VC is also to provide passivation of the positive electrode. A nearly five-fold decrease in parasitic power is observed at the average cell voltage of 4.2 V. In a previous paper we used CE data to calculate an apparent reaction enthalpy from symmetric cells. When using symmetric cells, where both electrodes are the same and therefore the electrolyte reactions are the same, this approach is feasible and represents an "aggregate reaction enthalpy" of all the irreversible electrolyte reactions. In the present case this is not possible as it is expected that the parasitic reactions on the positive electrode are much different than those occurring on the negative electrode. Furthermore, materials produced at one electrode may have enough solubility to be transported from one electrode to the other. In the present work we only regard CE, or CIE, as a correlation factor. That is, if the cell experiences an increase in parasitic power and the increase in parasitic power is associated with the loss of lithium then an increase in CIE is expected. Inspection of Figures 6a and 6b show this correlation to be true.
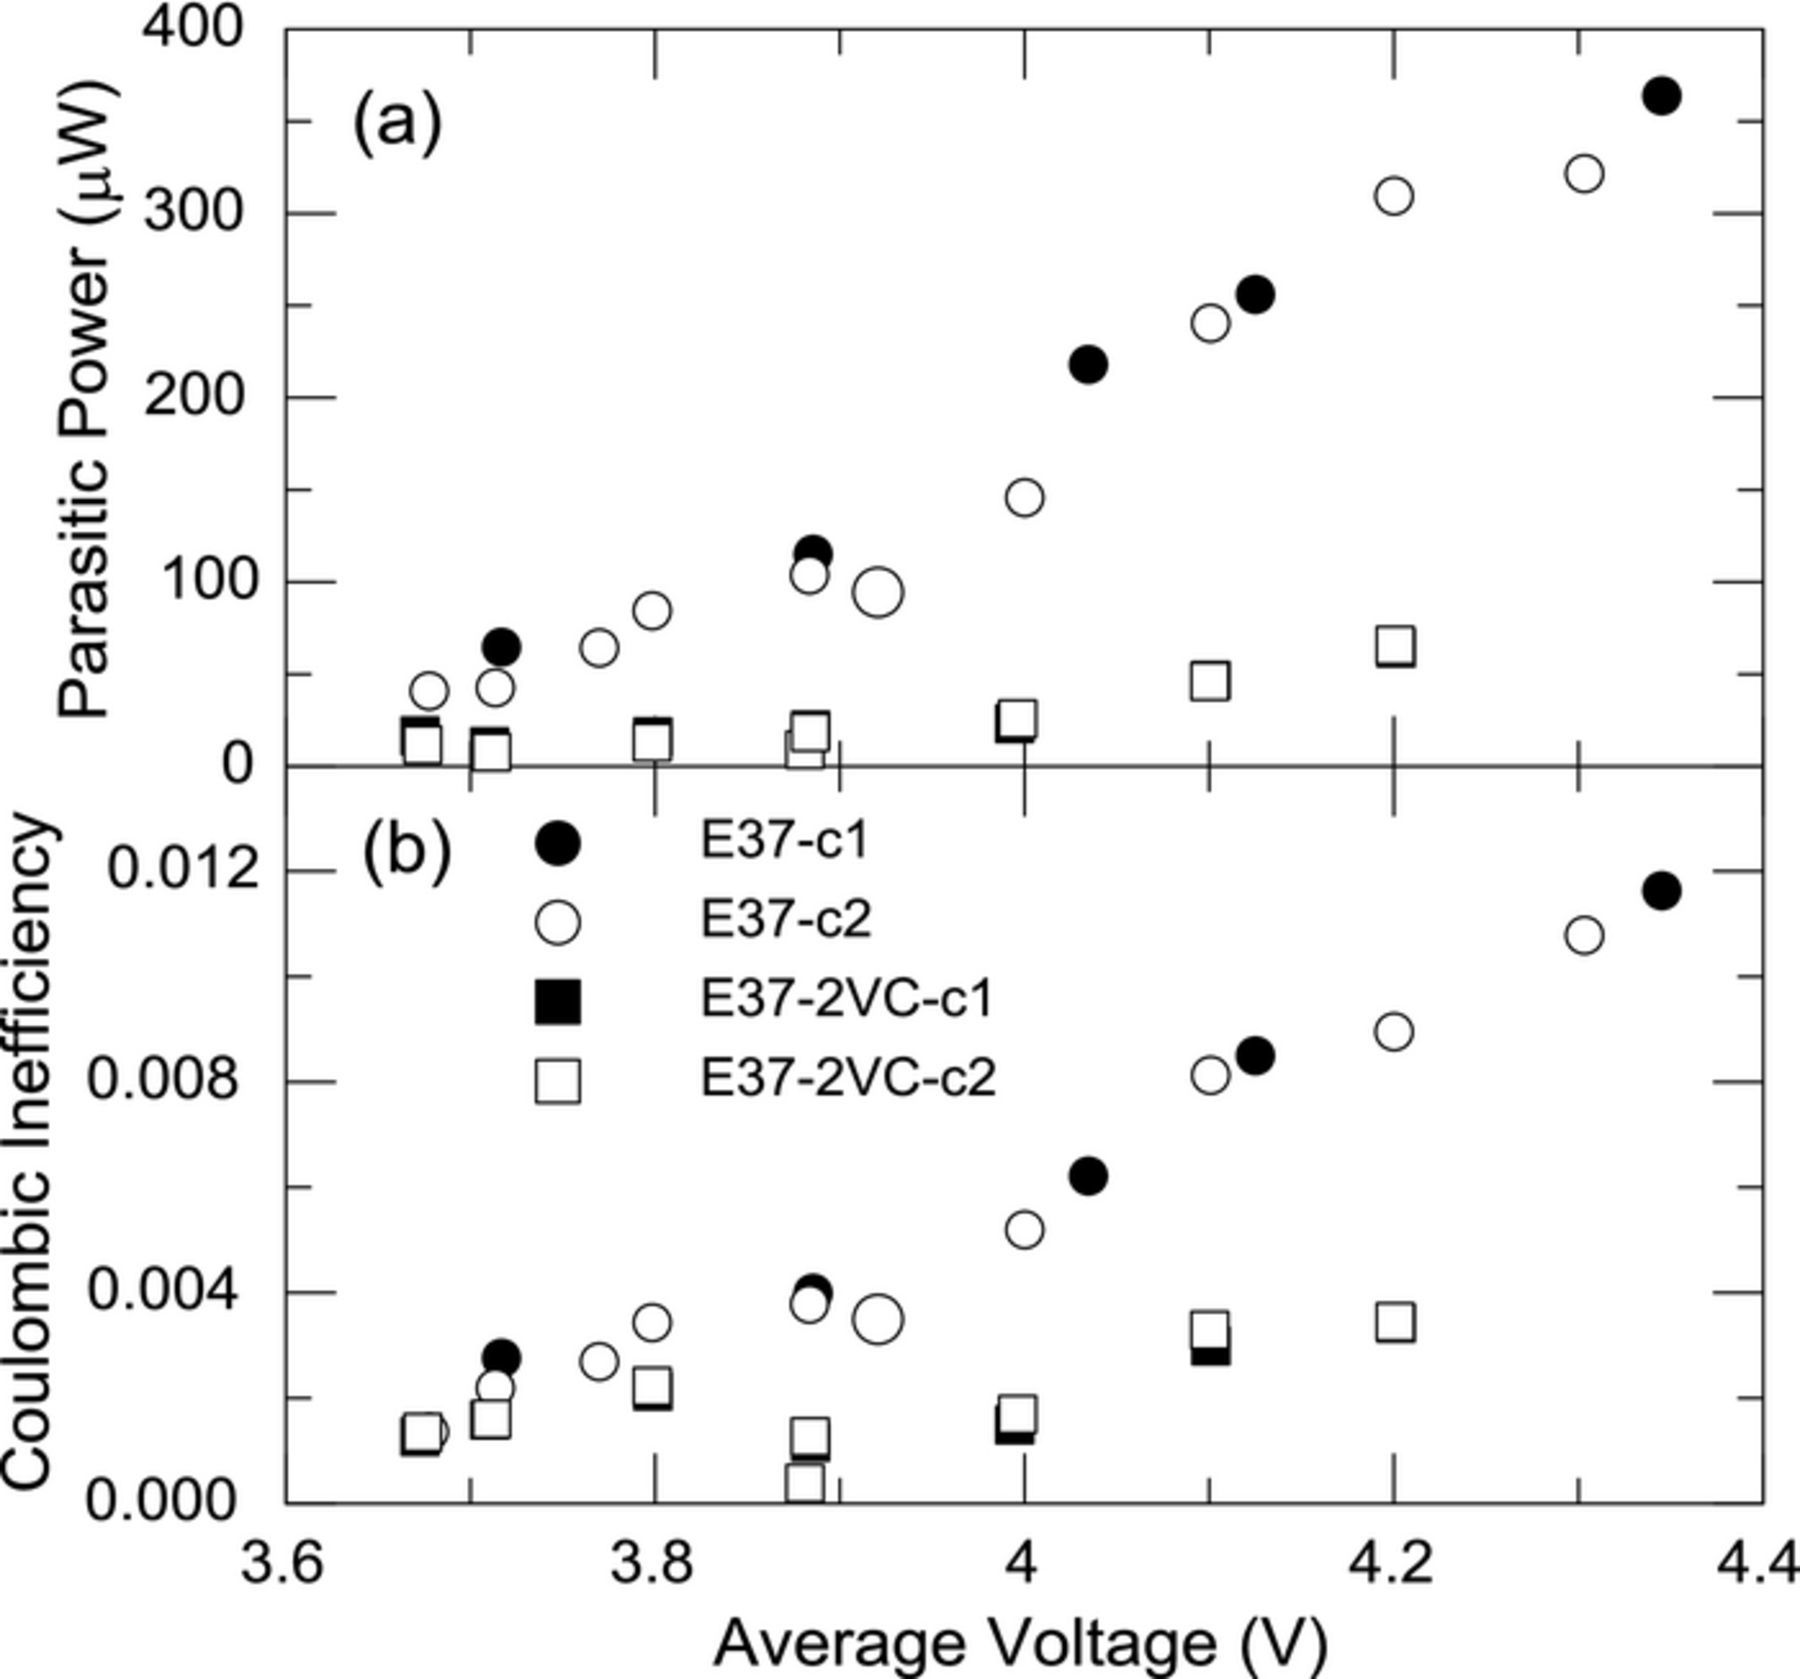
Figure 6. (a) Average parasitic thermal and (b) coulombic inefficiency of cells with (E37-2VC-c1, 2) and without (E37-c1, 2) 2% VC cycled in narrow voltage ranges plotted as a function of the average voltage of the narrow cycling range. The larger circle corresponds to a full voltage range cycle (3.0 V–4.25 V).
The data in Figure 6 suggest a significant difference in capacity fade should exist between the cells with and without VC if the parasitic thermal power measured by this method represents capacity loss from irreversible Li loss from electrolyte reactions. Figure 7 shows the normalized capacity versus cycle number for a cell with (E37-2VC-c3) and without (E37-c3) VC cycled in full voltage range (3.0 V–4.25 V). A very clear difference in fade exists between the cells confirming the parasitic reactions directly result in capacity fade in full cells.
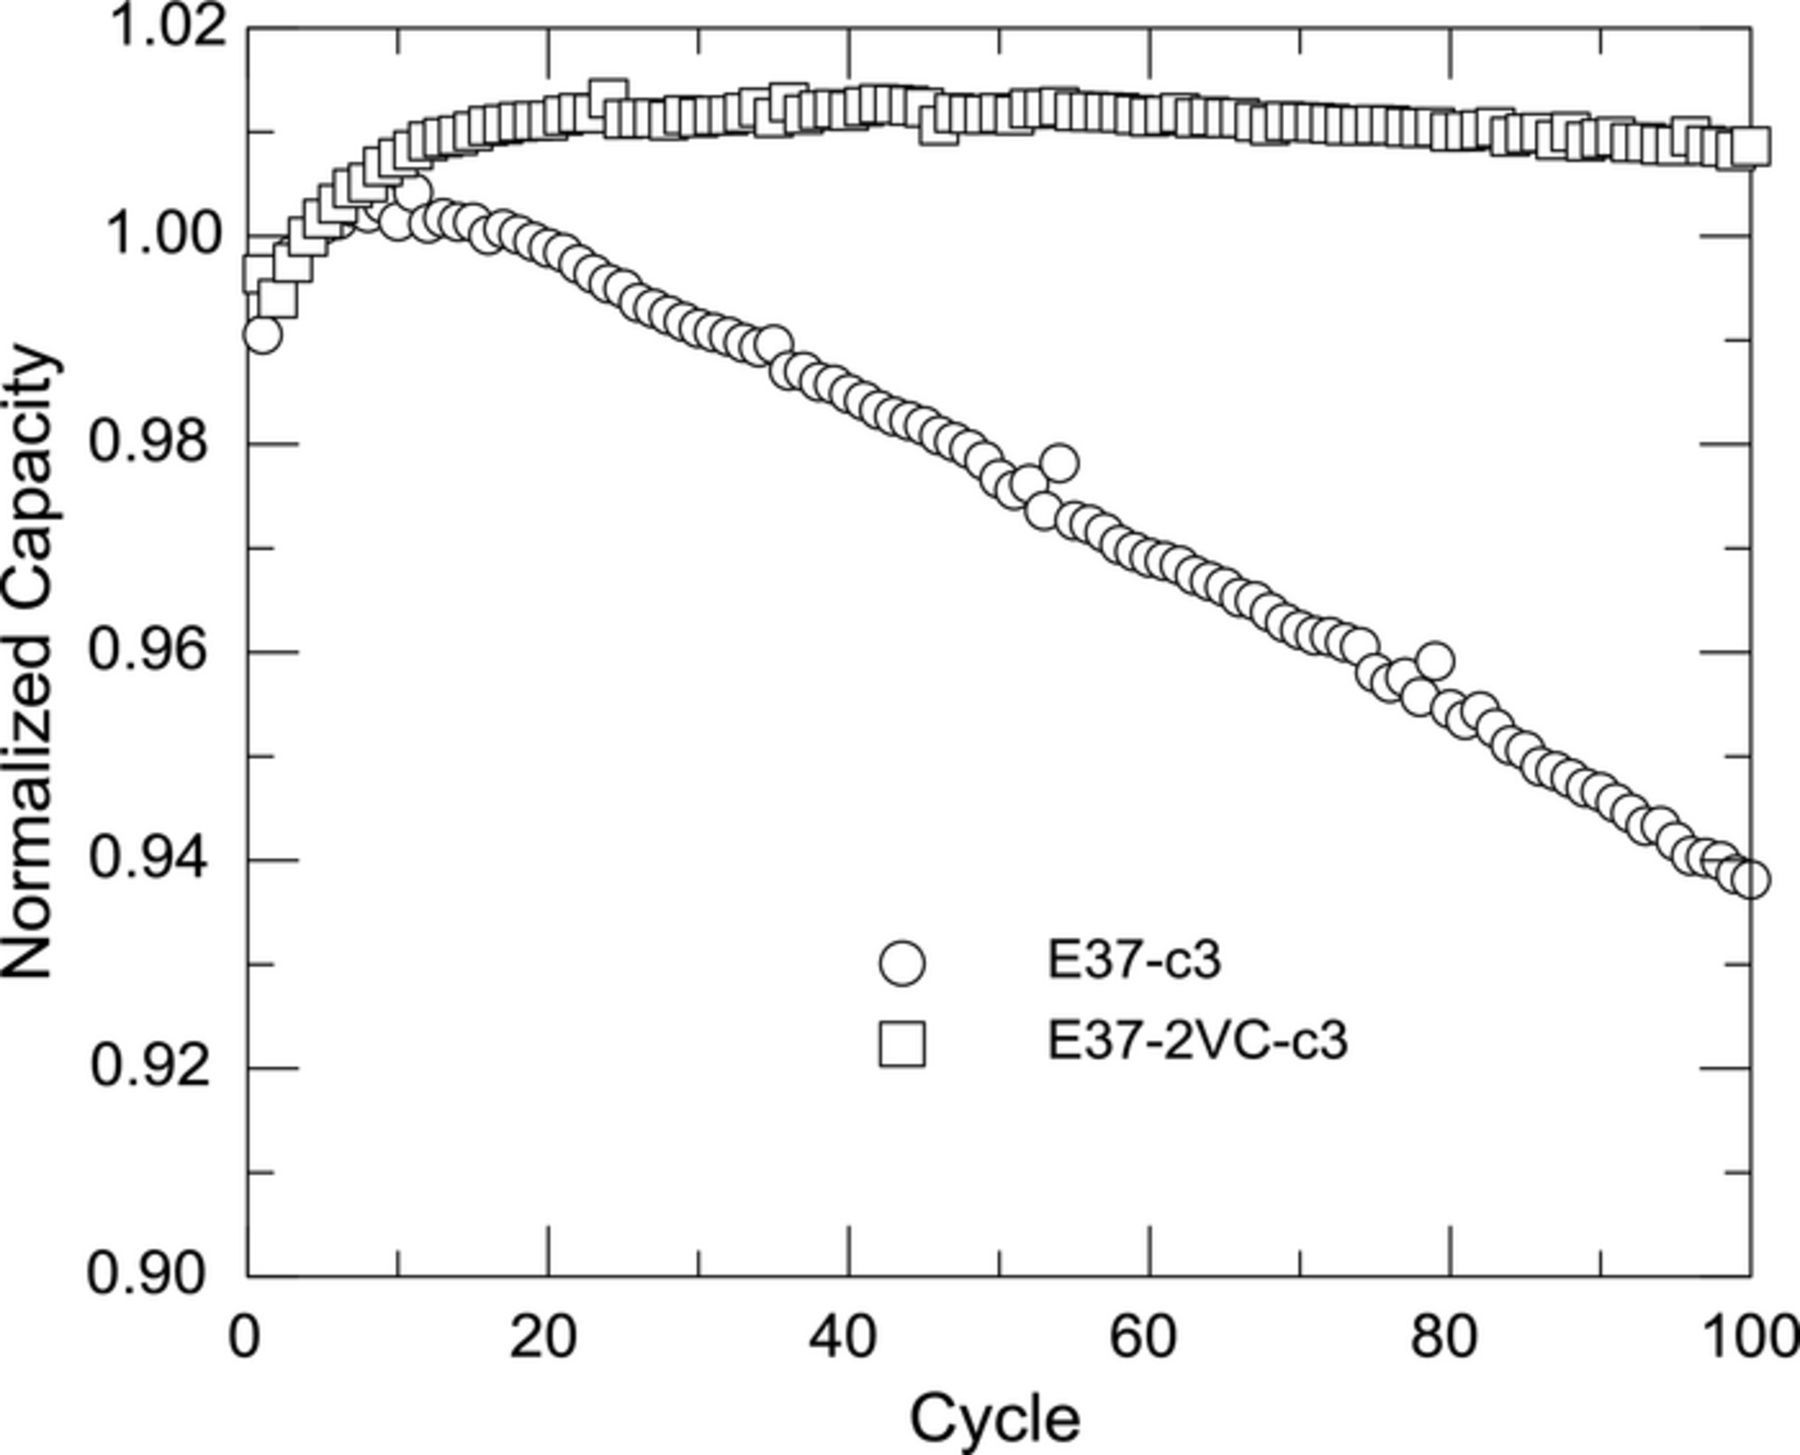
Figure 7. Normalized capacity versus cycle number for a cell with (E37-2VC-c3) and without (E37-c3) 2% VC cycled in full voltage range (3.0 V–4.25 V)
Using the same methods we also investigated the differences, if any, between two common additives, VC and FEC. Two cells with 2% VC (E37-2VC-c1, E37-2VC-c2) and two cells with 2% FEC (E37-2FEC-c1, E37-2FEC-c2) were cycled 10 times at room temperature on a Maccor cycler and then inserted into the calorimeter. Figures 8a and 8b show the thermal parasitic power of each pair of cells and the CIE respectively. The difference in parasitic power for the two electrolytes is very small and nearly within the experimental error at low cell voltages but at the higher cell voltages the cells with 2% VC show lower parasitic power. Similarly the CIE at low voltages is within experimental error and only at the highest voltages does the difference in CIE depart from experimental error. Both results suggest that VC is more effective at establishing a more protective SEI layer at the higher cell voltages. The differences found in parasitic thermal power may well be the result of differences in respective reaction enthalpies.
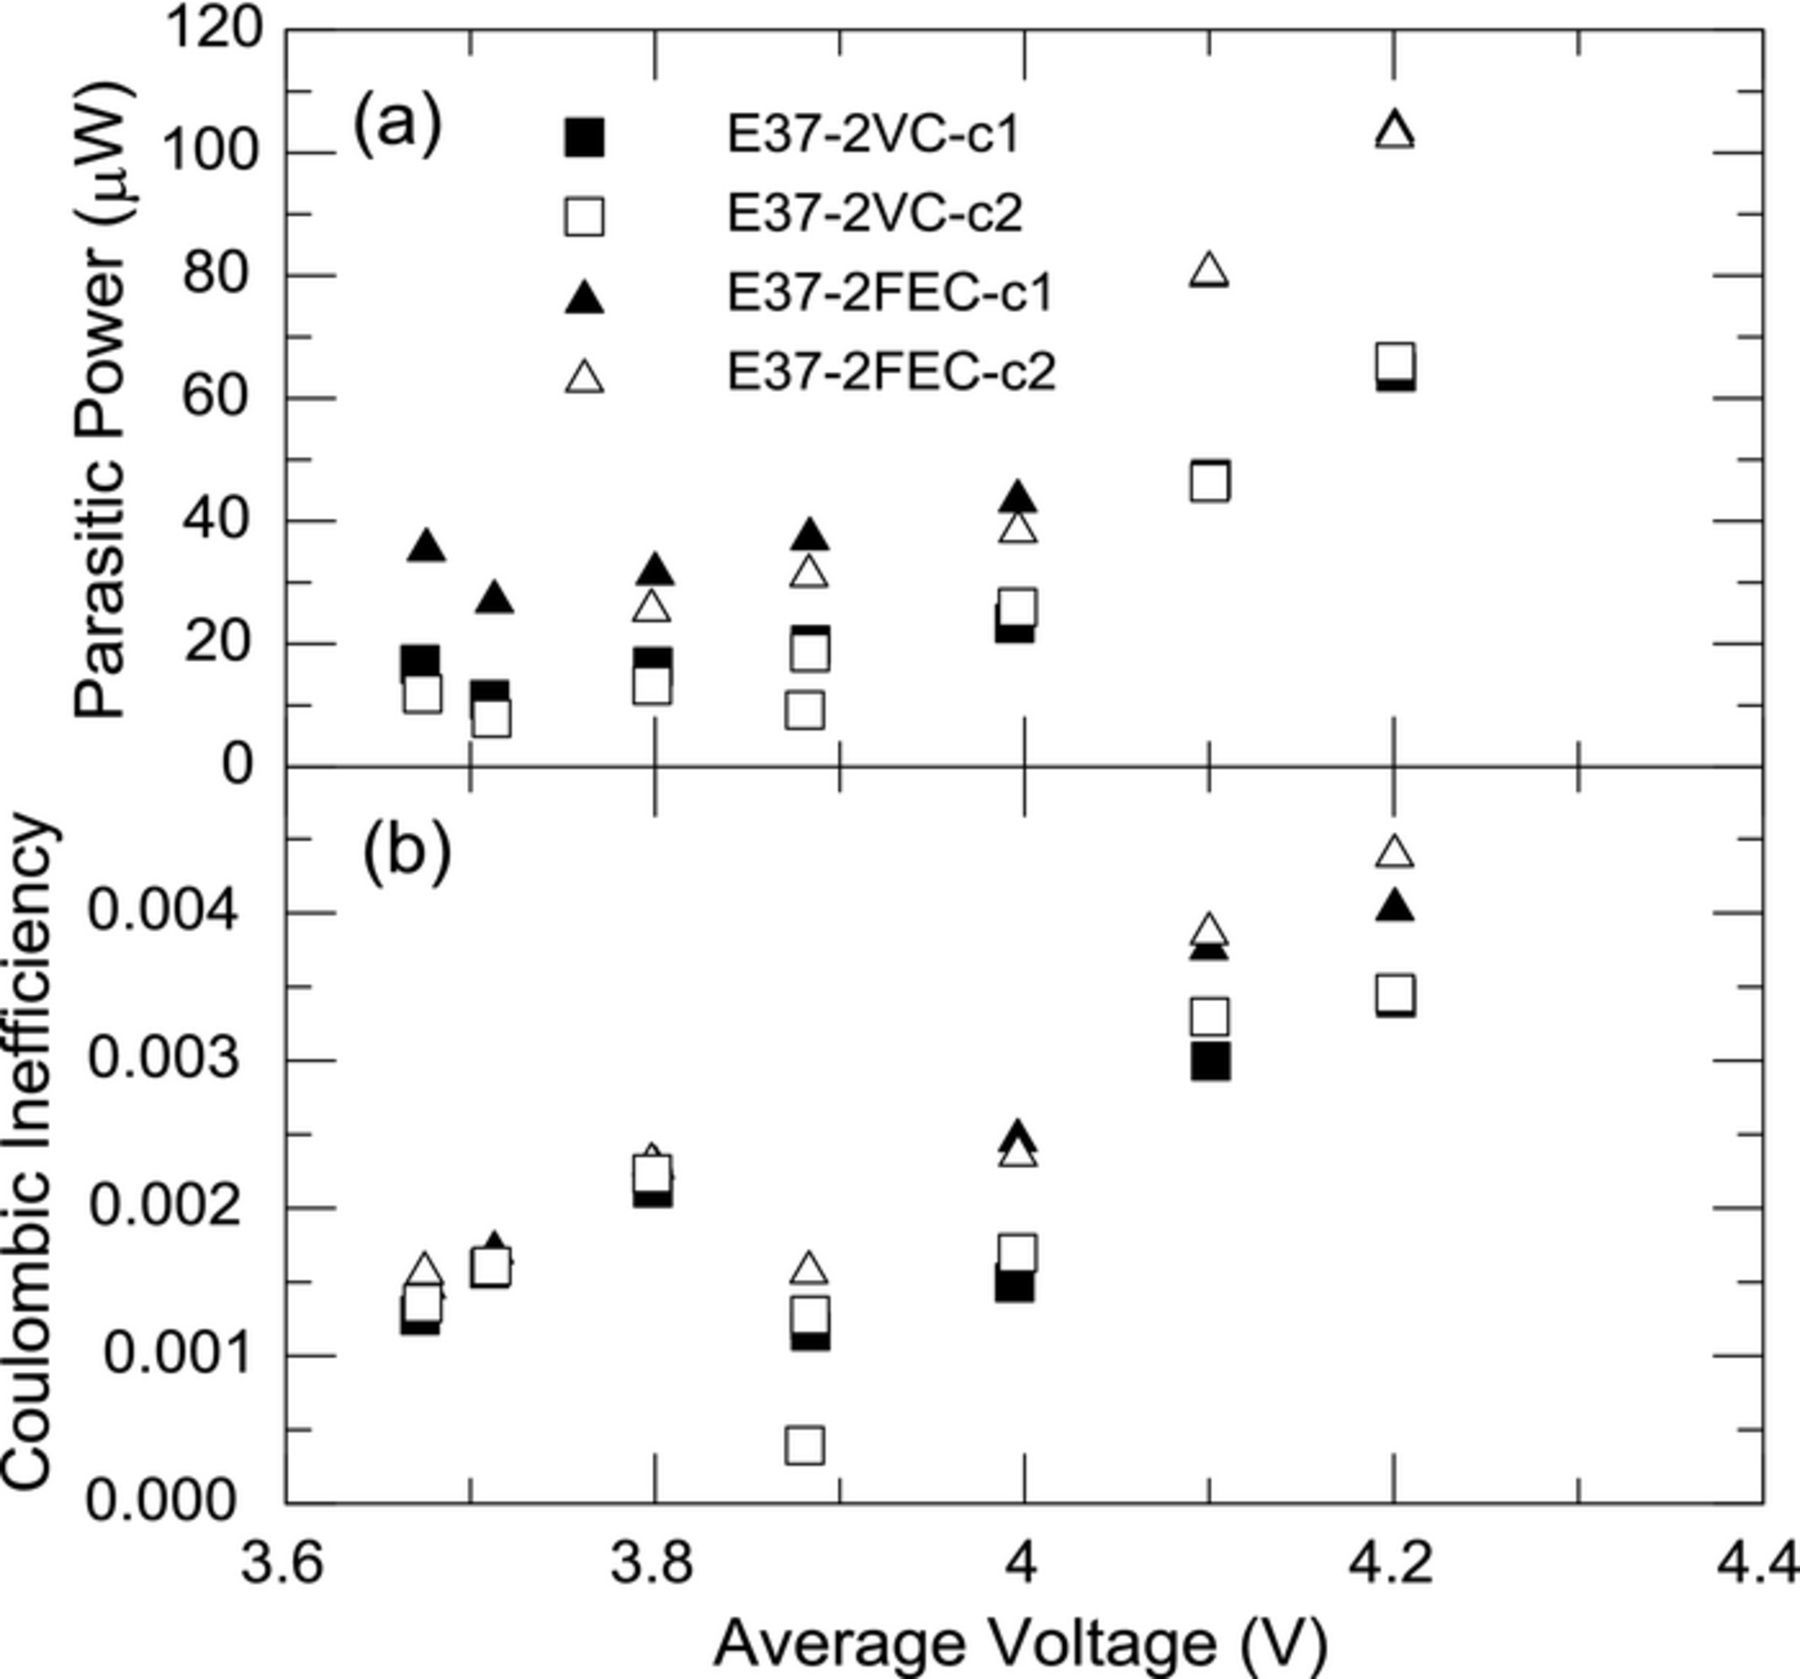
Figure 8. (a) Average parasitic thermal power and (b) coulombic inefficiency of cells with 2% VC (E37-2VC-c1, 2) and with 2% FEC (E37-2FEC-c1, E37-2FEC-c2) cycled in narrow voltage ranges plotted as a function of the average voltage of the narrow cycling range.
Parasitic Thermal Power as a Function of Cycle Number
Control cells E37-c2, c4, and c3 were cycled for 10, 50, and 180 cycles at room temperature (22°C). They were subsequently placed in the calorimeter at 37°C and narrow range cycling was performed and parasitic thermal powers were calculated. Figure 9 shows the parasitic thermal power of these cells and all remain very similar in thermal power as a function of average cell voltage. Prolonged cycling at room temperature had little effect on the measured parasitic thermal power. This is likely due to an Arrhenius-type dependence of reaction rate on temperature, where the impact of temperature increase was larger than the impact of RT cycling. Nevertheless there is a time-dependent decay of parasitic power, as can be seen by careful comparison of the parasitic power of cell E37-c4 in Figures 9 and 5. The parasitic powers in Figure 9 were measured after 50 cycles at RT and those in Figure 5 were the second round of calorimeter measurements performed after an additional 50 cycles at RT. The second round measurements are slightly lower. The small and monotonic change in parasitic powers with cycling history show that the measurement of parasitic thermal power even at low cycle numbers can be predictive of the capacity retention when capacity loss is a function of electrolyte reactivity.
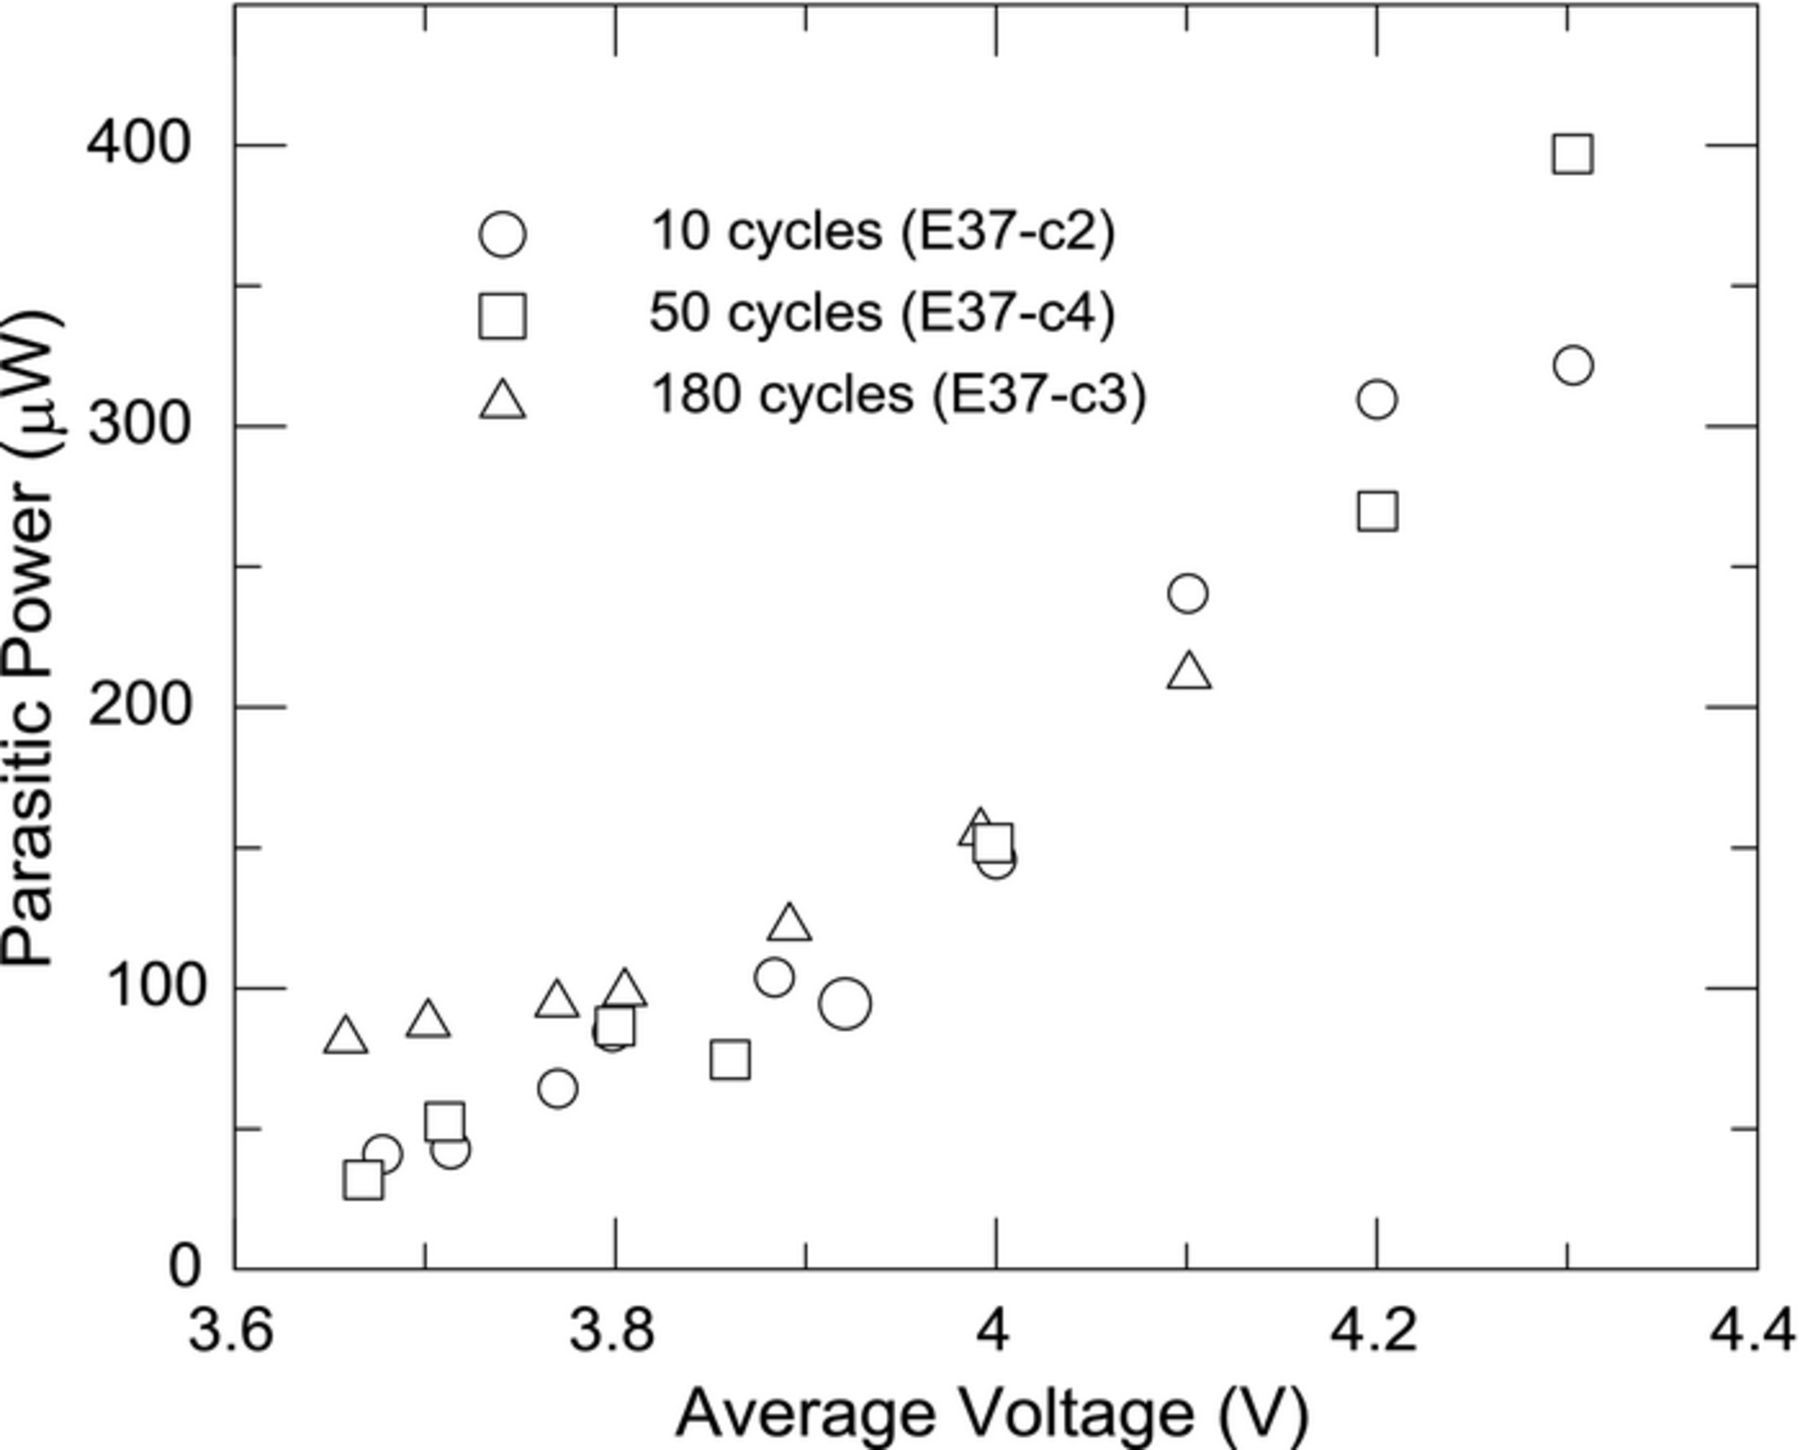
Figure 9. Average parasitic thermal power as a function of average voltage for cells at 37°C with 1M LiPF6 in EC/EMC after 10 cycles, 50 cycles and 180 cycles at room temperature.
Effect of Additives on Cell Polarization
In addition to the coulombic efficiency, average parasitic thermal power or parasitic thermal energy this technique also provides a measure of the cell polarization. As discussed above the voltage hysteresis, representing all sources of cell polarization, is subtracted from the total thermal energy over an entire cycle. Thus the cell polarization is also determined. This allows us to assess the effect of electrolyte or electrolyte additive on the total cell polarization. Figures 10a and 10b show the parasitic thermal power and average voltage hysteresis as a function of the average voltage of the narrow cycling respectively. Both 2% VC and 2% FEC have identical voltage hysteresis to a control cell and therefore have no effect on cell polarization. VC at a 10 wt% level causes an increase in the cell polarization while FEC at a 10 wt% level does not. Figure 10a shows the parasitic power for cells with 2% and 10% VC are identical within the accuracy of the measurement. Increasing the VC content under these experimental conditions therefore does not reduce parasitic thermal power. This is consistent with the hypothesis that no benefit is obtained from having more VC than is required for forming a passivation layer on the electrode materials.8
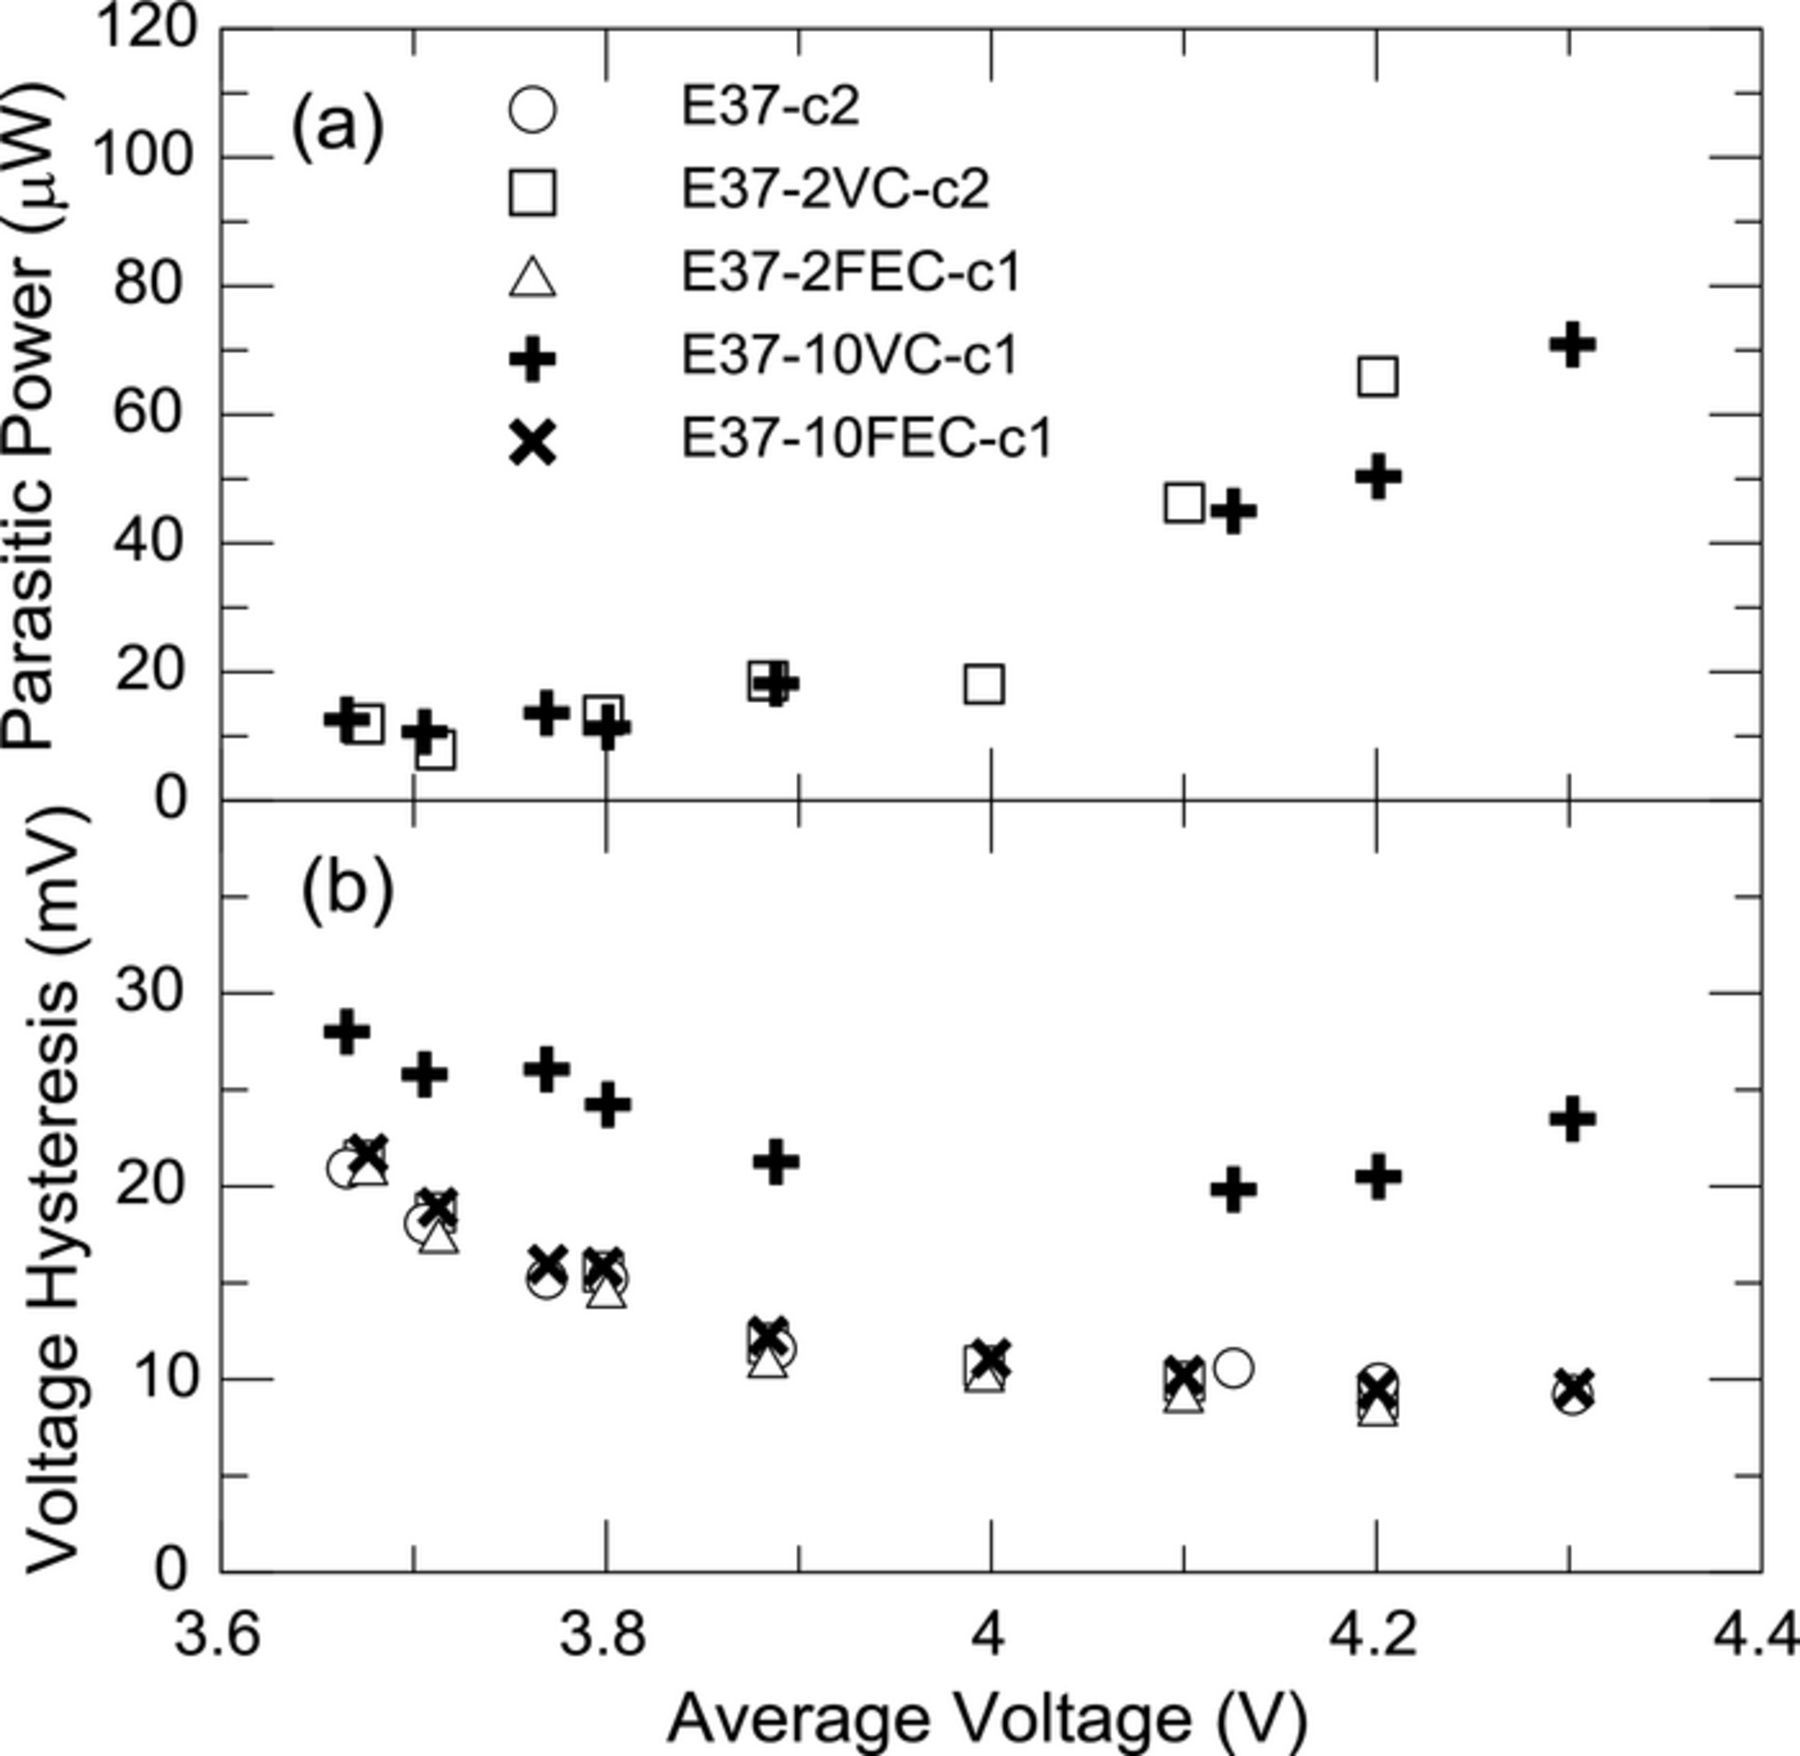
Figure 10. Effect of VC and FEC on (a) average parasitic power and (b) voltage hysteresis in narrow voltage ranges plotted as a function of the average voltage of the narrow cycling range. See Table II for electrolyte formulations.
Numerical Narrow Cycling
Figure 2 shows that both the voltage curve and the thermal signal are very close to being a subset of the full range cycling. This suggests near perfect reversibility with state of charge, i.e. that there is no hysteresis of entropic events with capacity. This assumption would allow the application of Eq. 1 to a subset of full range cycling. Indeed, one could perform the integration/subtraction method allowing the calculation of parasitic power through the cancellation of entropic and impedance contributions on a subset of the full range data.
While this was done experimentally through narrow cycling within voltage ranges, it is also possible to do this numerically within capacity ranges. The average voltage within a given capacity range is given by:
![Equation ([4])](https://content.cld.iop.org/journals/1945-7111/164/4/A889/revision1/d0004.gif)
where V is voltage, c capacity, and c0 and c1 are the capacities at the beginning and end of the segment respectively. Combining Equations 2 and 4 yields the average parasitic thermal power ( ) for a subset:
![Equation ([5])](https://content.cld.iop.org/journals/1945-7111/164/4/A889/revision1/d0005.gif)
where P is the power measured by the calorimeter, t time, to and t1 the times corresponding to c0 and c1 on charge respectively, and t2 and t3 the times corresponding to c1 and c0 on discharge respectively. By utilizing Equations 4 and 5 one can then calculate the dependence of parasitic power on average voltage from a single full range cycle. The only tunable parameter in the calculation is Δc = c1 − c0, the width used for the numerical loop. Of course, the thermal and electrochemical datasets must be carefully aligned in time, thereby allowing to translate a capacity from the cell into a time on the thermal data set.
Figure 2 shows that the experimental narrow voltage ranges yield capacity ranges between 50 mAh and 100 mAh. Figure 11 shows an example of the application of the numerical approach on a range similar to the experimental range shown in Fig. 2b. A complete parasitic power versus average voltage curve may be calculated with a given capacity width, Δc, by taking arbitrarily small steps in capacity. Figure 12 shows a parasitic power curve calculated using electrochemical and thermal data from a full range cycle of cell E37-2VC-c using a variety of capacity widths. One can see the result is not very sensitive to the capacity width. Wider widths smooth out local variations but the effect of the edges extends further into the data. Edge effects stem from the transient section of the thermal data on the edges of the full range (near 3.0 V and 4.25 V) and are approximately 20 mAh in width based on inspection of Fig. 2. The large negative values below 3.7 V are seen as artifacts caused by edge effects. It should be noted that Equation 5 is the derivation of the general case for calculating parasitics and that "integration/substraction" method is the specific case with the capacity width corresponding to the whole cycle and that the "average" method recently proposed by Glazier et al. is the specific case with the capacity width set to zero.9 The general behavior of the numerically calculated parasitic power increases with higher voltage in agreement with the experimental results. Surprisingly, negative parasitic power values are obtained for values near the middle of the full range voltage curve (∼3.8 V). The dip in parasitic power near 3.8 V is consistent with the experimental results, indeed Fig. 7 shows a dip in parasitic power and more significantly in CIE near 3.9 V. However, it is unclear whether the negative values obtained in parasitic power are physical or an artifact of the methodology, further study is needed.
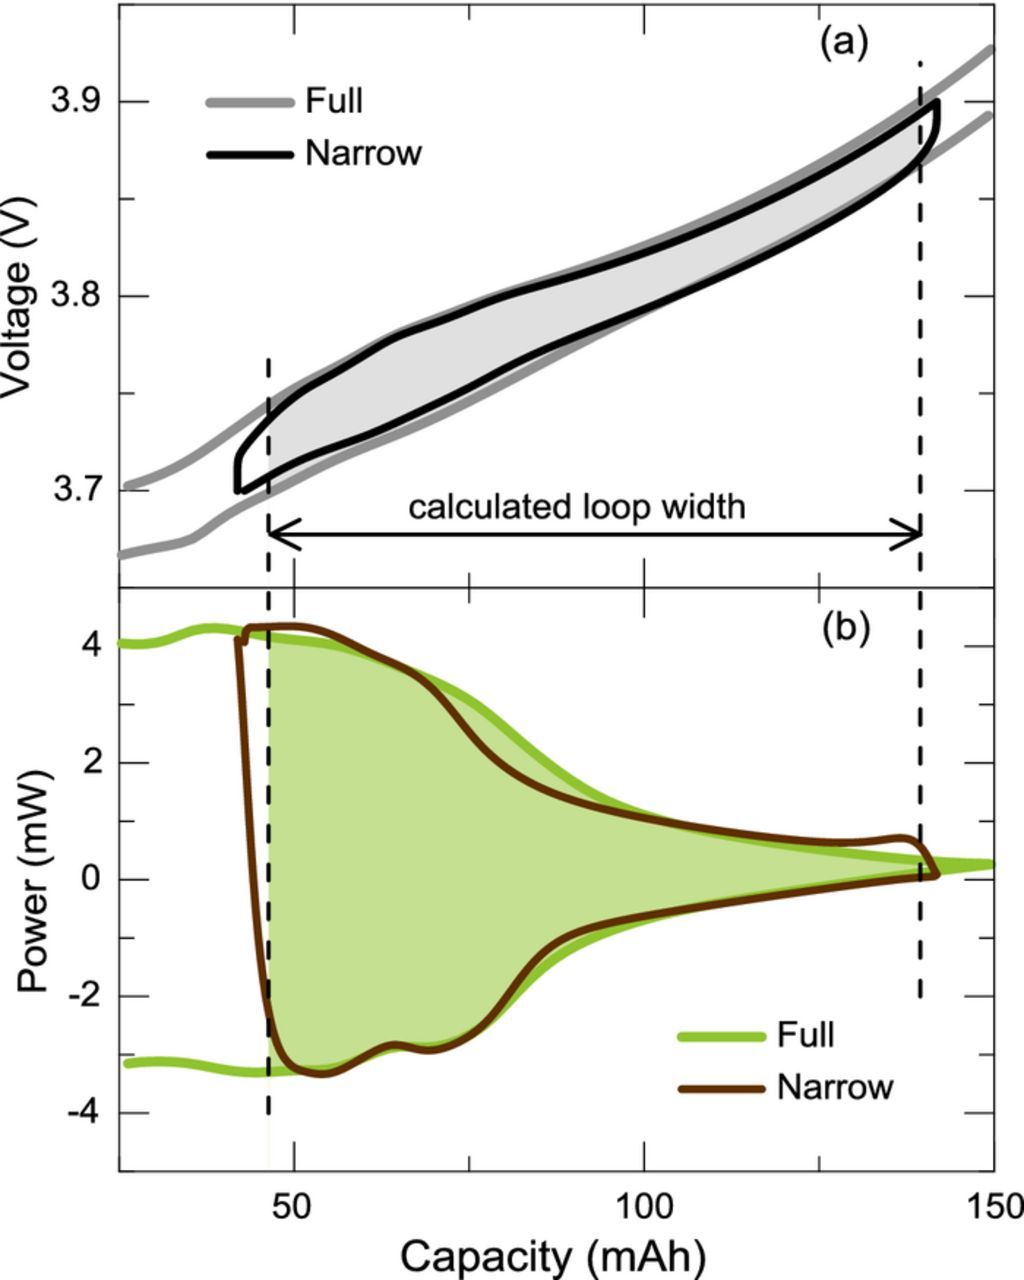
Figure 11. Example of the application of the numerical approach for calculating parasitic power on narrow ranges compared to experimental cycling over a narrow voltage range. Calculation of the (a) electrochemical energy hysteresis and (b) thermal energy in the range outlined by the dotted lines.
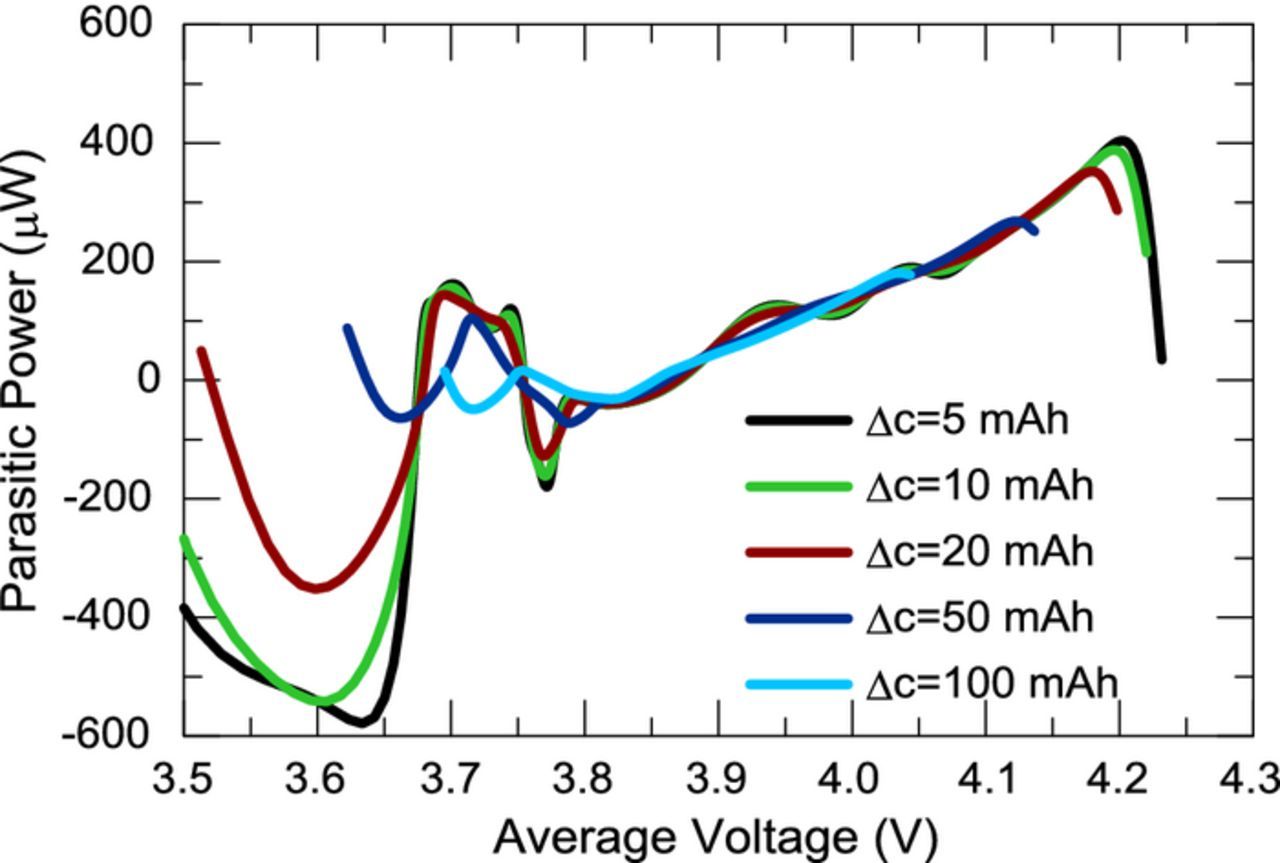
Figure 12. Parasitic power calculated using the numerical narrow cycling method on a full range cycle (3.0 V–4.25 V) of cell E37-c1 using a capacity width as defined in the legend.
Figure 13 shows that in the higher voltage range there is good agreement between the numerically calculated parasitic powers and the experimental results for cells with control electrolyte, 2% VC, and 2% FEC. This methodology therefore yields the dependence of parasitic power on voltage without the need to perform several cycles in narrow voltage ranges as exemplified here or the need to perform several cycles in narrow voltage ranges at various very slow currents as performed by Downie et al.1 This approach could therefore prove to be a powerful screening method for the stability of electrolytes at high voltages.
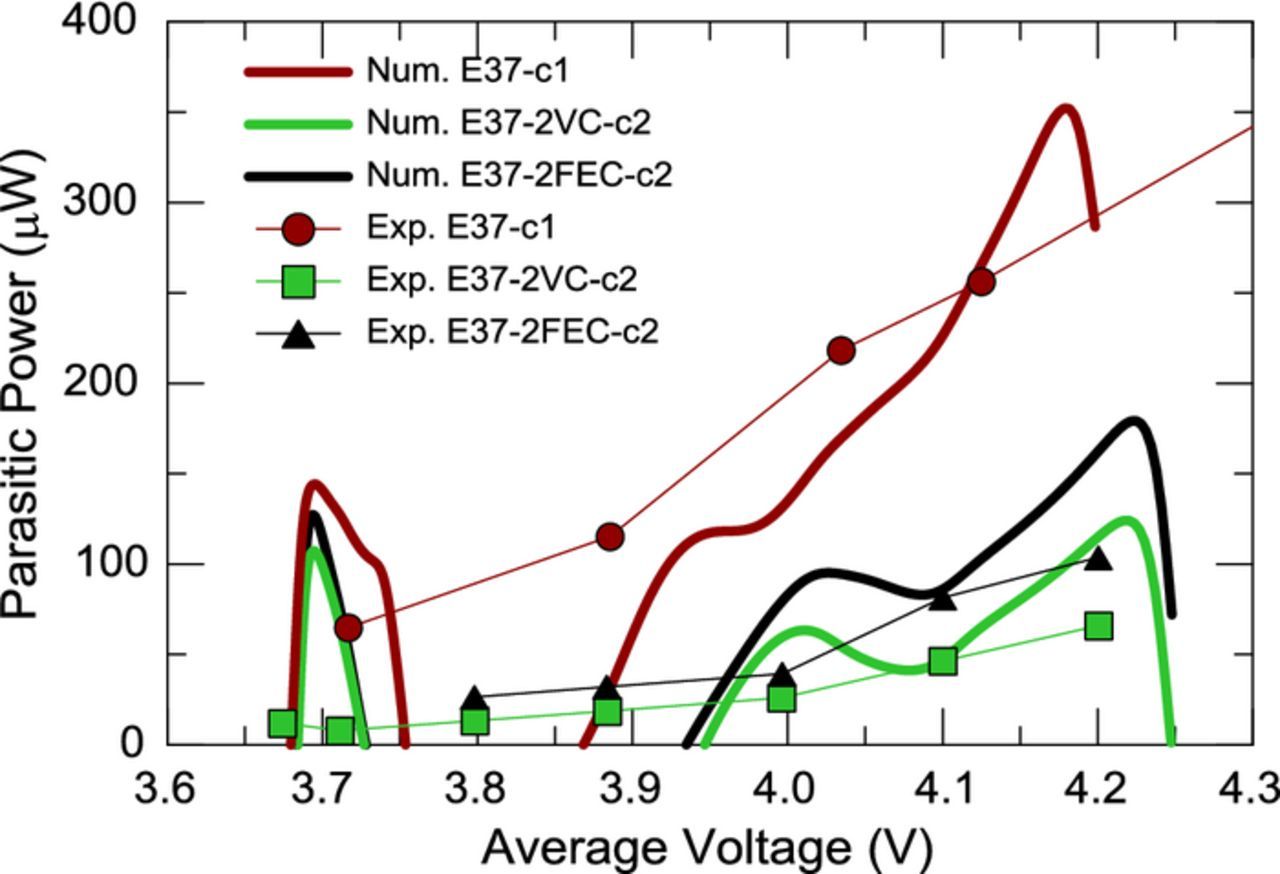
Figure 13. Comparison of parasitic powers obtained numerically (thick lines) from a full range cycle and experimentally (symbols) from several narrow cycles for cells without additive (E37-c1), with 2% VC (E37-2VC-c2), and with 2% FEC (E37-2FEC-c2).
Summary
A calorimetric method for characterizing the parasitic electrolyte reactions in graphite/LiCoO2 Li-ion full cells was described. The method yields cell voltage dependence, coulombic efficiency and cell polarization in addition to parasitic thermal power or energy. Cells assembled with a blend of 1M LiPF6 in EC/EMC 3/7 showed an increase in parasitic thermal power with increasing cell voltage indicating the increased electrolyte reactivity at higher voltage. The addition of the additives VC and FEC dramatically reduced the parasitic thermal power, especially at high voltages. The differences shown by this calorimetric method between cells with only the base electrolyte and cells with additives was also manifested in capacity retention confirming the basis for the parasitic thermal power differences being due to electrolyte reactions involving lithium consumption. A novel method for calculating parasitic power as a function of voltage using the electrochemical and thermal data from a single full range cycle was also presented, allowing accelerated electrolyte screening.
List of Symbols
| c | Capacity (Coulombs) |
| I | Current (A) |
| N | Molar capacity (mol per state of charge) |
| P | Power (J/s) |
| Q | Heat (J) |
| Q0 | Baseline calorimeter heat (J) |
| Qp | Parasitic heat or energy (J) |
| s | Entropy (J/mol/K) |
| t | Time (s) |
| T | Temperature (K) |
| V | Voltage (V) |
| x | State of charge |
Greek
| η | Overpotential (V) |
Subscripts
| − | Anode |
| + | Cathode |
| c | Charge |
| d | Discharge |
| p | Parasitics |