Abstract
1,2,6-oxadithiane 2,2,6,6-tetraoxide (ODTO) as a novel electrolyte additive was evaluated in both uncoated and coated single crystal Li[Ni0.5Mn0.3Co0.2]O2/graphite pouch cells with 1.2M LiPF6 in ethylene carbonate (EC): ethyl methyl carbonate (EMC) (3:7 by weight) as the electrolyte. ODTO passivates the graphite negative electrode at ∼1.4V (vs. Li/Li+) and also forms a solid electrolyte interphase layer at the positive electrode side. X-ray photoelectron spectra of cells filled with 1% ODTO demonstrate that ODTO mainly converted to sulfur-containing species at both electrode surfaces after formation. The performances of cells containing up to 5% ODTO and binary additive blends including 2% vinylene carbonate (VC) + 1% ODTO, 2% fluoroethylene carbonate (FEC) + 1% ODTO and 1% LiPO2F2 + 1% ODTO were evaluated and compared to cells with 2% VC, 2% FEC and 1% LiPO2F2. Ultra-high precision coulometry (UHPC) and long-term cycling show that 3% ODTO alone increased coulombic efficiency (CE) and led to high capacity retention for both uncoated and coated cells. Cells with uncoated NMC532 and additive blends containing 1%ODTO along with 1%LiPO2F2, 2% VC or 2%FEC showed virtually identical cycling performance to cells with coated NMC532 and the same electrolytes, suggesting that coatings are not required if effective additives are used.
Export citation and abstract BibTeX RIS

This is an open access article distributed under the terms of the Creative Commons Attribution 4.0 License (CC BY, http://creativecommons.org/licenses/by/4.0/), which permits unrestricted reuse of the work in any medium, provided the original work is properly cited.
Electrolyte additives only account for a small proportion (normally below 5 wt%) of the electrolyte in lithium ion batteries (LIBs), but proper additives enable the formation of solid electrolyte interface (SEI) layers at the negative and/or positive electrode surfaces.1 The SEI layers can prevent solvent molecules from intercalating into graphite, limit parasitic reactions during long-term cycling or inhibit electrolyte oxidation at high upper cutoff voltages.2–9
Two additive families of wide interest are cyclic carbon- and sulfur-containing compounds. Carbonate additives, like vinylene carbonate (VC) and fluorinated ethylene carbonate (FEC), can preferentially passivate the graphite negative electrode and/or positive electrode better than most carbonate solvents.10–13 Sulfate additives change graphite passivation chemistry due to their higher reduction potential than typical carbonate additives and solvents.14
Several sulfate and sultone compounds have been reported to form high-quality SEI-layers at the graphite negative electrode and significantly enhance the performance of LIBs.15–25 For example, 1,3,2-Dioxathiolane 2,2-dioxide (DTD) and Prop-1-ene 1,3 sultone (PES) have been studied as effective SEI-forming additives in propylene carbonate (PC)-based electrolyte to prevent PC co-intercalation and graphite exfoliation.15–17 These two additives can also enhance the cycling and open-circuit storage performances of LiMn2O4/graphite, Li[Ni0.4Mn0.4Co0.2]O2 (NMC442)/graphite and Li[Ni0.5Mn0.3Co0.2]O2 (NMC532)/graphite cells in ethylene carbonate (EC): ethyl methyl carbonate (EMC) electrolyte.18–22 Methylene methanedisulfonate (MMDS) has also been reported to be an effective additive for the passivation of various positive electrodes like LiCoO2, LiMn2O4, Li[Ni1/3Mn1/3Co1/3]O2 (NMC111) and Li[Ni1-x-yCoxAly]O2 NCA, etc.23–25 MMDS can dramatically suppress the electrolyte oxidation at the positive electrode side and gas formation during cycling or open-circuit storage.
Herein, we report a new sulfur-containing additive, 1,2,6-oxadithiane 2,2,6,6-tetraoxide (ODTO) in NMC532/graphite pouch cells. Figure 1 shows that ODTO and MMDS have similar structures with two sultone groups, either sharing an oxygen atom in ODTO or being separated by a carbon atom in MMDS. In this work, the benefit of ODTO as an additive alone or in combination with VC, FEC or lithium difluorophosphate (LiPO2F2), was studied in NMC532/graphite pouch cells.
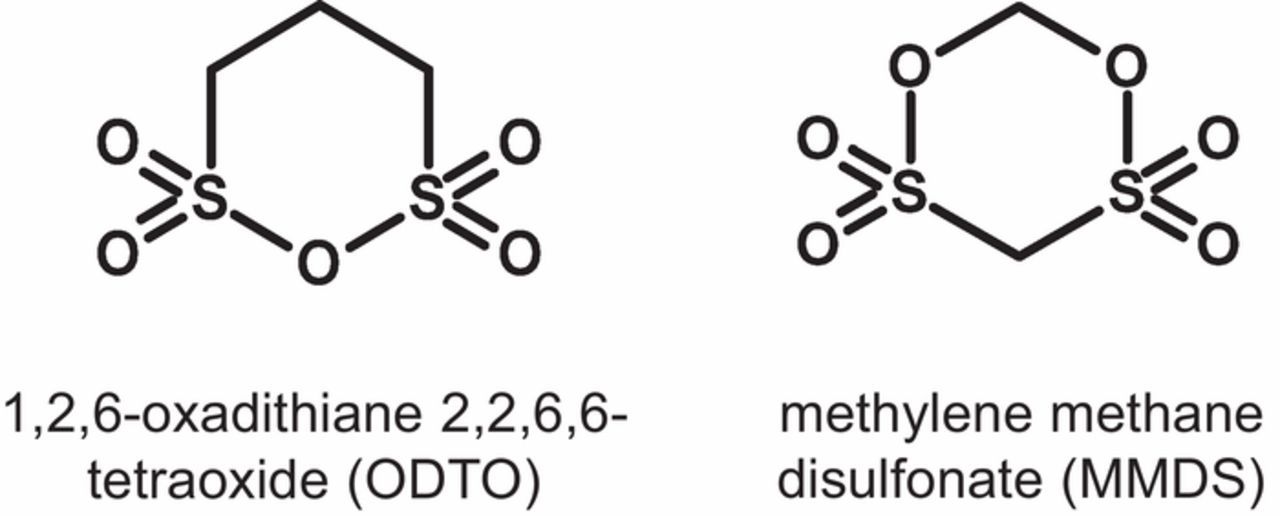
Figure 1. Chemical structures of 1,2,6-oxadithiane 2,2,6,6-tetraoxide (ODTO) and methylene methane disulfonate (MMDS).
Experimental
Preparation and formation of pouch cells
Chemicals were used as received: LiPF6 (purity >99.94%, water content 14 ppm) and EC:EMC (30:70 wt%, water content 19.7 ppm) were obtained from BASF. 1,2,6-oxadithiane 2,2,6,6-tetraoxide (ODTO, purity >99.85%, Guangzhou Tinci New Materials Technology, China), VC (purity >99.8%, BASF), FEC (purity >99.94%, BASF) and LiPO2F2 (LFO, purity >99.8%, Shenzhen Capchem, China) were used as additives. Throughout this paper, LiPO2F2 is called LFO for convenience.
Two types of dry and sealed Li[Ni0.5Mn0.3Co0.2]O2(NMC532)/artificial graphite (AG) pouch cells were obtained from Li-FUN Technology (Xinma Industry Zone, Golden Dragon Road, Tianyuan District, Zhuzhou City, Hunan Province, China, 412000). These were uncoated NMC532/AG (type I, 230 mAh at 4.3V) and coated NMC532/AG (type II, 230 mAh at 4.3V). The coating on the NMC532 particles was determined to be Ti-based by Ma et al.26 The only difference between two types of cells lies in the uncoated or coated positive electrode materials. The single side active material electrode loadings were 21.1 mg/cm2 for the positive electrode and 12.4 mg/cm2 for the graphite negative electrode. The positive and negative electrodes consist of 94 wt% and 95.4 wt% active materials, respectively. The positive electrode was compressed to a density of 3.5 g/cm3 and negative electrode was compressed to 1.55 g/cm3. Both types of cells are balanced at 4.4 V and were received without electrolyte. Prior to filling with the designed electrolytes, pouch cells were cut open and dried at 100°C under vacuum for 14 h to remove residual moisture. Afterwards, pouch cells were filled with 0.85 mL electrolyte in an Ar-filled glove box and sealed with a pouch sealer (MSK-115A Vacuum Sealing Machine) under vacuum at a pressure of −90 kPa (relative to atmospheric pressure). The electrolytes contained 1.2 M LiPF6 in EC:EMC (3:7 by weight) with no additive (control), 1% ODTO, 3% ODTO, 5% ODTO, 2% VC + 1% ODTO, 2% FEC + 1% ODTO or 1% LFO + 1% ODTO. All additives were added in wt% to the electrolyte.
After filling, cells were held at 1.5 V for 24 h to promote wetting and prevent the copper current collector from dissolution. Subsequently cells were moved to a 40°C box that was connected to a Maccor 4000 series charger. Cells were charged to 4.3 V at a current corresponding to C/20 (12 mA), held at 4.3 V for 1 h and then discharged to 3.8 V at C/20. In order to remove the gas formed during the charging and discharging process, the pouch cells were cut open and resealed under vacuum in the Ar-filled glove box. Cells were then moved for electrochemical impedance spectroscopy measurements.
Electrochemical impedance spectroscopy (EIS)
The electrochemical impedance spectra of the pouch cells were collected after formation, using a BioLogic VMP3 equipped with three EIS boards. All the measurements were performed at 10.0 ± 0.1°C from 100. kHz to 10. mHz (10. mV input). A temperature of 10°C was selected to amplify the differences between cells with different additive compositions.
Gas volume measurement
The gas production in pouch cells after formation was measured using Archimedes' principle. Each cell was suspended underneath a Shimadzu analytical balance (AUW200D) and weighed while submerged in nano-purified deionized (DI) water (18 MΩ•cm). The produced gas (Δv) in each cell is proportional to the change in apparent cell weight (Δm) that was caused by the buoyant force, as Equation 1:
![Equation ([1])](https://content.cld.iop.org/journals/1945-7111/166/12/A2665/revision1/d0001.gif)
where ρ is the density of DI water.
X-ray photoelectron spectroscopy (XPS)
Uncoated NMC532/AG cells containing no additive (as control), 1% ODTO or 2% VC were transferred to an Ar-filled glove box after formation. The electrodes were dissected, then rinsed with EMC several times, to remove dried LiPF6 and EC. Removal of these species is essential for the underlying SEI components to be observed by XPS, and for maintaining low pressures in the XPS system. Rinsing with EMC is not expected to dissolve any SEI components, as EMC is the major component of the electrolyte in which the SEI was formed. Once the rinsed samples were dried, they were mounted onto a molybdenum sample holder, using double-sided, ultra-high vacuum-compatible copper tape. The sample holder was then transferred into the XPS system, without being exposed to air, using a specially designed air-tight apparatus that could be evacuated to low pressures. Electrodes were left under ultra-high vacuum overnight to allow for off-gassing of any remaining volatile components. The samples were then transferred to the analysis chamber of the XPS, which has a base pressure of 1 × 10⁻¹⁰ mbar and was maintained below 2 × 10⁻⁹ mbar during the experiments. Analysis was performed with a SPECS spectrometer equipped with a Phoibos 150 hemispherical analyser, using unmonochromatized Mg Kα radiation and a pass energy of 20 eV. Preliminary and final survey scans were compared to ensure that no photochemical degradation was induced during analysis. Data analysis was done using CasaXPS software (v. 2.3.18). Charge correction was done by fitting the adventitious carbon peak, and shifting the x-axis such that this peak fell at 285.0 eV. XPS spectra were fit with a non-linear Shirley-type background. This background was subtracted from the signal to allow for qualitative comparison of atomic concentrations between samples using relative peak areas. Peaks were fitted with a mixed Gaussian (70%) /Lorentzian (30%) line shape.
Long-term cycling and ultra high precision coulometry (UHPC) cycling
Long-term cycling of cells was performed between 3.0 and 4.3 V on a Neware testing system (Shenzhen, China). The cells were charged and discharged with a current corresponding to C/3 (80 mA) at 40 ± 0.1°C or 1C (220 mA) at 20 ± 0.2°C. The voltage was held at the top of charge until the current dropped below C/20 (12 mA). After every 50 cycles, each cell was charged and discharged at C/20 (12 mA).
The UHPC cycling was performed at 40.0 ± 0.1°C using the UHPC charger at Dalhousie University and detailed description on the method can be found in Ref. 3. Cells were charged and discharged for 16 cycles with a current corresponding to C/20 (12 mA) between 3.0 and 4.3 V.
Results and Discussion
Figure 2 shows the differential capacity versus voltage (dQ/dV vs. V) of uncoated and coated NMC532/AG pouch cells without additives (as control) and with different additive compositions during the formation charge. Uncoated and coated NMC532/AG cells show very similar shapes of the differential capacity for each additive composition. Figures 2a and 2d show the passivation peaks corresponding to VC and FEC at 2.85 V (0.80 V vs. Li/Li+) and 2.75 V (0.9 V vs. Li/Li+), respectively. The dQ/dV peak at ∼3.0 V (0.65 V vs. Li/Li+) corresponds to EC reduction at the graphite negative electrode side. The same peak was observed with cells containing 1% LFO, indicating that LFO is not rapidly reduced in this potential range. Figures 2b and 2e compare the differential capacity of cells with 1%, 3% and 5% ODTO. ODTO passivated the graphite electrode between 2.1 V and 2.3 V (1.55 V and 1.35 V vs. Li/Li+), which is before VC and FEC. The EC reduction peak was largely suppressed from as ODTO content increased from 1% to 5% ODTO. Cells with 3% and 5% ODTO show similar dQ/dV peaks originating from ODTO, indicating that the addition of more than 3% ODTO will most likely not passivate the graphite electrode surface further. Figures 2c and 2f show the differential capacities of cells with binary additives 2% VC + 1% ODTO, 2% FEC + 1% ODTO and 1% LFO + 1% ODTO. The dQ/dV peaks that are caused by the reduction of both ODTO and VC or FEC were observed, showing that all of them contributed to the formation of SEI layers and the presence of 1% ODTO may not affect the reduction of VC or FEC.
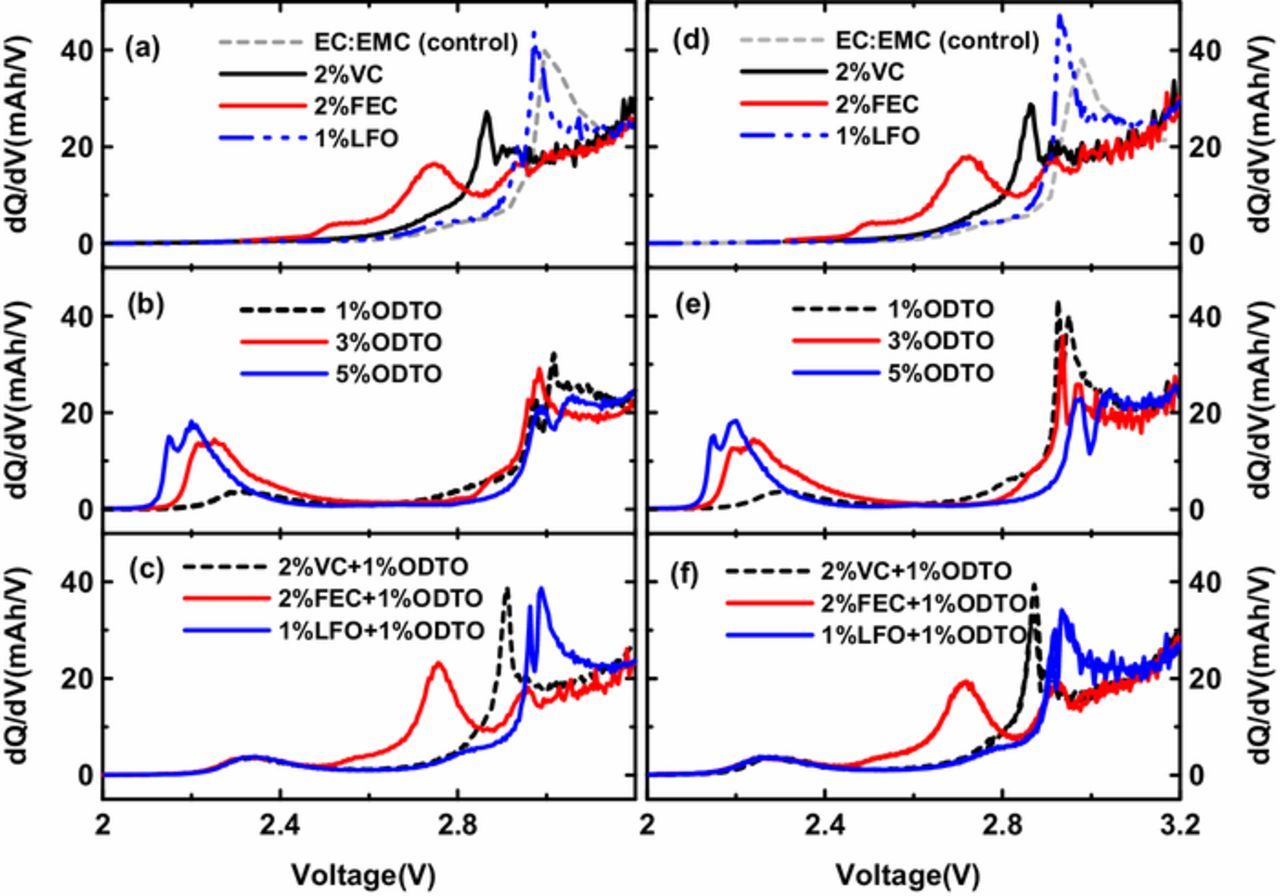
Figure 2. Differential capacity versus voltage of uncoated NMC532/AG cells (a to c) and coated NMC532/AG cells (d to f) filled with different additive compositions. (a) and (d): 2% VC, 2% FEC and 1% LFO; (b) and (e): 1%, 3% and 5% ODTO; (c) and (f): 2% VC + 1% ODTO, 2% FEC + 1% ODTO and 1% LFO + 1% ODTO.
Figure 3 shows the Nyquist plots of uncoated and coated NMC532/AG pouch cells without additives (as control) and with different additive compositions after formation. Figures 4a and 4b compare the Rct values of uncoated and coated NMC532/AG pouch cells that were derived from the diameter of the "semicircle" in the Nyquist plot. The coated control cells show lower Rct than the uncoated control cells (76 vs. 128 Ω•cm2), perhaps because the coating process helps eliminate undesirable species like Li2CO3 from the surfaces of the NMC532 particles. Cells with 1% ODTO show comparable Rct to those with 2% VC or 2% FEC but their Rct is larger than cells with 1% LFO. With the increase of ODTO content from 1% to 3% and then to 5%, the impedance of uncoated cells significantly increased from 123 Ω•cm2 to 358 Ω•cm2 and then to 1214 Ω•cm2 (coated cells show a similar trend). Both uncoated and coated cells with binary additives 2% FEC + 1% ODTO or 1% LFO + 1% ODTO show smaller Rct than the sum of Rct of cells with 2% FEC and 1% ODTO alone or cells with 1% LFO and 1% ODTO alone, suggesting some kind of synergistic interaction. Cells with 2% VC + 1% ODTO show comparable Rct to the total of Rct from cells with 2% VC and 1% ODTO alone, which is much larger than Rct of cells with 2% FEC + 1% ODTO or 1% LFO + 1% ODTO.
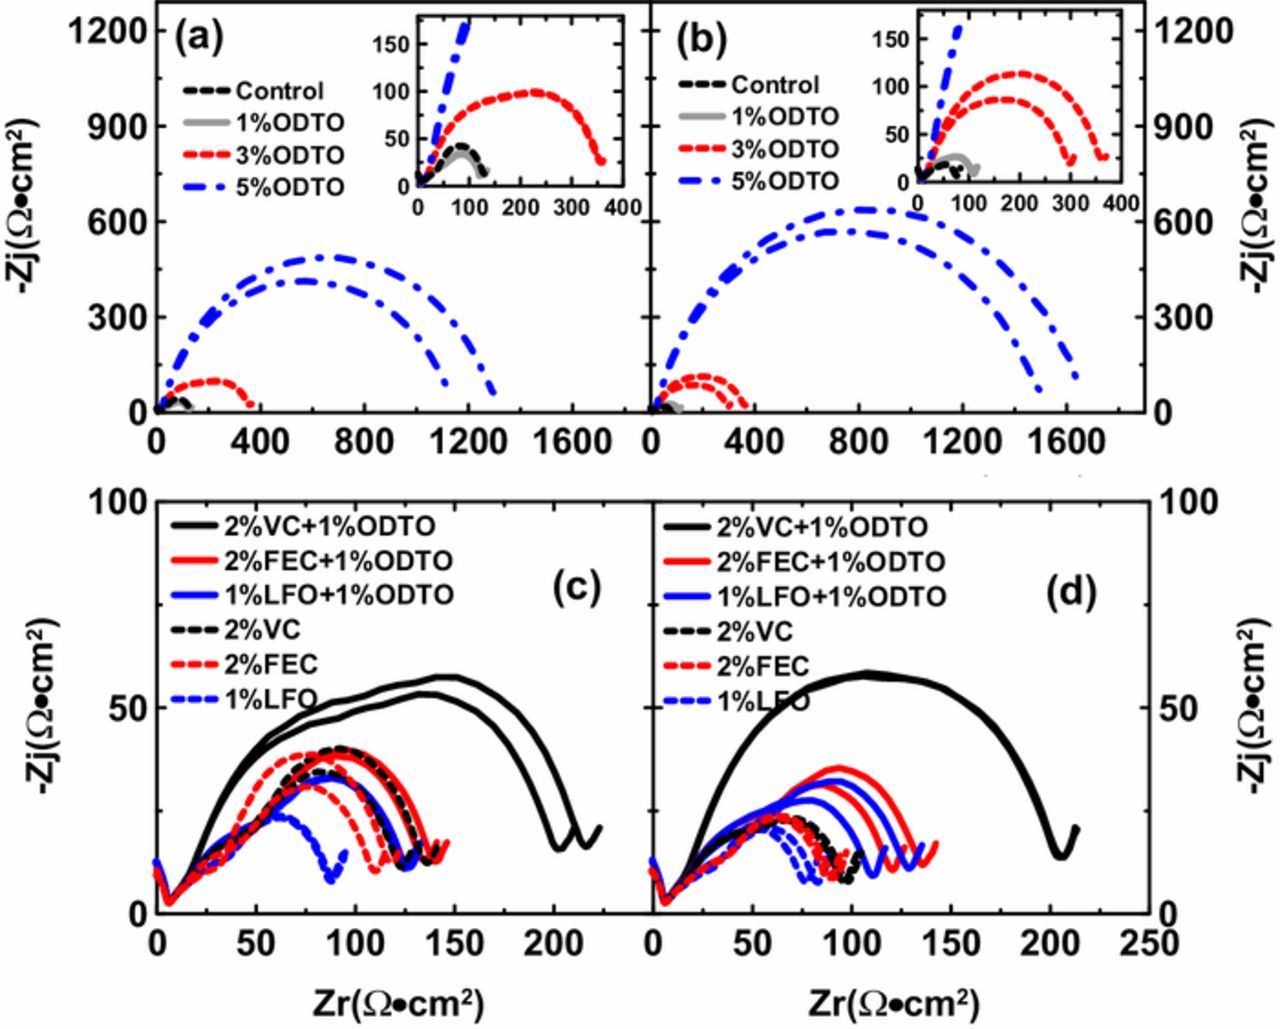
Figure 3. Nyquist plots of uncoated and coated NMC532/AG pouch cells filled with variable additive compositions after formation. (a) and (b): uncoated and coated NMC532/AG cells containing no additive, 1%, 3% and 5% ODTO; (c) and (d): uncoated and coated NMC532/AG cells containing 2% VC + 1% ODTO, 2% FEC + 1% ODTO, 1% LFO + 1% ODTO, 2% VC, 2% FEC and 1% LFO.
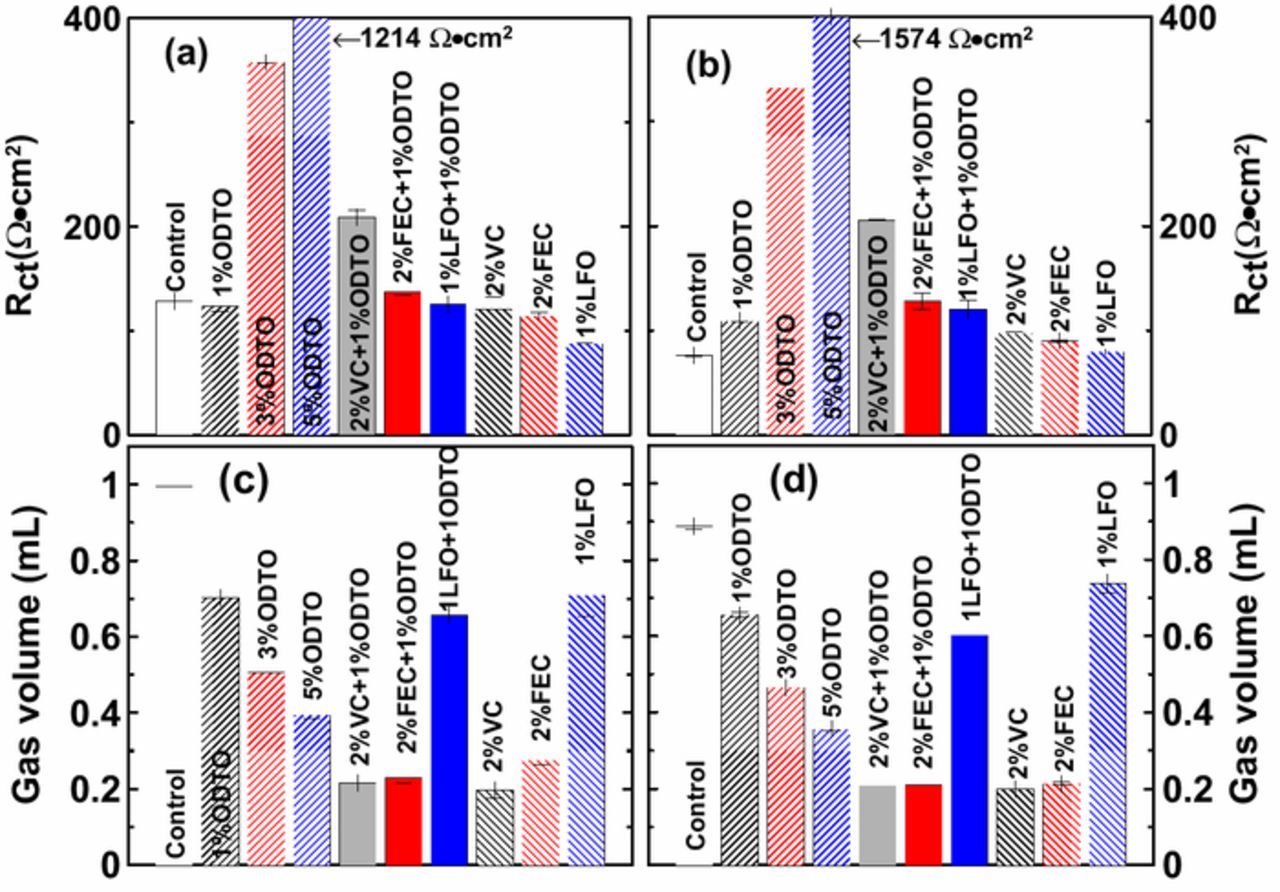
Figure 4. Summary of Rct of uncoated (a) and coated (b) NMC532/AG pouch cells filled with variable additive compositions after formation; Summary of gas volume produced in uncoated (c) and coated (d) NMC532/AG pouch cells after formation.
Figures 4c and 4d show the amount of gas produced after formation in uncoated and coated NMC532/AG pouch cells with different additive compositions, respectively. Gas production was dramatically suppressed when larger amounts of ODTO from 1% to 5% were used compared to the control electrolyte. A combination of 2% VC + 1% ODTO or 2% FEC +1% ODTO further lowered the gas volume which was similar to that in cells with 2% VC or 2% FEC alone. Coated NMC532/AG cells with 1% LFO + 1% ODTO produced a smaller amount of gas than cells with 1% LFO alone, while the gas volumes of uncoated cells with 1% LFO + 1% ODTO and 1% LFO are similar.
Figures 5a and 5b show the XPS spectra of positive and negative electrodes, respectively, taken from uncoated NMC532/AG cells with control electrolyte and with 1% ODTO or 2% VC after formation. Figure 5a shows that positive electrodes taken from the cells with 1% ODTO or 2% VC have thicker SEIs than the electrode taken from the control cell. This is deduced by comparing the area of the NMC lattice oxygen peak at ∼528 eV. This peak was largest for the electrode taken from the control cell, indicating that the SEI layer at the positive electrode surface is relatively thin. This peak is smaller for positive electrodes taken from cells with 1% ODTO or 2% VC, indicating that the SEI layer is thicker. For cells with 1% ODTO or 2% VC, the SEI layer contains more inorganic species (like phosphates, fluorophosphates and LiF) compared to the control cells. S 2p peaks are observed for electrodes taken from cells with 1% ODTO, confirming that ODTO degradation products were involved in the formation of the SEI layer at positive electrode surface during cell formation. The S 2p peak at 168 eV shows that the SEI layer contains sulfur species.
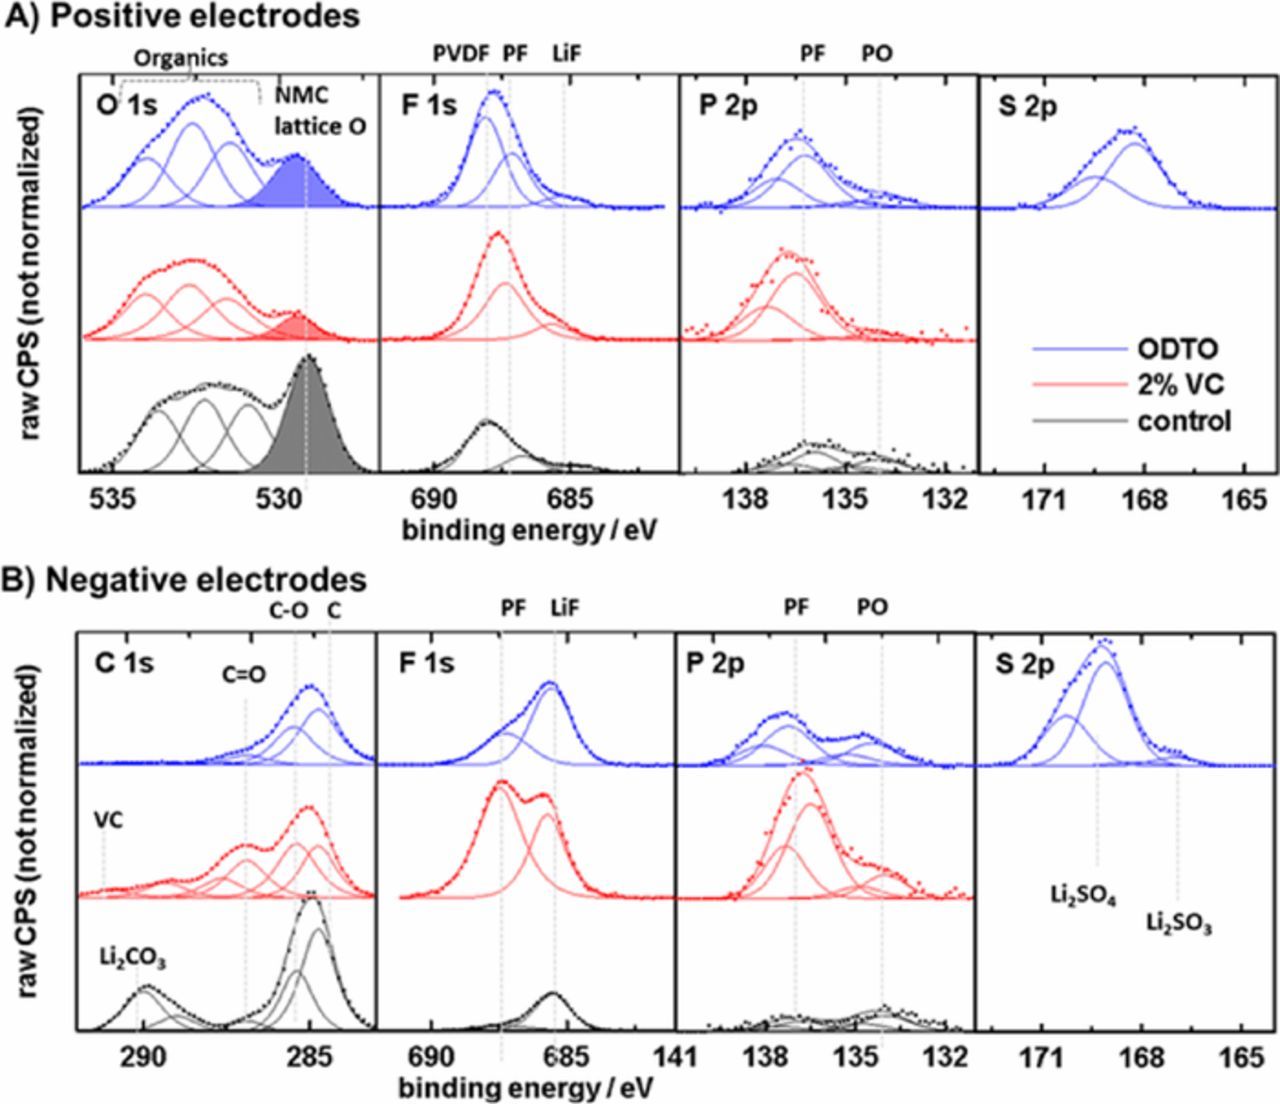
Figure 5. XPS spectra for positive (a) and negative electrodes (b) taken from uncoated NMC532/AG pouch cells containing no additive (control), 2% VC or 1% ODTO after formation.
Figure 5b shows the XPS spectra of negative electrodes taken from control cells and cells with 1% ODTO or 2% VC. The peak from partially lithiated graphite (3.8 V), at 284 eV, is not visible in these spectra, indicating that the SEIs after formation are relatively thick. With some beneficial electrolyte additives, e.g. LiPO2F2, the additives create an SEI layer that is very thin.27 The SEI at the negative electrode from the cells with 1% ODTO or 2% VC contain more inorganic species (like phosphates, fluorophosphates and LiF) compared to the one from the control cell. S 2p peaks were observed for the cell with 1% ODTO, confirming that ODTO degradation products were involved in the formation of SEI layer at negative electrode surface during cell formation. The broad peak between 172 eV and 166 eV and the minor peak at 167 eV resemble those derived from other similar sulfur-containing additives like MMDS, PES, DTD, which correspond to a series of inorganic/organic lithium sulfate or sulfite salts.15,24,28,29 The inorganic SEI components brought about by the electrolyte additives likely leads to improved electrode passivation, fewer parasitic reactions and longer cell lifetime. Recent work shows that the amount of LiF in the negative electrode SEI increases as the SEI matures and becomes more passivating.30
Figure 6 compares the cycling data of coated NMC532/AG cells filled with 2% VC + 1% ODTO or 2% FEC + 1% ODTO versus cells with 2% VC + 1% MMDS or 2% FEC + 1% MMDS at 40°C with a current corresponding to C/3. Figures 6a and 6b show that cells containing 1% ODTO show much better capacity retention than cells containing 1% MMDS when 2% VC or 2% FEC were used as the primary additive, indicating that ODTO is more promising than MMDS as a secondary additive in NMC532/AG cells. Figure 6c shows that cells containing 1% ODTO have smaller ΔV growth rates compared to cells containing 1% MMDS indicating more stable cell impedance with cycling.
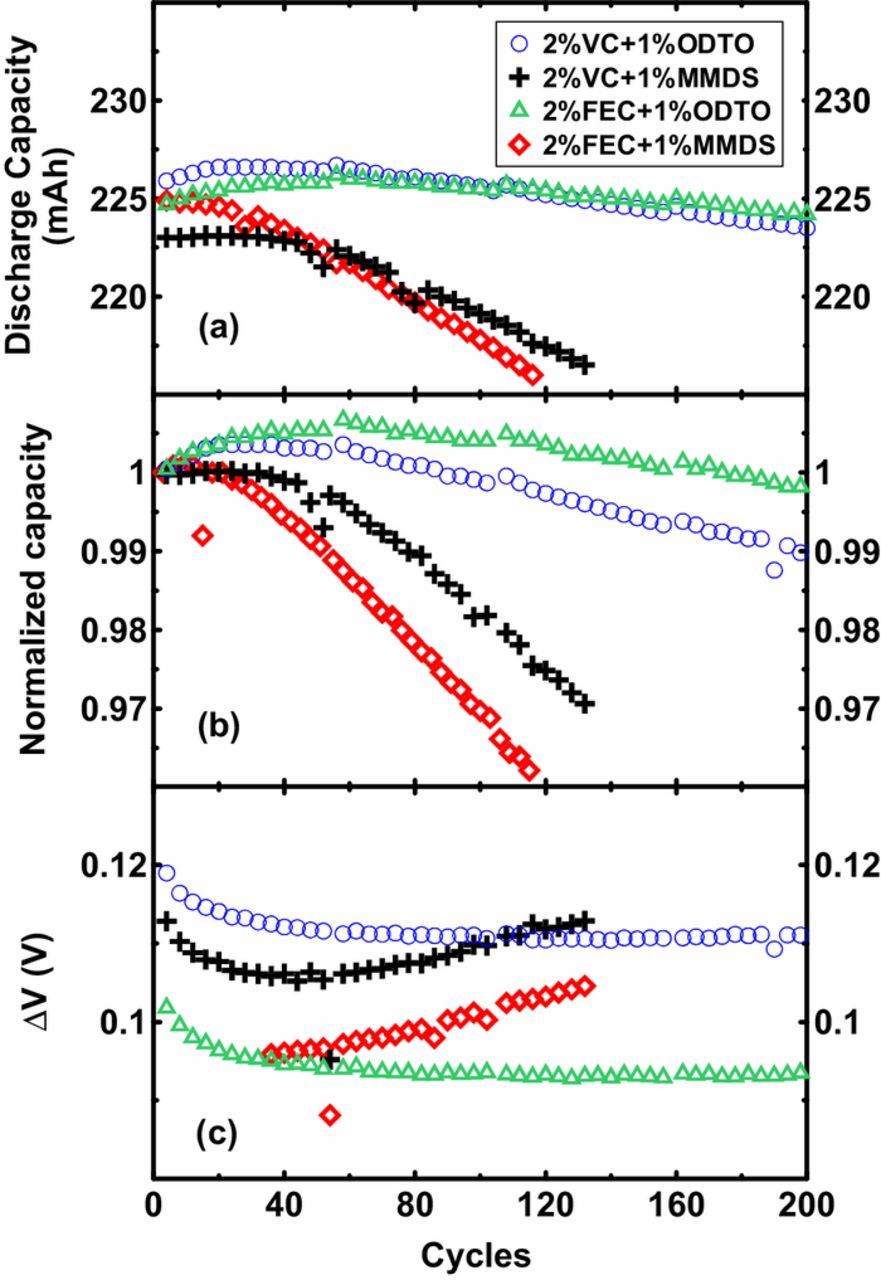
Figure 6. Discharge capacity (a), normalized capacity (b) and ΔV versus cycles of coated NMC532/AG pouch cells containing 2% VC + 1% ODTO, 2% VC + 1% MMDS, 2% FEC + 1% ODTO and 2% FEC + 1% MMDS between 3 V and 4.3 V with a current corresponding to C/3 at 40°C.
Figure 7 shows the UHPC cycling data for uncoated and coated NMC532/AG cells with different additive compositions. A pair of cells was measured for each additive combination and the results are represented with identical symbols. Figure 7a compares the effects of 1%, 3%, 5% ODTO, 2% VC and 2% FEC on the performance of uncoated NMC532/AG cells. Compared to cells with 2% VC or 2% FEC at cycle 16, cells containing 1% ODTO show very poor coulombic efficiency (CE, see Figure 7a1) and higher charge end point capacity slippage (Figure 7a2), but lower capacity fade (Figure 7a3) and smaller ΔV change (Figure 7a4), suggesting the low CE is mainly attributed to the oxidation of electrolyte at the positive electrode. By contrast, cells containing 5% ODTO show low CE (Figure 7a1), high capacity fade (Figure 7a3), large ΔV change (Figure 7a4) and low charge end point slippage (Figure 7a2), indicating that 5% ODTO considerably suppressed electrolyte oxidation at positive electrode side. The cells with 5% ODTO had low CE primarily due to the large capacity fade. Cells with 3% ODTO show comparable CE, discharge capacity fade, and especially lower charge end point slippage compared to cells with 2% VC or 2% FEC.

Figure 7. UHPC results including Coulombic efficiency, charge end point capacity slippage, normalized discharge capacity and ΔV versus cycles (from top to bottom panel) of NMC532/AG cells. (a) uncoated NMC532/AG cells containing 1%, 3%, 5% ODTO, 2% VC and 2% FEC; (b) uncoated NMC532/AG cells containing 2%VC + 1% ODTO, 2% FEC + 1% ODTO, 1% LFO + 1% ODTO, 2% VC and 2% FEC; (c) coated NMC532/AG cells containing 1%, 3%, 5% ODTO, 2% VC, 2% FEC and 1% LFO; (d) coated NMC532/AG cells containing 2% VC + 1% ODTO, 2% FEC + 1% ODTO, 1% LFO + 1% ODTO, 2% VC, 2% FEC and 1% LFO. All the cells were cycled between 3 V and 4.3 V with a current corresponding to C/20 at 40°C.
Figure 7b shows the UHPC data for uncoated cells with 2% VC + 1% ODTO, 2% FEC + 1% ODTO and 1% LFO + 1% ODTO versus cells with 2% VC and 2% FEC alone (the same data as in Figure 7a for comparison). Figure 7b shows that 2% VC + 1% ODTO or 2% FEC + 1% ODTO obviously improved the performance of cells compared to 2% VC or 2% FEC alone, indicating of the benefit of 1% ODTO. Cells with 1% LFO + 1%ODTO show the lowest capacity fade but the highest charge end point capacity slippage.
Figure 7c compares the effect of 1%, 3%, 5% ODTO, 2% VC, 2% FEC and 1% LFO on the performance of coated NMC532/AG cells. Compared to 2% VC, 2% FEC or 1% LFO, coated NMC532/AG cells with 1% ODTO show lower discharge capacity fade but higher charge end point capacity slippage while cells with 5% ODTO show the opposite trend, which is similar to that observed in the uncoated NMC532/AG cells (Figure 7a). It is difficult to determine the effect of 3% ODTO due to the poor consistency between the pair of cells.
Figure 7d shows the UHPC data of coated cells containing 2% VC + 1% ODTO, 2% FEC + 1% ODTO or 1% LFO + 1% ODTO versus cells containing 2% VC, 2% FEC or 1% LFO alone (the same data as in Figure 7c for convenient comparison). Similar to the uncoated cells, 1% ODTO as a secondary additive also significantly improved the UHPC performance of coated cells containing 2% VC or 2% FEC. Coated cells with 1% LFO + 1% ODTO show similar charge end point capacity slippage and CE but much lower capacity fade compared to cells with 1% LFO.
Figure 8 shows the coulombic inefficiency per hour (CIE), fractional charge end point capacity slippage per hour (fractional slippage) and fractional capacity fade per hour (fractional fade) of the uncoated and coated NMC532/AG cells which were derived from the corresponding UHPC data taken from the 12th to 16th cycles in Figure 7. A detailed description of the calculation method can be found in Ref. 3. For both uncoated and coated cells, 2% VC + 1% ODTO led to the lowest CIE. The coating on the positive electrode suppressed the oxidation of electrolyte as indicated by the lower fractional charge end point capacity slippage (see Figure 8b vs. Figure 8e) for cells with 3% and 5% ODTO as well as 2% VC + 1% ODTO, 2% FEC + 1% ODTO and 1% LFO + 1% ODTO, but not significantly for cells with 1% ODTO, 2% VC and 2% FEC. The coating also mitigated the capacity fade of cells containing 3% ODTO, 1% LFO + 1% ODTO, 2% VC and 2% FEC (see Figure 8c vs. Figure 8f). In particular, the coated cells with 1% LFO + 1% ODTO show extremely low fractional fade.
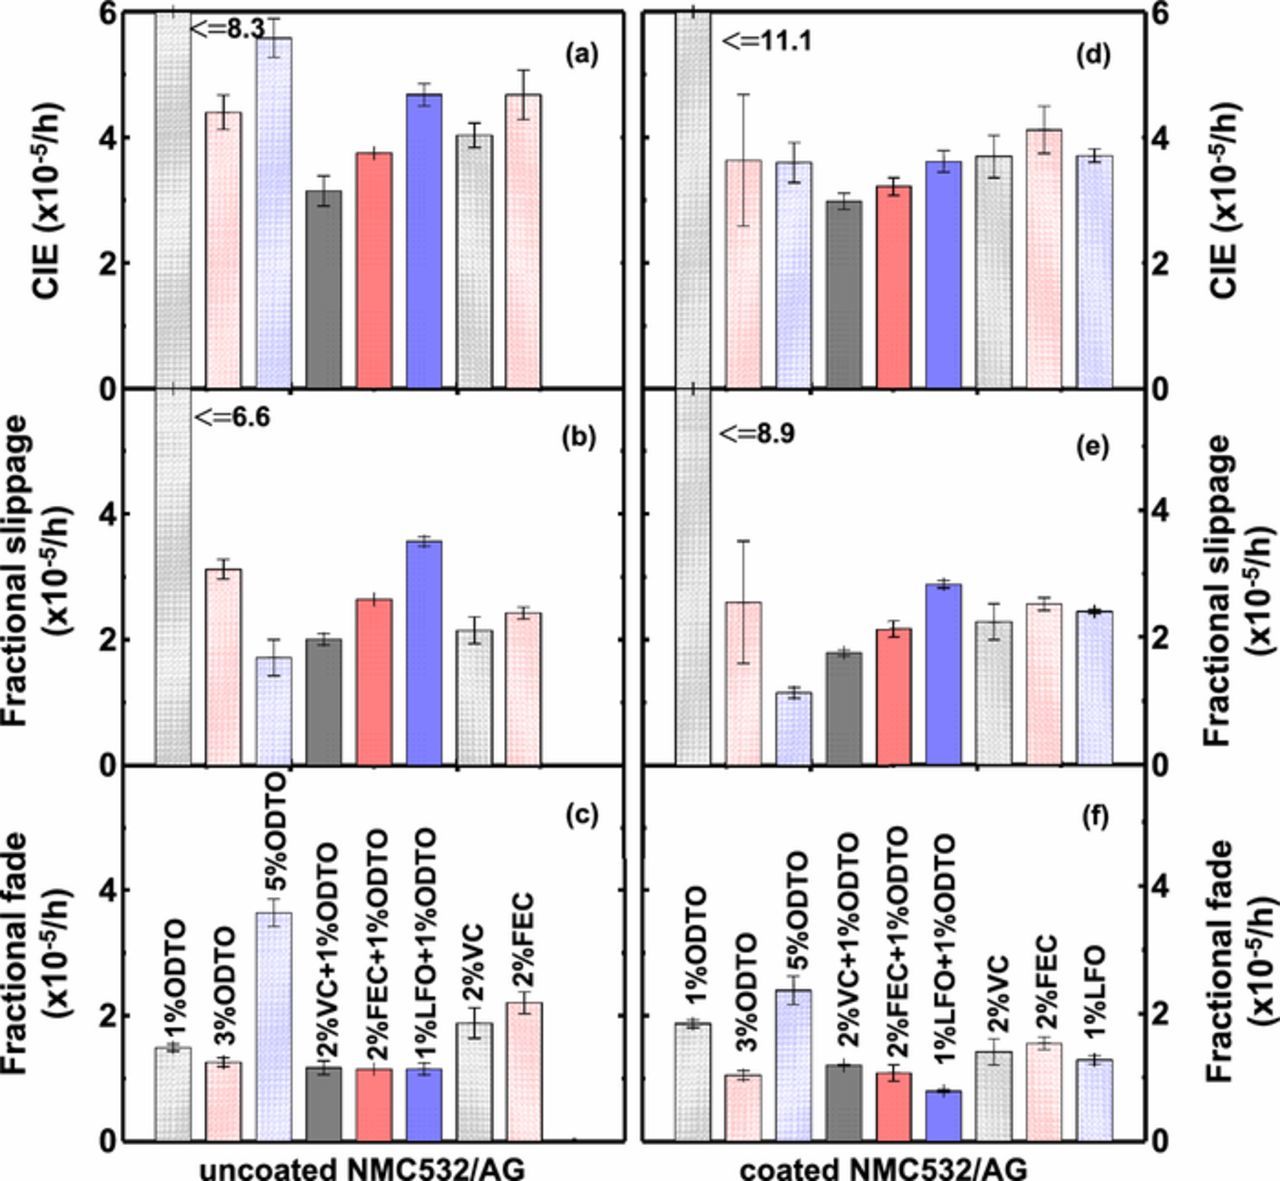
Figure 8. Summary of UHPC results including coulombic inefficiency (CIE), fractional slippage and fractional fade (from top to bottom panel) of uncoated (left) and coated (right) NMC532/AG cells containing variable additive compositions.
Figure 9 shows the long-term discharge capacity (top panels), normalized capacity (middle panels) and ΔV (bottom panels) versus cycle number of uncoated and coated NMC532/AG cells filled with different additives or additive blends. The cycling measurements were performed at 40°C with a current corresponding to C/3. Figure 9 shows that the long-term cycling performances of both uncoated and coated cells are consistent with their corresponding UHPC results. Figures 9a and 9b show the cycling performance of uncoated cells and coated cells, respectively, with 1%, 3%, 5% ODTO, 2% VC or 2% FEC. 1% ODTO alone is not very promising due to the poor quality of passivation at graphite electrode side but 3% ODTO obviously outperformed 2% VC or 2% FEC. Cells with 5% ODTO show very rapid capacity fade during early cycles because of their ultra-high impedance (See Figures 3 and 4). Figures 9a and 9b also show that coated cells cycled better than uncoated cells (except for 5% ODTO), especially in the case of 2% VC or 2% FEC with a much smaller increase in ΔV with cycling (see Figures 9a3 and 9b3). Cells with 3% ODTO show that ΔV decreases during the first 300 cycles likely due to changes in the negative electrode SEI layer with cycles.
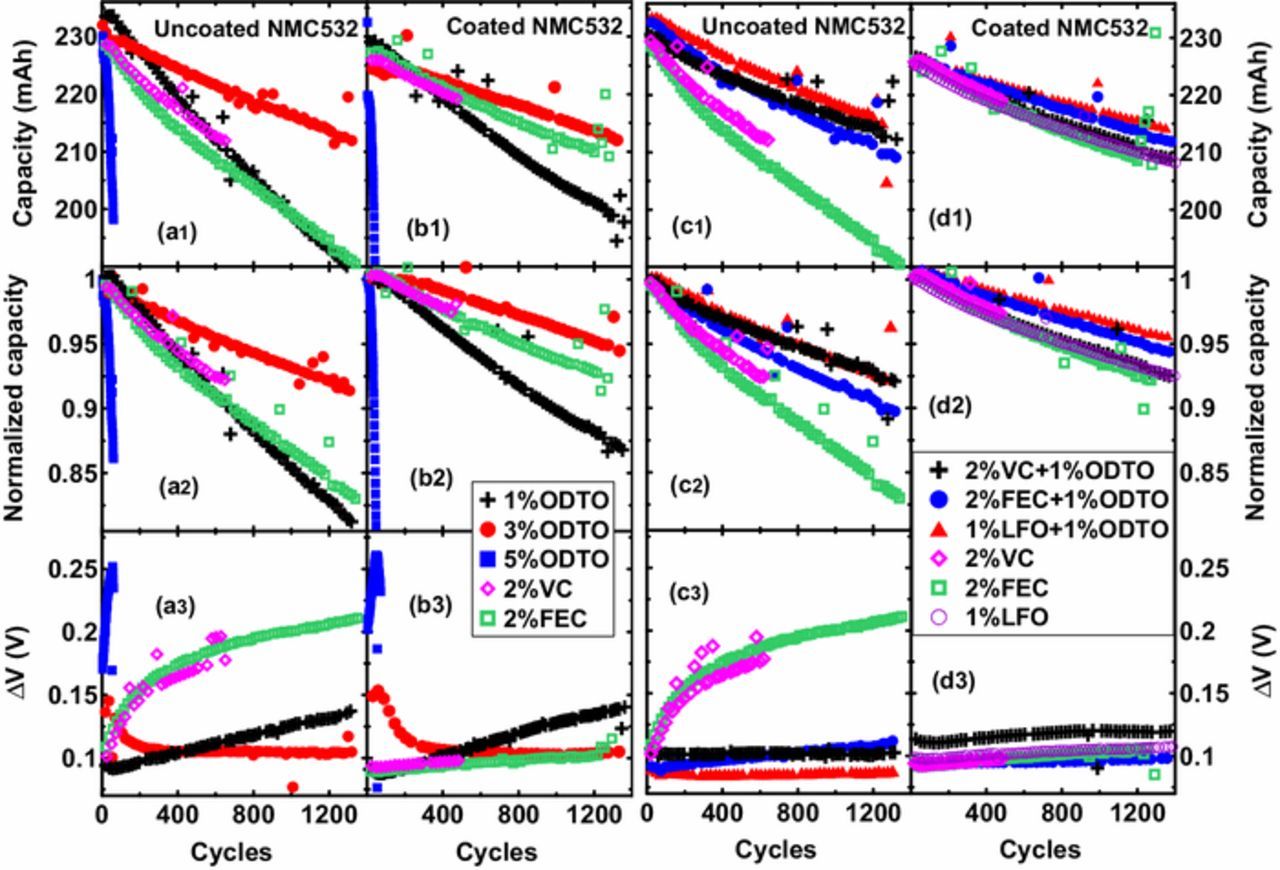
Figure 9. Capacity, normalized capacity and ΔV versus cycles (from top to bottom panel) of NMC532/AG cells. (a) and (b): uncoated and coated NMC532/AG cells containing 1%, 3%, 5% ODTO, 2% VC and 2% FEC; (c) and (d): uncoated and coated NMC532/AG cells containing 2% VC + 1% ODTO, 2% FEC + 1% ODTO, 1% LFO + 1% ODTO, 2% VC and 2% FEC. All the cells were cycled between 3 V and 4.3 V with a current corresponding to C/3 at 40°C.
Figures 9c and 9d show the cycling performance of uncoated and coated NMC532/AG cells, respectively, with 2% VC + 1% ODTO, 2% FEC + 1% ODTO and 1% LFO + 1% ODTO. Figure 9c shows that all three additive blends dramatically outperformed 2% VC and 2% FEC. Uncoated cells with 2% FEC+1% ODTO suffered from quicker impedance growth and hence show quicker capacity fade than cells with 2% VC + 1% ODTO and 1% LFO + 1% ODTO. Figure 9d shows that 2% FEC + 1% ODTO and 1% LFO + 1% ODTO further improved the capacity retention of cells. In particular, 1% LFO + 1% ODTO behaved the best out of all additive compositions and only about 4.2% capacity fade was observed after 1300 cycles at 40°C. 2% VC + 1% ODTO shows a similar effect to 2% VC, 2% FEC or 1% LFO for coated cells, likely attributed to the high Rct after formation (see Figure 2b).
In order to study the effect of ODTO on the cycling of cells at a higher current rate, coated NMC532/AG cells filled with 1% LFO and 1% LFO + 1% ODTO were cycled at 1C charge (CCCV) and 1C discharge at 20°C. Figure 10 shows the discharge capacity, normalized capacity and ΔV versus cycle number of these cells. Two cells with 1% LFO and 1% LFO + 1% ODTO show similar capacity retention after 2200 cycles (98.4% vs. 98.2%). Therefore, the additive combination of 1%LFO + 1%ODTO can support a 1C charge rate in these cells as effectively as 1% LFO.

Figure 10. Capacity (a), normalized capacity (b) and ΔV (c) versus cycles of coated NMC532/AG cells containing 1% LFO + 1% ODTO and 1% LFO between 3 V and 4.3 V at 1C charge and 1C discharge at 20°C.
Conclusions
The electrolyte additive, 1,2,6-oxadithiane 2,2,6,6-tetraoxide (ODTO) can significantly improve the cycling of both uncoated and coated NMC532/AG pouch cells with 1.2M LiPF6 in ethylene carbonate (EC): ethyl methyl carbonate (EMC) (3:7 by weight) as electrolyte. ODTO has a very similar structure to methylene methanedisulfonate (MMDS), but completely outperformed MMDS in these cells. During the first charge to 4.3 V, ODTO shows a differential capacity peak at about 1.4 V (vs. Li/Li+) at the negative graphite electrode side. XPS data confirmed that ODTO can also form a SEI layer at the positive electrode side.
The addition of 1%, 3% and 5% ODTO caused distinct changes to the EIS spectra and gas production of NMC532/AG cells during formation. Cells with 5% ODTO suffered rapid capacity fade because of dramatically increased impedance even though gas production was largely suppressed. Uncoated and coated NMC532/AG cells with 3% ODTO show promising capacity retention of 91.3% and 94.7%, respectively, after 1300 cycles at C/3 and 40°C. However, cells with 3% ODTO initially showed very high impedance (350 Ω•cm2 (measured at 10°C)). By contrast, cells with 1% ODTO alone do not lead to satisfactory cycling performance. UHPC results show that the combination of 1% ODTO with 2% VC, 2% FEC or 1% LFO can significantly lower the CIE and capacity fade of both uncoated and coated cells. In particular, coated NMC532/AG cells filled with 1% LFO + 1% ODTO showed promising capacity retention of 95.8% after 1300 cycles between 3.0 and 4.3 V at C/3 and 40°C. Cells with 1% LFO + 1% ODTO also show similar capacity retention as cells with 1%LFO after 2200 cycles at 1C charge and 1C discharge and at 20°C.
The coated NMC532/AG cells showed much better cycling performance than the uncoated cells when 2% VC or 2% FEC were used as an additive. This makes the benefit of 1% ODTO in coated cells less distinctive than in uncoated cells. Uncoated and coated NMC532/AG cells filled with 3% ODTO or 2% VC + 1% ODTO show very similar capacity retention during long-term cycling at C/3, indicating that the functional coating at the positive electrode side may not be needed when appropriate additives are used.
Acknowledgments
The authors would like to thank Tesla Canada and the Natural Science and Engineering Research Council of Canada (NSERC) for financial support under the auspices of the Industrial Research Chairs program. The authors thank Dr. Jing Li (formerly of BASF) for supplying some of the electrolyte solvents and additives used in this work. The authors thank Dr. Deijun Xiong and Dr. Qiao Shi (both formerly from Shenzhen Capchem) for supplying the LiPO2F2 used here. The authors thank Guangzhou Tinci for supplying the ODTO used in this work. Lin Ma thanks the Killam Trusts and Leah Ellis thanks NSERC for scholarship support.
ORCID
L. D. Ellis 0000-0001-8775-6465
J. R. Dahn 0000-0002-6997-2436