
Abstract
The anodic dissolution and associated hydrogen evolution of high purity Mg (80 ppmw Fe) was studied as a function of potential in unbuffered 0.6 M NaCl (pH ≈ 8.5), 0.6 M NaCl saturated with Mg(OH)2 (pH ≈ 10.25), 0.1 M MgCl2 (pH ≈ 5.6), 0.1 M Na2SO4 (pH ≈ 5.5), and a 0.1 M Tris(hydroxymethyl)aminomethane hydrochloride (TRIS, pH ≈ 7.25) buffer solution via simultaneous mass loss, hydrogen volume collection, potentiostatic and potentiodynamic polarization, and inductively coupled plasma-optical emission spectroscopy (ICP-OES). The negative difference effect (NDE) was substantial in the unbuffered Cl− containing environments where Mg(OH)2 formed on the surface and weak in 0.1 M Na2SO4. In contrast, the 0.1 TRIS buffered solution exhibited a positive difference effect and the absence of thick corrosion films. Mg(OH)2 films formed on samples in Cl− spalled off easily whilst the Mg(OH)2 films formed in 0.1 M Na2SO4 were more tenacious, which suggests that film stability plays significant role in the NDE.
Export citation and abstract BibTeX RIS

This is an open access article distributed under the terms of the Creative Commons Attribution 4.0 License (CC BY, http://creativecommons.org/licenses/by/4.0/), which permits unrestricted reuse of the work in any medium, provided the original work is properly cited.
Research and development of magnesium (Mg) and its alloys has greatly increased in the last 15 years primarily due to the demand for lightweight vehicles in the automotive and aerospace industries,1 in addition to the exploration of Mg as an anode material in primary and secondary batteries.2 However, the poor corrosion resistance and complex dissolution behavior of Mg has limited its wider use as an engineering material.3–5 One aspect associated with Mg dissolution which has not to date been mechanistically elucidated in full, is the phenomenon known as the negative difference effect (NDE).3 This effect is characterized by an increase in the rate of hydrogen evolution with increasing anodic overpotential relative to the open circuit - which provides a local cathodic reaction for a significant portion of the anodic reaction.6 This phenomenon confounds the understanding of Mg dissolution mechanisms, establishment of a Tafel law and other reaction kinetic parameters, as well as other issues including accurate analysis of corrosion rates from electrochemical impedance spectroscopy (EIS).7–9 There are several theories purporting to explain the origins of the NDE among which include noble impurity element enrichment,10,11 non-faradaic mass loss via metal spalling,12,13 formation and dissolution of hydrides and partially protective films,14–17 and univalent Mg based dissolution followed by further oxidation of Mg+→Mg2+ in solution (leading to hydrogen evolution from the reduction of water away from the electrode in the electrolyte);18 however, no consensus has been reached on the physical origins of the NDE.
The contemporary paradigm for the manifestation of the NDE centers on evidence for the enhanced cathodic activity of dissolving Mg anodes;19 whereby numerous works confined within a relatively recent timeframe have elucidated such a phenomenon. Evidence of enhanced cathodic activity has been reported by Williams and co-workers through use of the scanning vibrating electrode technique (SVET) which has shown the temporal evolution of net cathodically active regions at prior net anodic sites on 99.9%10 and 99.99%6 pure Mg, Mg-Al-Zn alloy AZ31B,11 and Mg-Nd binary alloy surfaces,20 under free corrosion and during galvanostatic anodic polarization. As such, the NDE being a manifestation of enhanced cathodic activity affiliated with anodic sites may be considered non-controversial, however the important remaining question still remains as to what physical mechanism is responsible for the enhanced cathodic activity. So-called 'activated' cathodic areas are characterized by the appearance of an optically 'black' corrosion film but it is unclear as to what characteristics of such dark regions translate to cathodic activation. It has been argued by many that the growing anode sites specifically possess the highest reaction rate for HER.21–23 Another important aspect of the SVET work is that the measured net cathodic current density at these cathodic sites increased as the net anodic current density became greater to maintain charge balance ( ). However, the integrated net cathodic current density with time from the SVET at steady state is much less than the volumetric hydrogen evolution rated.21 Moreover, the majority of hydrogen evolved is visibly seen to originate at the head of most actively advancing corrosion fronts and is not uniform across the blackened areas which may suggest that the 'older' and net cathodic regions are not the primary source of anodic hydrogen evolutione.21–23 Further electrochemical evidence for cathodic activation was shown through a series of alternating anodic and cathodic polarization scans which revealed increasing cathodic kinetics with increasing anodic polarization of Mg surfaces.24 Additional cathodic potentiodynamic polarization scans performed after various anodic treatments also revealed an increase in the corrosion potential, in addition to increased cathodic kinetics.24,25 However, it was shown recently by Fajardo and Frankel that extrapolation of cathodic potentiodynamic polarization does not account for the high enhanced HER rates measured by H2 gas collection measured during anodic polarization.26 An additional study has further shown agreement between extrapolation of cathodic polarization curves and the integrated net cathodic current measured by SVET.27 This is consistent with the notion that the anodic dissolution itself plays a causal role for the enhanced catalytic effect; whilst noting that it is difficult to assess anodic HER kinetics via cathodic potentiodynamic polarization without the original pertinent "anodic" based surface chemistry changing throughout the duration of the scan.
Several studies have recently been performed to evaluate the enrichment of noble metal elements and secondary phases on corroding Mg surfaces. Transmission electron microscopy (TEM) of focused ion beam (FIB) cross sections have shown that secondary phase particles such as Fe-rich particles (99.9% pure Mg)25 and AlxMny particles (AZ31B)28 are incorporated in the MgO/Mg(OH)2 bilayer in addition to the enrichment of solute elements such as Al29 and Zn28,30 at the metal/oxy-hydroxide interface. Noble metal enrichment has also been shown using Rutherford backscattering spectroscopy (RBS)31 and particle induced X-ray emission measurements.32 RBS measurements revealed the enrichment of 99.9% pure Mg (80 ppmw Fe) both within the corrosion film and at the film/metal interface which is consistent with observations from TEM. In addition, solution analysis by inductively coupled plasma optical emission spectroscopy (ICP-OES)31 and in situ atomic emission spectroelectrochemistry (AESEC) of pure Mg with various concentrations of Fe33,34 did not reveal any detectable amounts of Fe or other noble elements in solution which strengthens the notion that noble elements are enriching on the surface. The evidence of noble metals enriching on the corroding Mg surface is important, as the concentration of Fe and other noble impurities is well known to have a large effect on hydrogen evolution kinetics of Mg alloys;26,35,36 however, it is still unclear as to what extent any metal enrichment contributes to the manifestation of the NDE, as the enrichment efficiency has been empirically demonstrated to be poor.32,36 Furthermore, the attendant change in surface Fe concentration is unlikely to fully account for the NDE based on extrapolation of cathodic data to anodic regions albeit for slow cathodic scans where kinetics are underestimated.26,32,36 As such, whilst some enrichment of metals undoubtedly occurs on dissolving Mg surfaces, this might only partly account for the NDE phenomenon, meaning that the NDE as observed might also be influenced by the effects of pH and the formation of surface films – also posited to play a dominant role.37–40
The effect of pH on the NDE was recently studied by Rossrucker et al. using an electrochemical flow cell with downstream inductively coupled plasma-mass spectroscopy (ICP-MS)41 as well as in bulk solutions with no external convection for buffered 0.1 M NaCl solutions in the pH range 3–10.5. It was found that the NDE was strong in alkaline environments but decreased with decreasing pH. Decreasing pH will decrease the tendency to form hydroxide films, but also was posited to perhaps influence impurity enrichment on the basis that impurity metals may dissolve at lower pH. Moreover, in the work of Rossrucker et al.41 the NDE was not observed up to an applied current density of 10 mA/cm2 for 6000 s in pH = 3, 0.1 M NaCl buffered solution, and no corrosion films were observed to form optically. Interestingly, the HER rate decreased at small applied anodic current densities and then increased in both pH = 3 and 7 buffered solutions, before increasing at higher applied anodic current densities. The increase in HER rate was attributed to the buffering capacity being locally overwhelmed (and hence allowing local alkalization) by the large applied current density. This behavior was also previously observed by James et al. in several unbuffered dilute acids.42 In addition, Lebouil et al. showed that no NDE occurred in a pH = 6.7 phosphate buffer solution but did note the presence of a film, likely to be Mg(HPO4)2 from thermodynamic considerations, as the buffer would not produce a pH high enough for Mg(OH)2 to form.43 Additional work by Lebouil et al.43 considered two mechanisms occurring on corroding Mg surface: dissolution following:
![Equation ([1])](https://content.cld.iop.org/journals/1945-7111/164/6/C300/revision1/d0001.gif)
where e− are consumed by a remotely located cathodic reaction and an insoluble film-forming mechanism resulting in manifestation of the NDE where x is the fraction of soluble Mg2+ formed:
![Equation ([2])](https://content.cld.iop.org/journals/1945-7111/164/6/C300/revision1/d0002.gif)
This reaction occurs at cathodes proximate to the anodic sites and is supported by the observation that the H2 produced is proportional to the Mg(OH)2 film formation.f Moreover, HER in such a reaction may not necessarily be assessed in a cathodic polarization scan. It should be noted that the film forming mechanism may also be described by:
![Equation ([3])](https://content.cld.iop.org/journals/1945-7111/164/6/C300/revision1/d0003.gif)
based on the observations of a nanoscale thin layer of MgO at the interface of the Mg metal and Mg(OH)2, from TEM analysis.28–30,44–47 The film forming mechanism is consistent with observations that the majority of H2 evolution occurs at the head of the advancing corrosion front where the dark corrosion product forms; however, it does not explain observations of net cathodically active regions far away from the anodic front as shown by SVET7,11,12,20 and also increased cathodic kinetics associated with Mg(OH)2 covered surfaces.38
Recent efforts in modeling have also provided insight to the NDE.37,40,48–50 These models have shown that water dissociation and hydrogen evolution are more likely on surfaces which are covered with hydroxide and also with the presence of certain impurities such as transition metals and many rare-earth metals. Such findings provide support for many theories above but a model recently proposed by Taylor50 has been able to simulate the NDE to a certain extent by exploring a Tafel based reaction mechanism for HER on Mg and applying a surface kinetic model. This is the first to simulate the NDE and may lead to further advances in the modeling and understanding of Mg corrosion.
The aim of the present study is to provide focused insight toward the surface, chemical, and electrochemical factors that govern anodically induced cathodic activation and manifestation of the NDE; few studies are conducted systematically using a consistent approach in a variety of solutions. The empirical work herein can also be viewed as important practical evidence in the context of recent modeling works indicating that the nature of dissolution products and surface films play an important role in the NDE, on the basis that Mg(OH)2 has been posited to support water reduction at enhanced rates relative to Mg metal,40 and calculated surface Pourbaix diagrams suggesting a tendency for Mg(OH)2 to form at pH values which are only slightly alkaline.49 Herein, 99.9% nominal high purity Mg was subjected to 24 hour anodic potentiostatic polarization followed by cathodic potentiodynamic polarization in 0.6 M NaCl (pH ≈ 8.5), 0.6 M NaCl saturated with Mg(OH)2 (pH ≈ 10.25), 0.1 M MgCl2 (pH ≈ 5.6), 0.1 M Na2SO4 (pH ≈5.5), and 0.1 M Tris(hydroxymethyl)aminomethane hydrochloride pH ≈ 7.25 buffer solution (referred to as TRIS for the remainder of this paper). These electrolytes were selected to provide a range of species, solution activities, and pH to explore conditions where formation of corrosion films would be either promoted or thermodynamically unlikely. Raman spectroscopy was used to determine the molecular identity of surface films that formed during anodic polarization in each environment, while solution analysis was performed by ICP-OES to determine the identity of soluble species in solution.
Experimental
Materials
High purity, 99.9% nominal, Mg rod (80 ppmw Fe) with a diameter of 7.9 mm was used in this study as supplied by Alfa Aesar (Table I).
Table I. Composition of high purity Mg used in this study in weight ppm (μg/g). Compositional analysis was performed by Quality Analysis and Testing Corporation, USA.
| Element | Mg | Al | Zn | Mn | Fe | Zr | Ni | Cu |
|---|---|---|---|---|---|---|---|---|
| ppmw | Bal. | 200 | 300 | <100 | 80 | <100 | <10 | 30 |
Samples were mounted in epoxy resin with a Ni ribbon attached to provide an electrical connection and mechanically ground to a 1200 grit SiC finish using ethanol as lubricant. Sample surfaces were cleaned with ethanol and dried with compressed air after each successive grinding step. After completion of grinding, samples were placed under vacuum in a desiccator for up to 24 hours to ensure that all water was removed from the epoxy for accurate mass loss measurements.
Electrochemical testing
Electrochemical testing was performed using a three electrode vertical 'flat-cell' with a saturated calomel reference electrode (SCE) and platinum mesh counter electrode. An electrolyte filled burette with a funnel attached was centered over the sample for H2 capture as described elsewhere.8 Both the funnel and burette were made out of glass to minimize hydrogen bubbles forming on the funnel and burette walls and to prevent H2 permeation through polymeric materials.51 In this study, quiescent 0.6 M NaCl, 0.6 M NaCl saturated with Mg(OH)2, 0.1 M MgCl2, 0.1 M Na2SO4, and 0.1 M TRIS buffer solutions were used. All solutions were prepared using 18.2 MΩ deionized water at 25°C and pre-charged with hydrogen with exception to 0.1 M MgCl2 due to oxidation of Cl− to Cl2 gas on the counter electrode during charging. The initial pH of each solution was measured to be as their natural pH with exception to 0.6 M NaCl solution which produced an initial pH in the range of 8–9 discussed in our previous work.31 The TRIS buffer solution was acquired as 1 M, pH = 7 solution and diluted to a concentration of 0.1 M resulting in an initial pH of ≈7.25.
The procedure for the electrochemical testing used in this investigation is outlined in Fig. 1. All samples were subjected to 24 hour anodic potentiostatic holds in the range of −1.55 VSCE to −1.40 VSCE immediately following exposure to the electrolyte; additional potentials were tested in certain electrolytes to validate any trends. IR correction was not carried out for the potentiostatic polarization as it is not required for charge balance calculations to be made and is not relevant to HER in the anodic region. Following potentiostatic polarization, samples were allowed to rest at their open circuit potential (OCP) for 1 min before a cathodic potentiodynamic polarization scan from OCP to −3 VSCE at a scan rate of 2500 mV/s. Such a fast scan rate allows for an expanded range of activation controlled kinetics to be explored which can lead to more confident estimations of Tafel kinetics and also minimize changes in solution chemistry (i.e. pH and other dissolved ion concentration) on the sample surface throughout the duration of the scan. All solutions were also retained for cathodic polarization scans of film free surfaces after removing dissolution products and for analysis by ICP-OES. Dissolution products were cleaned from sample surfaces using 200 g/L CrO3 according to ASTM G1,52 which removes corrosion films whilst not causing further dissolution of the Mg metal. Samples were then placed under vacuum in a desiccator for a 24-hour period before the final mass was measured. Following mass loss measurements, the cleaned samples were then subjected to an additional cathodic polarization scan at 2500 mV/sg from OCP to −3 VSCE after completion of 1 minute at OCP using the solution that was retained from previous cathodic polarization scans, to enable a comparison of cathodic kinetics with the surface films intact and after cleaning of any surface films from the surface (referred to as 'film' and 'film free', respectively) without alteration of the bulk solution environment. Cathodic polarization scans on freshly ground samples which were subjected to CrO3 acid cleaning did not reveal a statistically significant difference in the measured cathodic kinetics compared to samples to freshly ground samples which were not CrO3 cleaned thus bringing confidence in analysis of film vs film free kinetics. It should be noted that some scans were terminated before reaching −3 VSCE due to a 10 mA limit for potentiodynamic scans on certain potentiostats used in this study.

Figure 1. Schematic of the electrochemical testing procedure used in this study.
Gravimetric mass loss measurements were performed using a scale with ± 0.01 mg resolution and converted to a corresponding charge density via Equation 4:
![Equation ([4])](https://content.cld.iop.org/journals/1945-7111/164/6/C300/revision1/d0004.gif)
where z is the equivalent electrons per mole of Mg oxidized, n is the number of moles of Mg consumed, Δm is the change in mass, F is Faraday's constant, A is the area of the electrode, and a is the molar mass of Mg. In this study, z is assumed to be 2 for HP Mg following the half-cell reaction Mg → Mg2+ + 2e−. The hydrogen collected during testing of pre-saturated solutions was converted to a corresponding cathodic charge density using the ideal gas law in combination with Faraday's Law:
![Equation ([5])](https://content.cld.iop.org/journals/1945-7111/164/6/C300/revision1/d0005.gif)
where z = 2 (i.e., 2H+ + 2e− → H2), P is the pressure inside the burette (1 atm), n is the number of moles of H2 gas given by the ideal gas law, V is the volume of gas in the burette, F is Faraday's constant, R is the ideal gas constant, and T is temperature. The net charge density from the measured current was determined from the integrated signal of current density vs. time transient at each potential.
![Equation ([6])](https://content.cld.iop.org/journals/1945-7111/164/6/C300/revision1/d0006.gif)
The charge balance under anodic polarization is therefore described by Equation 7:
![Equation ([7])](https://content.cld.iop.org/journals/1945-7111/164/6/C300/revision1/d0007.gif)
following fundamental mixed potential theory53 where  is the summation of all HER occurring on the surface (ie
  following the notation of21).
Inductively coupled plasma – optical emission spectroscopy (ICP-OES)
All solutions tested were recovered for solution analysis using a Thermo Scientific iCAP 7200 ICP-OES. Each solution was acidified with additions of 1 M HCl to dissolve all insoluble dissolution products. Solutions were not diluted in contrast to our previous study31 in an attempt to boost the emission signal of impurity elements in solution. Furthermore, the CrO3 solution used to clean dissolution products off samples was collected and analyzed to account for impurity atoms which may be trapped in the dissolution product films. However, analysis of the dissolution products collected from CrO3 cleaning proved to be unsuccessful due to the impurity concentration of Fe in the CrO3 which is was measured to be between 100–300 ppmw and thus did not allow for accurate quantitative analysis. In this work, the emission intensity of Mg (279.553 nm, 280.270 nm), Al (226.910 nm, 308.215 nm, 396.152 nm), Fe (238.204 nm, 239.562 nm), Mn (257.610 nm, 259.373 nm), Zn (206.200 nm, 213.856 nm), and Zr (339.98 nm, 343.823 nm) were recorded and used for the calculation of charge consumed and percent of elements in solution. The approximate detection limit for each element is shown in Table II.
Table II. Approximate elemental detection limits for the ICP-OES used in this investigation in ppm (mg/L).
| Element | Mg | Al | Zn | Mn | Fe | Zr | Ni | Cu |
|---|---|---|---|---|---|---|---|---|
| ppm | 0.005 | 0.030 | 0.005 | 0.005 | 0.005 | 0.020 | 0.005 | 0.010 |
Raman micro-spectroscopy of Mg surfaces
Raman Spectroscopy was performed on sample surfaces after completion of potentiostatic polarization with corrosion products intact using a Renishaw Leica Raman Microscope. Scans were performed from 150 to 1200 cm−1 utilizing a 200 mW, 514 nm laser at 50% power under a 20x objective lens through a 1800 l/mm visible grating; the laser spot size was on the order of 5 μm. Scans were accumulated twice with a 60 second exposure under standard confocality on at least three different areas of each sample. Background subtraction of spectra was not performed but spectral artifacts from the instrument were removed from each spectrum without interference of verified real peaks. Peak identification was made using standard spectra in the RRUFF project database.54 No quantitative analysis of the concentration of identified species was performed as only species identification was desired for this study and a careful internal standard method must be adopted for each species.
Results
Potentiostatic polarization of Mg – evidence for enhanced cathodic kinetics
The potentiostat recorded net current density traces as a function of time are shown in Figs. 2a through Fig. 2e for potentiostatic testing in various solutions. The corresponding initial and final bulk pH of each solution at each potential are reported in Fig. 2f.
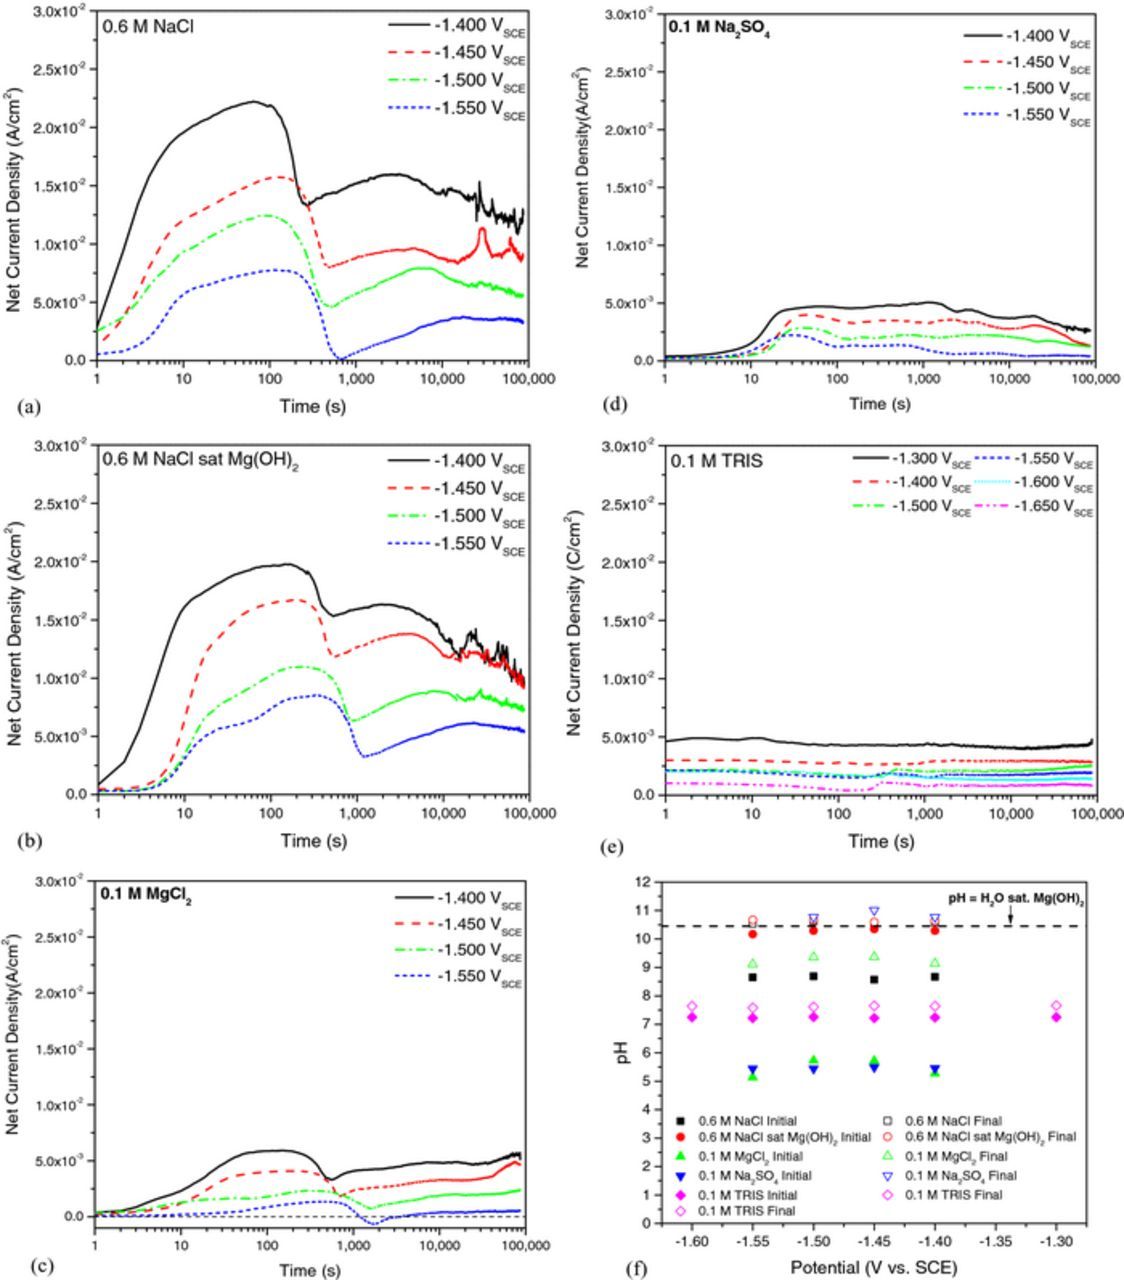
Figure 2. Potentiostat recorded net current density as a function of time for 99.9% pure Mg in solution for 24 hours at the designated potentials in quiescent (a) 0.6 M NaCl, (b) 0.6 M NaCl saturated with Mg(OH)2, (c) 0.1 M MgCl2, (d) 0.1 M Na2SO4, and (e) 0.1 M TRIS buffer solution. The change in measured pH before and after testing is shown in (f).
Two distinct regions are shown in Fig. 2a for potentiostatic polarization of Mg in 0.6 M NaCl. The first region occurs within the initial 1000 seconds of polarization where an increase in the net anodic current density is observed, followed by a decrease in net current density to a local minimum. During this time period, dark corroded regions, typically associated with enhanced cathodic kinetics, initiated on the sample surface and grew in the form of rapidly expanding disks. The maximum value and subsequent decrease in net anodic current in region one may be associated with increasing cathodic area and therefore increasing cathodic kinetics; however, H2 was not captured as a function of time so it is unclear whether or not the rate of H2 evolution increased during this time period. Growth of the dark corroded regions continued until the minimum current density value corresponding to when the entire Mg anode surface became covered with the dark film - which may indicate the end of dissolution governed by localized processes. The second regime of net current density would therefore occur under a more uniform type of dissolution with a decrease in net anodic current density attributed to thickening of the dark film on the Mg surface; the nature of the increase in net anodic current immediately following the minimum is unclear at this time. In addition, the dark film changes to a white color as it thickens which is normally associated with Mg(OH)2.
Similar behavior is observed with both 0.6 M NaCl saturated in Mg(OH)2 and 0.1 MgCl2 solutions, over a similar range of time as indicated in Figs. 2b, 2c. However, the maximum height of the first peak in current in 0.6 M NaCl saturated with Mg(OH)2 is less than that measured in non-saturated 0.6 M NaCl, and the decrease in net current density between this maximum and corresponding minimum is also less for saturated 0.6 M NaCl solution compared to non- Mg(OH)2 saturated solution. In addition, the minimum in current density is shifted to later times for saturated 0.6 M NaCl solution which suggests that the possible increase in cathodic kinetics was not as great as in non-saturated 0.6 M NaCl solution and that the dissolution rate is less for 0.6 M NaCl saturated with Mg(OH)2. This is not surprising since Mg dissolution would occur in the Mg(OH)2 stable region of the Mg E-pH diagram for the entire duration tests in 0.6 M NaCl saturated in Mg(OH)2 whilst non-saturated 0.6 M NaCl samples would spend some period of time corroding in the Mg2+ stable region before increases in bulk pH cause dissolution of Mg to shift to the Mg(OH)2 region as indicated by the final pH values reported in Fig. 2f. Note that the change in pH is reflective of reactions occurring on both the Mg working electrode and Pt counter electrode and should vary with the amount of charge for unbuffered solutions. However, local increases in pH due to rapid H2 evolution (2H2O + 2e− →H2 +2OH−) and supersaturation of Mg2+ ([Mg2+] = 1.12 × 10⁻⁴ M required for saturation of Mg(OH)2 in H2O55) in solution near the Mg surface is likely to be great enough to provide conditions where Mg(OH)2 films form behind the advancing anodic front. The change in pH for 0.1 M MgCl2 (Fig. 2f) was not as great as that observed in 0.6 M NaCl which is not surprising given the smaller relative net anodic current densities observed at each applied potential. These lower current densities are a result of the decreased Cl− content in the 0.1 M MgCl2 solution tested here compared to 0.6 M NaCl.
The potentiostatic behavior for 0.1 M Na2SO4 is shown in Fig. 2d. The net anodic current densities at each potential are similar to those in 0.1 M MgCl2; however, there is little evidence of enhanced cathodic activity which is characteristic with the Cl− containing solutions test in this investigation. The net current density is relatively stable throughout the duration of the test with decreases in the net current density likely due to thickening of films on the Mg surface. Corrosion of Mg in the presence of sulfate also differed from the behavior observed with chlorides in that the anode surface became covered with white film which became progressively thicker with time immediately after breakdown of the air formed oxide. Few black filaments formed which are noted to form in Cl− containing environments. As in the case of Na2SO4, the net current density transient for samples tested in 0.1 M TRIS buffer solution (Fig. 2e) were relatively stable with time. Moreover, TRIS displayed no evidence of enhanced cathodic activity (typically indicated by a decrease in net anodic current density) and Mg samples exposed to TRIS buffer solution did not show the appearance of a surface film upon visual inspection. However, this does not exclude the possibility for nanoscale film formation on TRIS anode surfaces but an average final pH near 7.6 (Fig. 2f) indicates that Mg(OH)2 films would not be thermodynamically stable throughout the duration of the test.
Characterization of sample surfaces after potentiostatic polarization by Raman spectroscopy is shown in Fig. 3. The spectra shown are representative of the typical scan on sample surfaces in each electrolyte. The peaks present at 278 cm−1and 443 cm−1 are indicative of brucite, Mg(OH)2 whilst the peak observed at 1075 cm−1 may be indicative of the formation of a carbonate species.54 Note that the scattering intensities of each peak are related to incident laser intensity, molecular vibration frequencies, and the change in molecular polarizability and is not indicative of film thickness or amount while peak broadening arises from anharmonicities such as chemical (elemental) and physical (crystallinity) inhomogeneity.56 There were no magnesium carbonate related samples in the RRUFF database which possessed a peak at 1075 cm−1 but carbonate peaks are known to occur in the range of wavenumbers with magnesite, MgCO3, possessing a peak at 1095 cm−1. The peak observed at 982 cm−1 is indicative of an SO42− containing species which most closely resembles the standard spectrum of epsomite (MgSO4·7H2O).54 The results in Fig. 3 are interesting because they show that there is a thin Mg(OH)2 film present on TRIS samples despite there being no appearance of a surface film optically as shown in Fig. 4 for uncleaned TRIS sample surfaces which was also observed by Bland et al.57 The cleaned sample surfaces for HP Mg corroded in Cl− and SO42− are also shown in Fig. 4 and revealed a difference in dissolution morphology between Cl− and SO42−. It is clear from this figure that the HP Mg exposed to Cl− yielded a rough surface with sharp features while the SO42− exposed surfaces were smooth and lustrous.
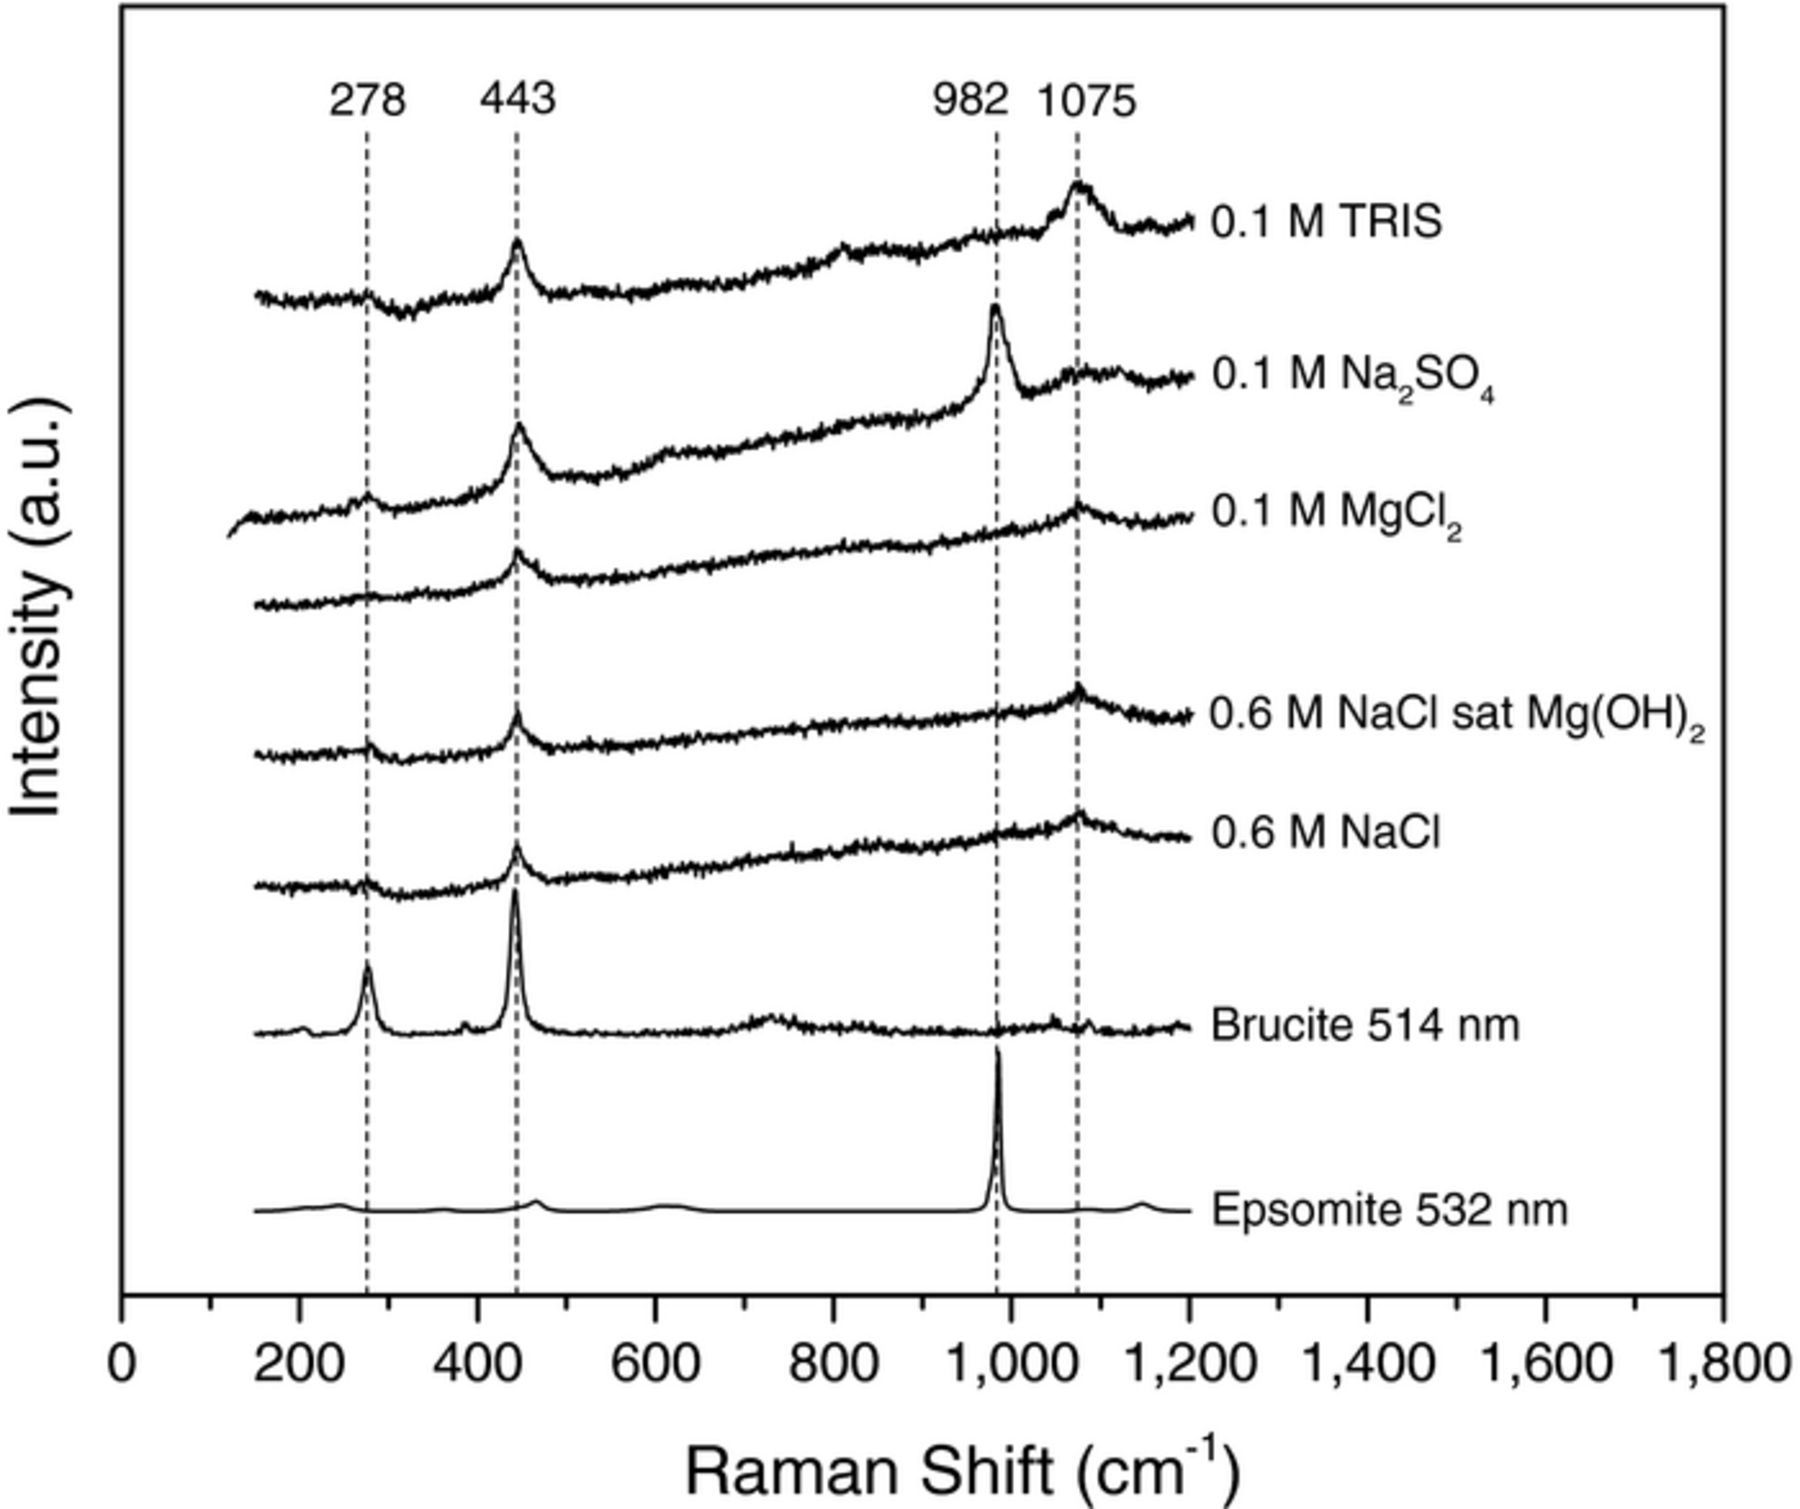
Figure 3. Raman spectra of sample surfaces after corrosion in each electrolyte. Standard spectra for Brucite (Mg(OH)2, RRUFF ID: R040077) and Epsomite (MgSO4·7H20, RRUFF ID: R150060) are from the RRUFF database.54 The peak at 1075 cm−1 is likely to be related to CO32− species. Instrument artifacts were subtracted from each spectrum.
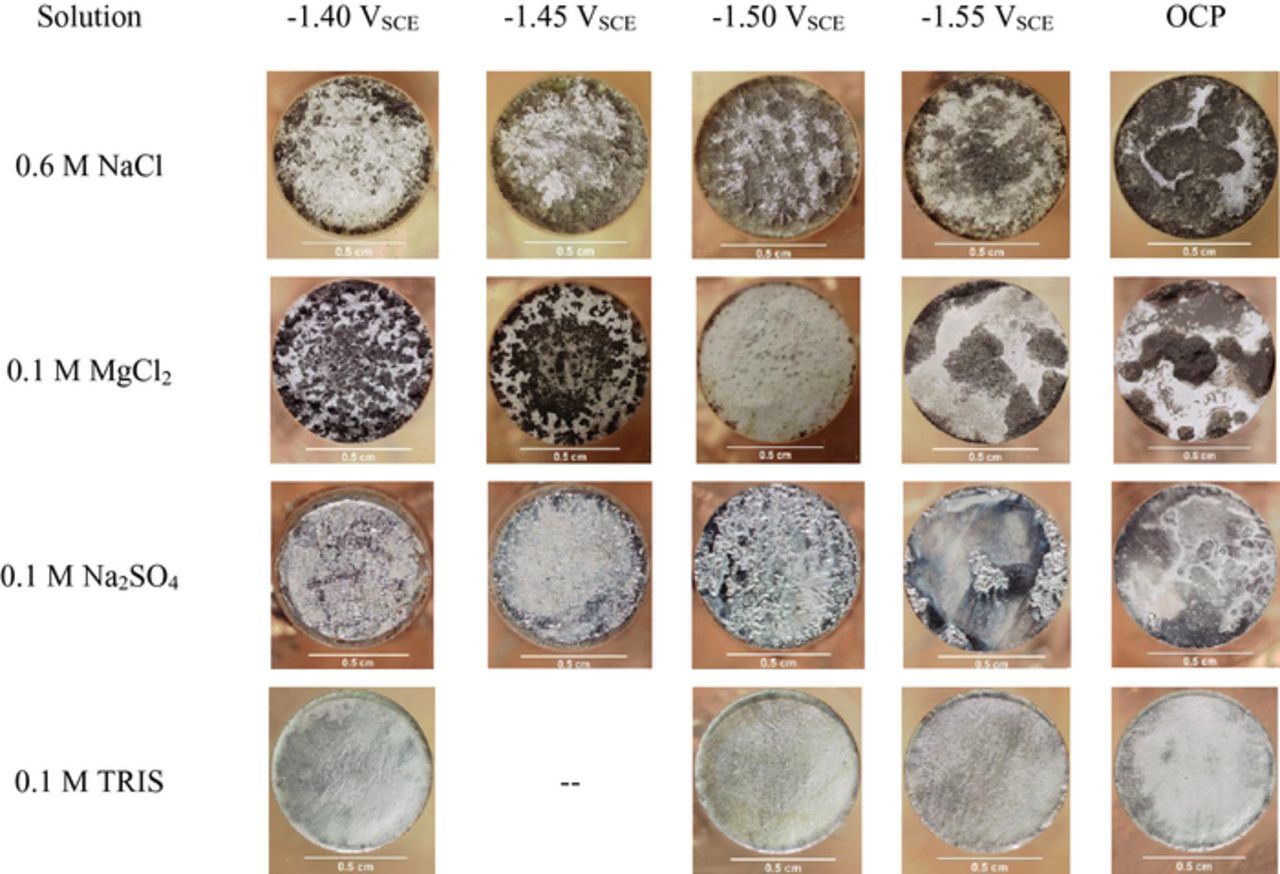
Figure 4. Optical micrographs of the surface morphology of corroded Mg samples after cleaning with CrO3. 0.1 M TRIS samples were not cleaned due to the absence of surface films.
Charge balance analysis
The charge balance for all solutions tested by potentiostatic polarization is shown in Fig. 5. Inspection of Fig. 5a shows that the conditions for charge balance described by Eq. 7 are met assuming Mg dissolves only as an Mg2+ ion along with cathodic hydrogen evolution persisting on the corroded Mg anodes in 0.6 M NaCl. This is observed in every solution tested in this investigation within one standard deviationh. The values for mass loss, hydrogen evolved, and net anodic charge measured by the potentiostat are similar for both saturated and unsaturated 0.6 M NaCl which is in agreement with expectations from the net current density vs. time transients shown in Fig. 2. However, the NDE is stronger in 0.6 M NaCl saturated with Mg(OH)2 owing in large part due to an OCP hydrogen evolution rate about half that measured in unsaturated 0.6 M NaCl. Even lower corrosion rates were measured at OCP in 0.1 M MgCl2 and 0.1 M Na2SO4 with the values for mass loss and hydrogen evolution in 0.1 M Na2SO4 being 1.67 ± 0.34 C/cm2 and 1.58 ± 0.00 C/cm2 respectively (not visible in Fig. 5d). As in the case of NaCl, the volume of H2 captured for MgCl2 increased rapidly at small anodic overpotentials but increased linearly at larger overpotentials. In contrast, the amount of H2 captured increased linearly at every potential tested for Na2SO4. Moreover, the average charge due to mass loss at many potentials was less than that of the sum of the charge for the hydrogen evolved and applied anodic charge measured by the potentiostat. However, this average is within error and also validates the choice of z = 2.
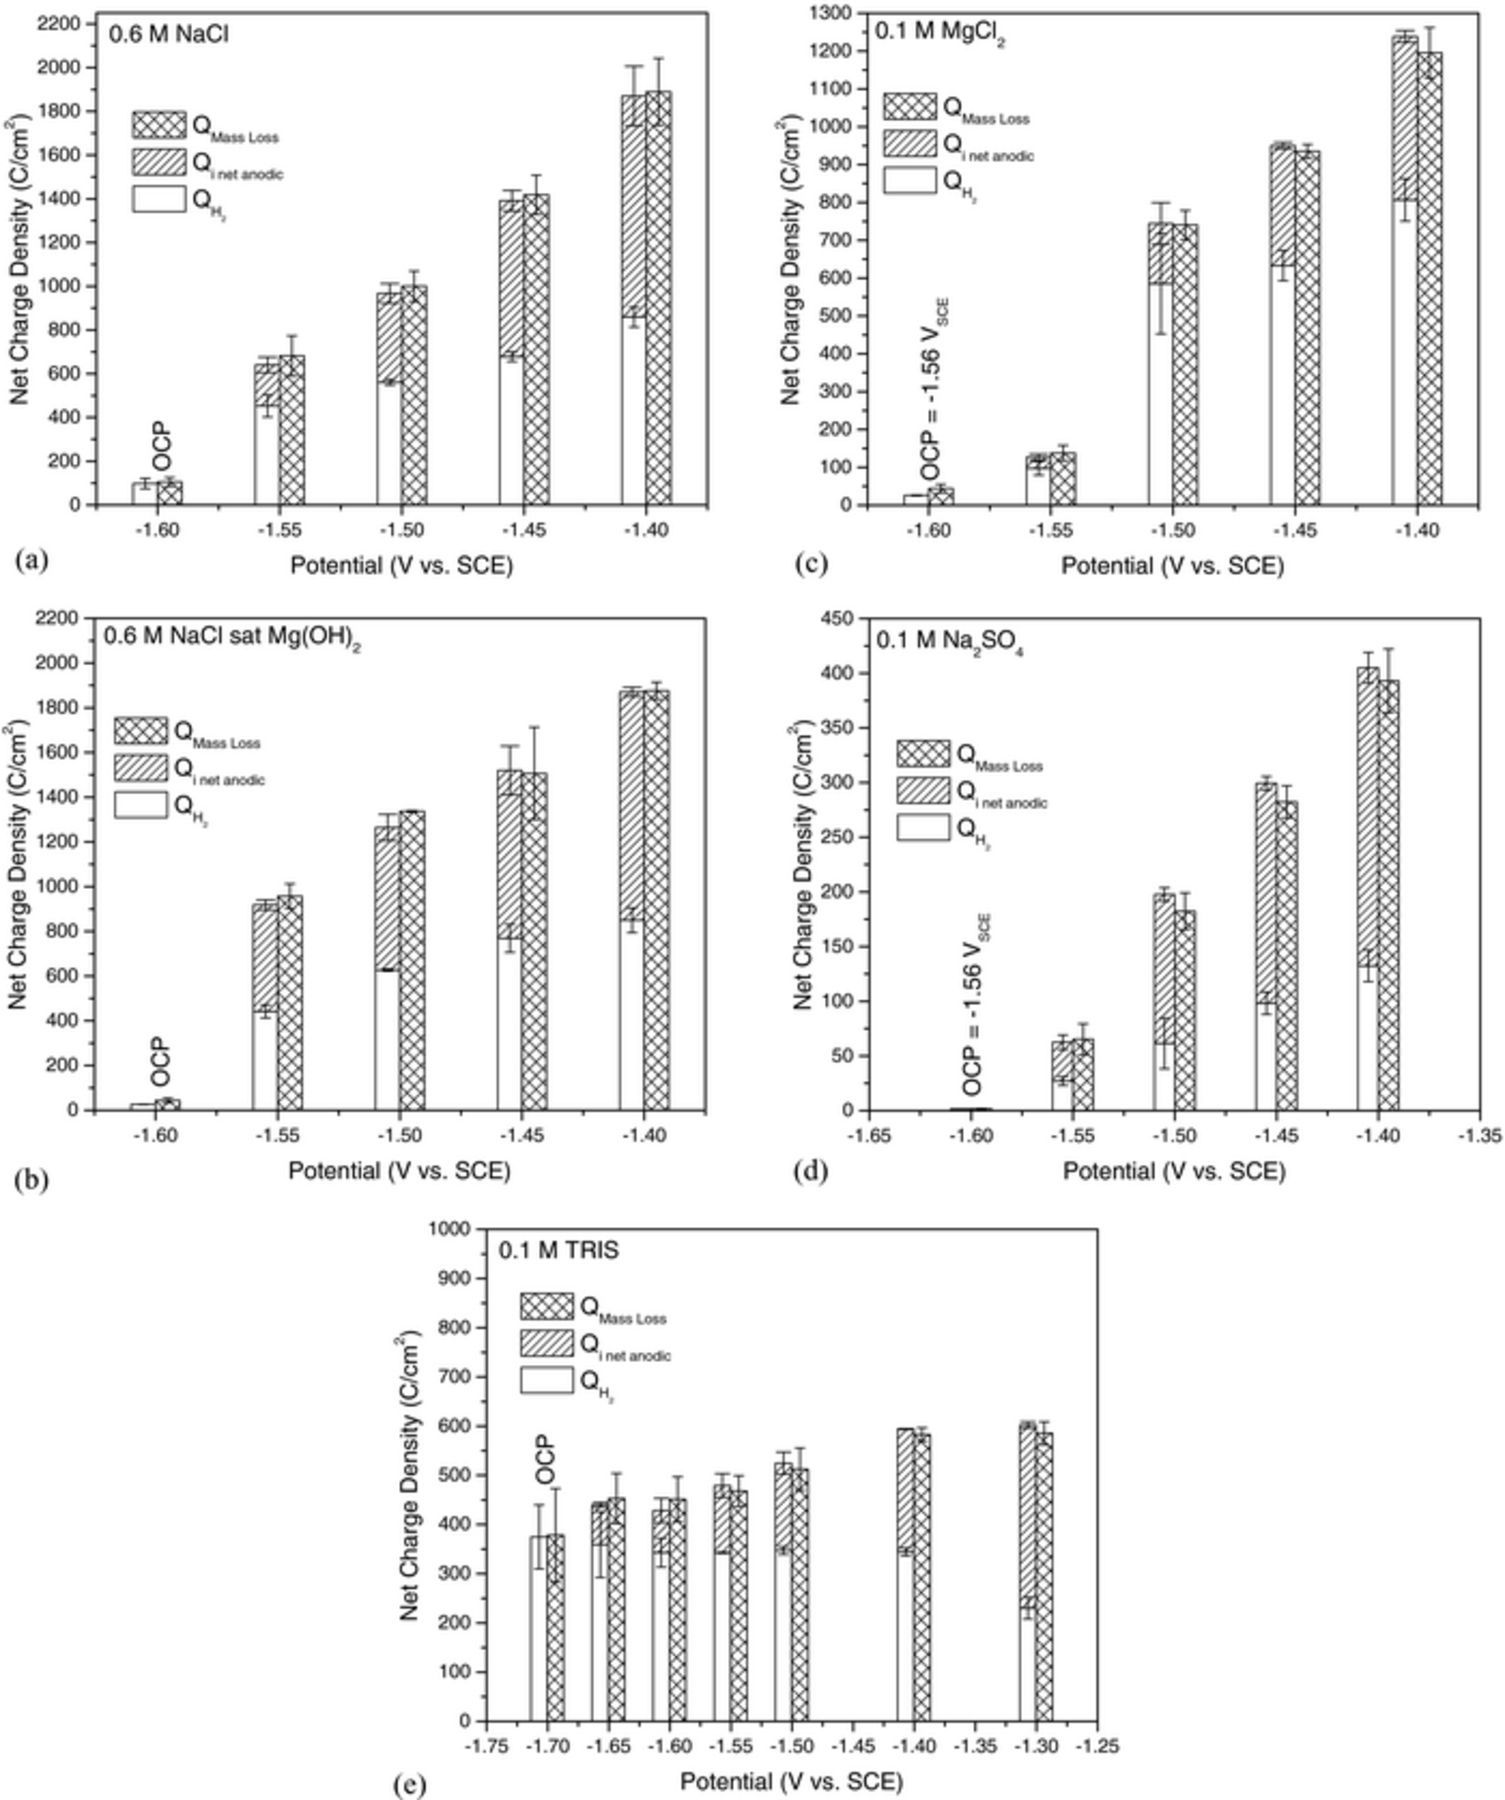
Figure 5. The charge calculated from mass loss compared to the charge calculated from captured hydrogen plus the charge measured by the potentiostat as a function of applied potential for HP Mg in (a) 0.6 M NaCl, (b) 0.6 M NaCl saturated with Mg(OH)2, (c) 0.1 M MgCl2, (d) 0.1 M Na2SO4, and (e) 0.1 M TRIS buffer solution. Error bars are one standard deviation from the mean.
The charge balance for TRIS is shown in Fig. 5e. In contrast to the other electrolytes tested in this study, the average volume of H2 captured was similar and did not change with increasing anodic overpotential for polarization between −1.65 VSCE and −1.4 VSCE and was less than that measured at OCP which suggests that there is no NDE in TRIS. This notion was confirmed at −1.3 VSCE which showed a large decrease in the H2 captured compared to −1.4 VSCE as well as at the OCP. It should be noted that the ohmic resistance of the TRIS buffered solution was about 110 Ω-cm2 producing a theoretical IR drop of 275 mV at 2.5 mA/cm2, which led to the relatively small changes in measured net anodic current density with increasing applied anodic potential by increments of 100mV (Fig. 2e) and thus small changes in mass loss and H2 captured.
The difference effect measured for each solution as a function of applied potential is shown in Fig. 6a where the difference effect, Δ, is defined as:
![Equation ([8])](https://content.cld.iop.org/journals/1945-7111/164/6/C300/revision1/d0008.gif)
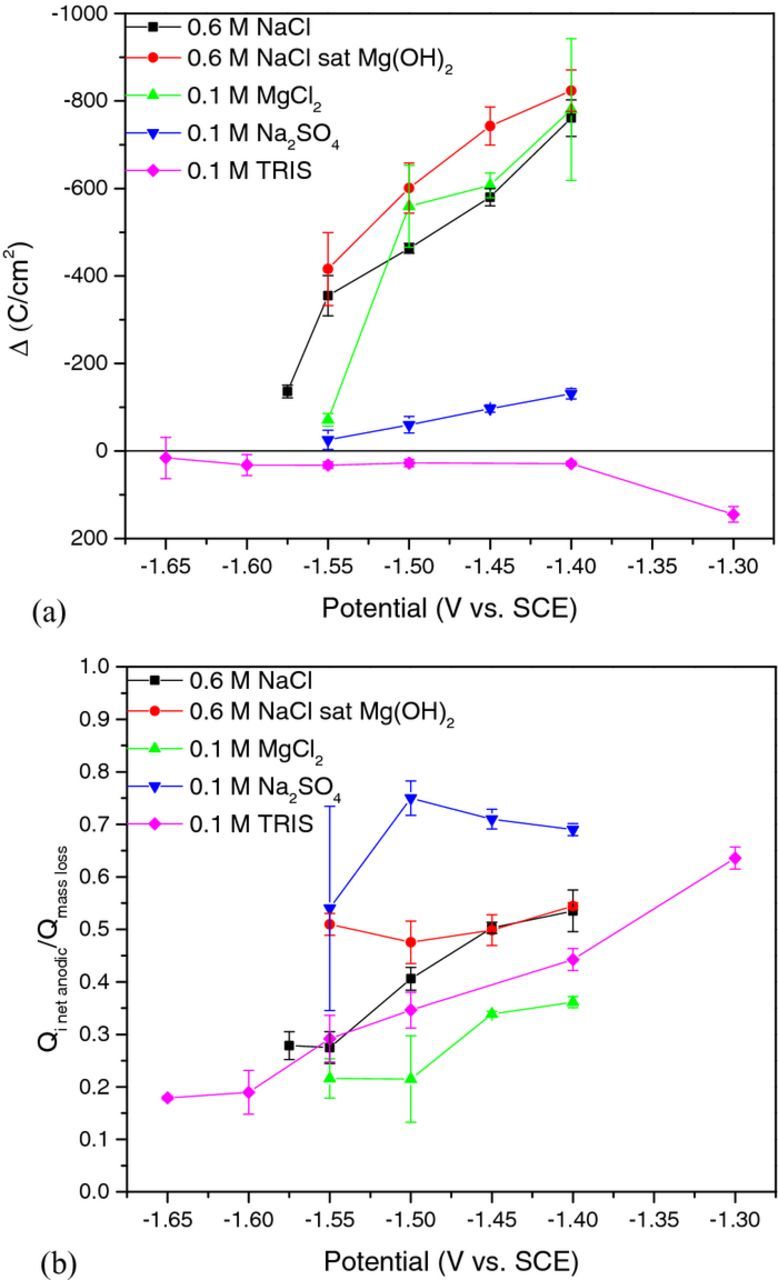
Figure 6. (a) The NDE as a function of applied potential and (b) the ratio of charge measured by the potentiostat to the charge consumed by mass loss. Error bars are one standard deviation from the mean.
The NDE is readily observed when plotting Δ vs. potential for Cl− containing solutions and displayed a linear increase with increasing potential. The NDE at each potential is greatest for 0.6 M NaCl saturated with Mg(OH)2 but the change of Δ with potential is similar for all Cl− containing solutions. In comparison, the change in Δ vs. applied potential was much less for Cl− free Na2SO4 solution but NDE was still evident. TRIS, however, did not display an NDE which is what would be expected from classical mixed potential theory applied to metal corrosion.52 Despite the presence of a positive difference effect for the TRIS solution, the faradaic efficiency for Mg dissolution (Qi net anodic/Qmass loss) is low at small anodic overpotentials as shown in Fig. 6b which suggests that the local cathodic reaction is still a significant factor to reducing the net applied anodic current compared to the true anodic current density. However, the faradaic efficiency increases with increasing anodic overpotential for TRIS and also for 0.6 NaCl and 0.1 M MgCl2. In contrast, 0.6 M NaCl saturated with Mg(OH)2 (Fig. 6b) displayed a relatively constant efficiency of about 0.5 within error while 0.1 M Na2SO4 indicated the greatest faradaic efficiency of all the electrolytes studied and revealed a decrease in faradaic efficiency at applied potentials greater than −1.50 VSCE.
Cathodic potentiodynamic polarization
Potentiodynamic polarization was performed after anodic potentiostatic polarization with the anodic surface film intact and in a film free condition after cleaning sample surfaces with CrO3 to examine the effects of enhanced cathodic kinetics, Fig. 7. E vs. log i polarization behavior for a freshly polished sample after 1 min immersion at OCP is displayed for reference to show the cathodic kinetics of an Mg surface that has no actively corroding filaments that might exhibit anodically enhanced cathodic kinetics. In addition, the calculated current density associated with the H2 captured at each potential during anodic polarization is shown for each solution assuming that the HER rate is constant with time. Figs. 7a–7c reveal that the cathodic kinetics are faster on samples immersed in Cl− with the surface film intact compared to those with no films which is in contrast to our previous findings with a 1 mV/s scan rate.31 Moreover, the cathodic kinetics are greater than that of freshly polished samples which is consistent with previous reports in chloride containing environments.38 However, there appears to be no clear trend of increasing cathodic kinetics with increasing prior anodic polarization potential. This is also observed in 0.1 M Na2SO4 (Fig. 7d) but the cathodic kinetics for both the film and film free conditions were slower than that of a freshly polished sample. The film free condition tended to show faster cathodic kinetics than the filmed condition at large cathodic overpotentials but were similar at smaller overpotentials which is in contrast to Cl− environments. TRIS (Fig. 7e) also did not show any variation in cathodic kinetics with increasing prior polarization between −1.65 VSCE and −1.4 VSCE. However, the rate of HER decreased on samples corroded at −1.3 VSCE (film free runs are not shown on this plot because there was no appearance of a surface film from visual inspection). The absence of any strong variation of cathodic kinetics for applied potentials between −1.65 VSCE and −1.4 VSCE is consistent with the similar volume of hydrogen captured as shown in Fig. 5e. Moreover, the decrease in cathodic kinetics at −1.3 VSCE compared to the other applied anodic potentials is also consistent with the decreased volume of hydrogen measured at this potential.
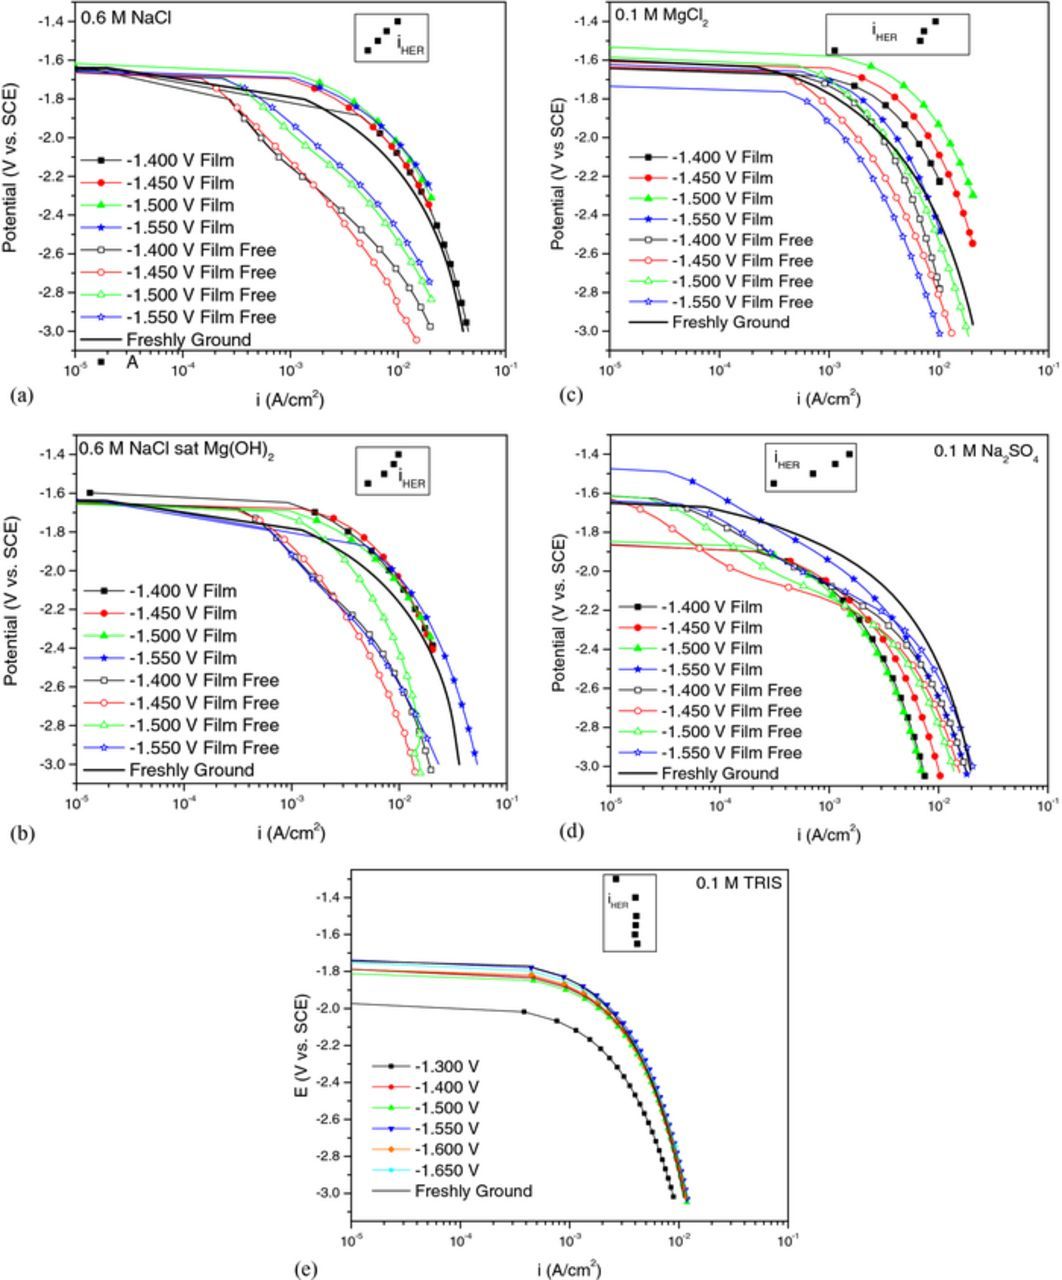
Figure 7. Cathodic potentiodynamic polarization scans with the corrosion films intact compared to film free condition after removing corrosion products with CrO3 for (a) 0.6 M NaCl, (b) 0.6 M NaCl saturated with Mg(OH)2, (c) 0.1 M MgCl2, (d) 0.1 M Na2SO4, and (e) 0.1 M TRIS. Scans were performed after 1 min at OCP either after completion of potentiostatic polarization or re-immersion into solution after cleaning. The potential scan rate was 2500 mV/s.
Inductively coupled plasma – optical emission spectroscopy
The results of ICP-OES (not shown for brevity) did not reveal the presence of Fe or other impurities in solution above the detection limit for all Cl− containing environments and for Na2SO4 which is consistent with our prior investigation.31 However, Fe was detected in solution for samples polarized in TRIS consistent with the bulk concentration of Fe in the HP Mg used in this investigation.
Discussion
Role of electrolyte and Mg(OH)2 film formation
The various electrolytes used in this study have provided a number of different conditions to study the phenomenon of the negative difference effect of Mg. The effect of each electrolyte on the NDE is presented and summarized in Table III. It is apparent from the results that the type and concentration of the anion produces a large difference on not only the corrosion and dissolution rate of Mg anodes but also in the extent of the NDE. The results presented herein suggest that the NDE is strongly dependent on both presence of absence of Cl− as well as pH changes in response to Mg2+ dissolution and the ability of Mg to produce stable films. In this study, the NDE was observed for all solutions that enabled the formation of thick Mg(OH)2 surface films (Fig. 6a). Of these solutions, 0.6 M NaCl saturated with Mg(OH)2 produced the strongest NDE which is consistent with observations of greater NDE at alkaline initial pH values.41 An initial pH in the Mg(OH)2 stable region combined with a solution that is saturated with Mg(OH)2 will greatly promote the formation of Mg(OH)2 films and thus this result is not surprising if the NDE is described by the stable film forming reaction mechanism proposed by Lebouil et al.43 However, a recent study by Yang et al. report that no NDE was observed for anodic polarization of Mg in 1 M NaOH which promoted the formation of a white film on the surface and a passive current density during anodic potentiodynamic scans.22 However, NDE was observed in 1 M NaOH + 3.5 wt% NaCl and no passive region formed. Their suggestion was that the NDE is related to a Cl−-induced film rupture mechanism where a stable Mg(OH)2 film is present as in the case of NaOH but the addition of NaCl enabled the breakdown of stable passive films. This local breakdown enabled fresh Mg surface to be exposed to the electrolyte which resulted in an amplified anodic current which is accompanied by a proportionally large increase in cathodic current in order to maintain charge balance. The result of film rupture is rapid HER behind the advancing dissolution front in the form of hydrogen streams which are well known in literature with a number of Mg alloys and processing conditions.29,58,59 But this fresh Mg would also be repaired by the reactions described by Equations 2–3 which facilitates HER.
Table III. Common factors describing the negative difference effect.
| Species | Anion activity coefficient >1 at high conc. | Insoluble Mg2+ precipitate as pH trends upward | Blackened surface associated with some altered surface layer | NDE |
|---|---|---|---|---|
| NaCl | ∼1 | Mg(OH)2 | yes | yes |
| Na2SO4 | <1 | Mg(OH)2 | Mostly white | slight |
| MgCl2 | >1 | Mg(OH)2 | yes | yes |
| TRIS | ? | no | no | No |
| Phosphate43 | ? | no | no | No |
The effect of film stability on the NDE is apparent in this study with comparisons between Cl− environments and Na2SO4. Examination of the surface morphology after removing the anodically formed surface films revealed a contrast in attack as shown in Fig. 4. Both NaCl and MgCl2 environments produced rough surfaces with many sharp features and pit like voids while Na2SO4 surfaces were smooth and lustrous. This suggests that Cl− was able to penetrate Mg(OH)2 films perhaps resulting in stress from electrostatic repulsion leading to local breakdown while more uniform dissolution with minimal localized breakdown or film rupture occurred in Na2SO4 which contributed to decreased dissolution rates and NDE. Moreover, this suggests that films formed in the presence of Na2SO4 are more stable than those in the presence of Cl− which could be related to 0.1 M Na2SO4 having an SO42− activity coefficient < 1.60 A low anion activity coefficient would lead to a less reactive environment, which decreases the likelihood of dissolution film breakdown during anodic polarization. In addition, it was more difficult to mechanically remove the Na2SO4 films when removing surface films for ICP-OES analysis compared to Cl− solutions films. Films formed in Cl− solutions readily spalled off whilst Na2SO4 films were adherent. In the case of TRIS, no visible films formed on the surface during anodic polarization and thus no film rupture would occur. Raman spectroscopy did reveal that Mg(OH)2 was present on the surface of samples tested in TRIS, but this film is likely to be tens of nanometers thick and may have formed in humid lab air.
Role of impurities and anodic sites
A general description of the factors that may lead to anodic hydrogen evolution from an anodically polarized Mg surface can be presented by the form of the simple expression in Eq. 9, that includes the minimum number of terms as explored in recent works, whilst acknowledging there may other hitherto unknown phenomena necessitating other terms.
![Equation ([9])](https://content.cld.iop.org/journals/1945-7111/164/6/C300/revision1/d0009.gif)
In this equation, HEanode represents a contribution from an increase in io, HER as described in Ref. 21, HEimpurities is the contribution to enhanced rates of reduction from impurity metal enrichment, and HEFilm is the contribution to enhanced rates of reduction from filmed areas. These three phenomena have been purported to enhance the rate of the cathodic reduction reaction, and hence, the NDE. It is worth noting that Tafel extrapolation from net cathodic data is inappropriate as HEanode would not be present in net cathodic data and HEImpurities may be reduced as well. Furthermore, such extrapolation is not relevant if the Tafel or Heyrovsky mechanism is dominant during net cathodic polarization and H2 evolution as described by the film forming mechanism in Eq. 2 dominates during net anodic polarization as they are distinctly different reactions. It is regarded that enrichment of impurities might be relevant from three standpoints: (1) Mg impurities may result from transition metal replating, (2) impurities may occur in the form of particles trapped in oxides or hydroxides, (3) solute in solid solution may accumulate at the moving metal/solution interface. The relative proportion of the terms in Eq. 9 is important in terms of electrochemical engineering of Mg, and a focal point of the work herein.
The physical reasoning for the large (and increasing) io,HER in the anodic region has never been definitively determined. Furthermore, Frankel et al.21 state that the contributions of HEimpurities + HEFilm have a small influence on the NDE based on extrapolation of cathodic polarization scans conducted long after anodic solutions may have dissipated from the anodic region. However, such an assertion is not entirely consistent with the growing number of works that have sought to quantify contributions of HEimpurities + HEFilm. Moreover, in such studies, slow scan rates were used to carry out the extrapolation of cathodic polarization which may lead to underestimation of the hydrogen evolution rate as the surface chemistry may have changed by the time the cathodic current density is assessed, due to rapid hydrogen evolution. Fast cathodic potentiodynamic polarization scans were used in this study to minimize changes in local solution chemistry after anodic polarization and to expand the range of activation controlled kinetics for Tafel extrapolation far away from OCP. However, applying Tafel extrapolation to fast cathodic scans (βc = 315 mV/dec, determined for fast scans of Mg microelectrodes and in agreement with Ref. 8) still underestimates the anodic hydrogen evolution rate in each solution by several orders of magnitude at the anodic potentials explored here, and furthermore would still predict a decrease in cathodic kinetics with increasing anodic overpotentials as would extrapolations of the proposed Heyrovsky path.61 Tafel extrapolation of cathodic polarization curves performed for each solution (not shown) using the framework presented by Fajardo et al.27 may be performed on the measured cathodic polarization curves to illustrate underestimation of the measured anodic HER rate. For example, the HER rate measured at −1.4 VSCE in 0.6 M NaCl is about 1 × 10⁻² A/cm2 (Fig. 7a) and extrapolation of its respective polarization curve to −1.4 VSCE yielded an HER rate of on the order of 10−4 A/cm2. Such an extrapolation may indicate the contribution of HEImpurities + HEFilm to the anodic H2 evolution rate but, again, would not capture possible contributions from Eq. 2. It should be noted that Tafel extrapolations were performed within 100 mV of the OCP despite an expanded region of activation controlled kinetics due to the fast scan rate used, which may lead to large errors in estimation of Tafel kinetics9 which is a further condemnation of performing Tafel extrapolation to determine anodic H2 evolution rates on Mg and Mg alloys. Nonetheless, Tafel extrapolation of cathodic polarization curves could only account for the NDE if the cathodic kinetics continued to increase with increasing anodic overpotentials but this was not possible given the cathodic polarization findings in this investigation. As such, a mechanism describing the large io region HEanode is still required to fully describe the NDE. This has been attempted recently by Yang et al.22 who posited that cathodic activation resulting from surface films and cathodic particles contribute to the large anodic io region instead of being regarded as separate from the large anodic io region. As such, the variation of impurity enrichment on the HP anode surfaces as a function of electrolyte remains an unresolved issue which may provide further clarity to the trends in NDE presented in this study. Surface analysis of dissolved HP Mg samples in each electrolyte will be evaluated and reported in a future study as a function of enrichment efficiency in an attempt to delineate the contributions of impurities on NDE. Additionally, contributions to the NDE from surface films have been shown to be an important factor based on the work presented herein.
These results and the framework presented herein also explain what is observed in TRIS. Here, enrichment of impurities by replating is eliminated due to the ability of TRIS to chelate transition metal ions. The buffering capacity and ability of TRIS to complex Mg2+ also eliminates the possibility of impurity accumulation in the oxide/hydroxide. The lack of a film has also eliminated possibilities of enhanced cathodic kinetics resulting from the hydroxide film. However, it is still possible that impurity particles are accumulating at the solution metal interface. This possible enrichment and the fact that there are always impurities present on the Mg surface could still stimulate remote anodic currents leading to H2 evolution as described by Yang et al.22 Such an effect could account for the residual high rate of HER despite a positive difference effect and would also explain the lack in efficiency (Qi net anodic/Qmass loss) but it is unclear how much impurity enrichment occurs in TRIS and in the other solutions tested here. Future work will characterize HP Mg samples corroded in each solution studied here to determine the possible enrichment of noble impurities utilizing proton induced X-ray emission (PIXE), which has the ability to quantify of the near surface chemistry and also has the capability of elemental mapping which can provide insight on how impurities are enriching on the surface.
Conclusions
- (1)A systematic series of experiments herein reveal that Mg dissolves as Mg2+ with negative difference effect (NDE) manifest over a broad range of applied anodic potentials in 0.6 M NaCl, 0.1 M MgCl2, and 0.1 M Na2SO4. However, NDE was not manifest for Mg dissolving in 0.1 M TRIS, pH = 7.25, buffered solution.
- (2)Surface film stability has been shown to play a major role in contributing to the manifestation and extent of NDE. Thick, but porous Mg(OH)2 films formed in Cl− containing solutions exhibited a large NDE while more stable Mg(OH)2 films formed in 0.1 M Na2SO4 exhibited a small NDE with respect to increasing anodic potential.
- (3)Fast cathodic potentiodynamic scans used to estimate anodic hydrogen evolution rates by Tafel extrapolation still underestimated the true rate of hydrogen evolved (by independent H2 capture) in the anodic regime. However, it has been rationalized that a change in the dominant HER mechanism occurs upon anodic polarization that calls into question the ability to estimate anodic hydrogen production rates using net cathodic data occurring by a different mechanism. This approach is not only unable but an ineffective approach to explain NDE effects.
- (4)Moreover, a systematic increase in cathodic HER kinetics due to envisioned enrichment of impurity elements and formation of Mg(OH)2 films could not predict NDE.
Acknowledgments
We gratefully acknowledge the US Air Force Academy under agreement number FA7000-12-2-0017 as part of Corrosion University Pilot Program under the direction of Daniel Dunmire and by the National Science Foundation under NSF DMR#1309999 as well as the Army Research Office under agreement number W911NF-14-2-0005. The U. S. Government is authorized to reproduce and distribute reprints for government purposes notwithstanding any copyright notation thereon. The views and conclusions contained are those of the authors and should not be interpreted as necessarily representing the official policies or endorsement of the US Air Force Academy or the US Government. We would also like to acknowledge the Australian Research Council. NB is supported by Woodside Energy.
Footnotes
- d
This is commonplace for the SVET method as the time taken to map all cathodic sites often exceeds the time period over which anodic events that are short lived occur. Therefore it is an "expected outcome."
- e
The most recent anodic sites evolve more H2 but these sites have the greatest net anodic current observed.
- f
- g
The non-faradaic current associated with this scan rate is on the order of 1x10⁻⁴ A/cm2 which is several orders of magnitude smaller than the net cathodic currents measured in this study.
- h
Error bars are representative of one standard deviation from the mean and are present on each bar except where standard deviations are too small to be observed.