Abstract
In this paper, we present an aging study of commercial 18650-type C/LiNi0.33Mn0.33Co0.33O2 lithium-ion cells. The test procedure comprises varying charging currents, discharging currents and resting times between cycles. The cells show a nonlinear capacity fade after a few hundred equivalent full cycles, if cycled with a standard charging and discharging rate of almost 1C, and different resting times. By increasing the discharging current or decreasing the charging current, the lifetime improves and results in a linear capacity fade. The neutron diffraction experiment reveals a loss of lithium inventory as the dominant aging mechanism for both linearly- and nonlinearly-aged cells. Other aging mechanisms such as the structural degradation of anode or cathode active materials, or the deactivation of active materials, cannot be confirmed. With ongoing aging, we observe an increasing capacity loss in the edge area of the electrodes. Whereas the growth of the solid electrolyte interphase defines the early stage, linear aging, marginal lithium deposition is supposed to cause the later stage, nonlinear aging. Capacity recovery caused by lithium stripping and chemical intercalation is shown to be dependent on the cell's state of health.
Export citation and abstract BibTeX RIS

This is an open access article distributed under the terms of the Creative Commons Attribution 4.0 License (CC BY, http://creativecommons.org/licenses/by/4.0/), which permits unrestricted reuse of the work in any medium, provided the original work is properly cited.
Nowadays, lithium-ion battery technology is widely used both in mobile and stationary applications, such as consumer electronics, electric vehicles, and grid operations. The economic, sustainable and safe operation of these battery-energy-storage systems depends significantly on their aging behavior. In particular, the definition of a battery's end of life, and also a conceivable reuse of lithium-ion batteries in second life applications, are extensively discussed topics.1–3
Aging of lithium-ion cells generally means a decrease in its energy density and power capability, caused by the loss of capacity and the increase of impedance. In particular, aging can be separated into an early stage and a later stage. The former indicates decelerated or linear aging, whereas the latter describes accelerated or nonlinear aging. Furthermore, the aging mechanisms can be assigned to a loss of lithium inventory (LLI), a loss of active material and an impedance increase.4–6 The main aging mechanisms are: electrolyte decomposition leading to solid electrolyte interphase (SEI) and cathode electrolyte interphase growth; contact loss of active material particles due to volume changes during cycling; a decrease in accessible surface area and porosity due to SEI growth; lithium deposition; transition-metal dissolution from the cathode; solvent co-intercalation; gas evolution with subsequent cracking of particles; binder decomposition; and current collector corrosion.7–10
SEI growth, the main aging mechanism under common operational conditions, results in a linear capacity fade on charge throughput, or a square-root-shaped capacity loss over time.11 However, a nonlinear or accelerated capacity fade is caused by the deposition of metallic lithium on the graphite anode,2 if the local anode potential becomes negative vs. Li/Li+.12,13 Low temperatures,10,14–16 high charging currents2,10,17 as well as a high state of charge (SoC)18 favor lithium deposition. Lithium metal can react again with the electrolyte, forming additional SEI. Waldmann et al.13 classify the terminology of lithium deposition and distinguish between homogeneous lithium plating and inhomogeneous, local or marginal, lithium deposition. Even at moderate temperatures and charging rates, lithium deposition may occur due to inhomogeneous current and potential distributions, as well as temperature gradients inside the cell.2,10 Bach et al.19 show local lithium deposition, caused by an unevenly compressed cell casing, at an ambient temperature of 20°C. Lithium plating or lithium deposition are partly reversible processes as long as the plated/deposited lithium exhibits an electrical contact to the active material of the negative electrode. In that case, there are basically two different reversible processes: lithium stripping during a subsequent discharge, or chemical intercalation during relaxation.13
There are various methods to characterize aging mechanisms and their underlying chemical, physical and mechanical processes. In general, a distinction is made between in-situ and ex-situ experiments. In situ refers to measurements that are performed on materials in their original position, i.e. without disassembling the battery.20 Ex-situ measurements involve cell opening and sample preparation. The fact that further operation of the cell is not possible following ex-situ measurements, as well as the high risk of altering or contaminating the samples, are the main drawbacks of this method.20–22 The most commonly used in-situ techniques are X-ray techniques, scanning probe microscopy, electron microscopy, optical techniques, magnetic (resonance) techniques and neutron techniques.20 However, the metal casing of lithium-ion cells is generally impenetrable for electromagnetic waves, magnetic fields and electrons. Therefore, special cells including transparent windows are required for most spectroscopy and microscopy techniques.21,23
Neutron diffraction (ND) is a powerful analytical in-situ technique to study commercial lithium-ion cells. Rietveld analysis of neutron diffractograms can be used to determine the atomic structure, lattice parameters and particle size of crystalline anode (e.g. graphite) and cathode active materials (e.g. spinels, layered metal oxides or phospho-olivines).21 Compared to X-ray diffraction, neutron diffraction shows a much higher sensitivity for light elements like lithium (especially in the vicinity of heavy elements) and is much more suitable for large cell formats due to the higher penetration depth of neutrons.21 However, as a consequence of the high effort of neutron diffraction measurements, only a few studies have been published so far and they analyze degradation mechanisms in particular. Dolotko et al.24 investigated cell fatigue of linearly-aged commercial C/LiCoO2 cells at 25°C and 50°C, and observed a loss of mobile lithium due to SEI formation. This result is confirmed by Shiotani et al.25 and Paul et al.26 for 18650-type C/LiNi0.33Mn0.33Co0.33O2 cells. The aging of cells composed of different anode active materials, mesocarbon microbeads and needle coke, and a lithium-iron-phosphate (LFP) based cathode has been investigated by Paul et al.,21 and showed that LLI was the dominant aging mechanism. Inhomogeneous lithium distribution affected by cell fatigue is shown by Cai et al.27 and Mühlbauer et al.28 Furthermore, Zinth et al.29 and von Lüders et al.15 investigated chemical intercalation through changes in LiC6 and LiC12 peak intensities during a rest time immediately after severe lithium deposition at low temperatures.
Nevertheless, there is still little knowledge of how SEI growth, lithium deposition, lithium stripping and chemical intercalation interact during aging. In this context, we present an aging study of commercial 18650-type C/LiNi0.33Mn0.33Co0.33O2 lithium-ion cells with a focus on linear and nonlinear aging behavior, depending on the test procedure. We use electrochemical analysis and in-situ neutron diffraction to investigate the aging mechanisms. To the best of our knowledge, we firstly obtain structural information of both linearly- and nonlinearly-aged lithium-ion cells by using neutron diffraction.
Experimental
This section presents the investigated lithium-ion cells as well as the test conditions, the test procedure of the aging experiment and the design of the neutron diffraction experiment.
Cell information and test conditions
We tested commercial 18650-type lithium-ion cells with a nominal capacity of 2.05 Ah and an energy density of 175 Wh kg− 1. The cells are composed of graphite as the anode and LiNi0.33Mn0.33Co0.33O2 as the cathode. We used a battery test system CTS (BaSyTec) to cycle the cells, and an environmental chamber MK 53 (Binder) to keep the ambient temperature at 25°C.
Aging experiment
The general test procedure is as follows: the cells were discharged using a constant current step (CCdch) to a cutoff voltage of 2.75 V, followed by a constant current charging step (CCch) to a cutoff voltage of 4.2 V and a constant voltage charging step (CVch) with a cutoff current of 0.1 A. After each discharge and charge, resting times (tr) were applied. By varying the charging current, the discharging current and the resting time, four different test procedures were performed, as shown in Table I. We tested at least three cells for every test procedure. At the beginning of the aging experiment and after every 100 cycles, checkup tests were performed to determine the cells' capacity and internal resistance. The capacity is determined using a CCCV protocol with a current of 250 mA ( ≈ C/10) and a cutoff current of 100 mA ( ≈ C/20). The internal resistance Rdc, 10s in the time domain is derived from the voltage response, corresponding to a current step of 3 A with a pulse duration of 10 s. Additionally, differential voltage analysis (DVA) was obtained. For the neutron diffraction experiment, two cells from every test procedure were selected and respectively charged or discharged to 4.2 V (100% SoC) or 2.75 V (0% SoC) using a CCCV protocol with a current of 1A ( ≈ C/2) and a cutoff current of 20 mA ( ≈ C/100). We dis-/charged the cells five days before the neutron diffraction experiment started to guarantee relaxed states within the cells.
Table I. Test procedures of aging experiment with varying charging currents, discharging currents and resting times.
| Test procedure | ICC dch | tr | ICC ch | ICV ch | tr |
|---|---|---|---|---|---|
| # 1 | −2 A | 900 s | 2 A | 0.1 A | 900 s |
| # 2 | −2 A | 10 s | 2 A | 0.1 A | 10 s |
| # 3 | −4 A | 900 s | 2 A | 0.1 A | 900 s |
| # 4 | −2 A | 900 s | 1.4 A | 0.1 A | 900 s |
Neutron diffraction experiment
The neutron diffraction measurements were performed using a Debye–Scherrer geometry under ambient conditions at the high-resolution powder diffractometer SPODI, at the Heinz Maier-Leibnitz (FRM II) research reactor in Garching, Germany.30 Figure 1a shows the schematic of the instrument and the setup of the experiment. Neutrons with a wavelength of 0.1548 nm were incident on a rectangular cross section of 40 mm × 30 mm of the cell center, as shown in Figures 1b and 1c. The top and bottom of the cell (approx. 25 mm in total) were not illuminated by the neutron beam, to avoid noisy signals from the cell holder and safety protection circuitry. A neutron detector array consisting of 80 vertical position-sensitive detectors with a Soller collimator in front of each, see Figure 1a, recorded the neutrons scattered by the cell.30,31 The cells were continuously rotated during the entire measurement to obtain an average signal over cell volume. Five succeeding diffractograms were measured for each cell, with an acquisition time of 36 min each. Therefore, the total integration time for the obtained diffractograms was 3 h for each cell. We determined an instrumental resolution function with a Na2Ca3Al2F14 reference material, in order to calculate the full widths at half the maximum reflections from the cell. To describe the peak profile shape, a Thompson-Cox-Hastings pseudo-Voigt function was used.32 A linear interpolation between selected data points was used to fit the background. Multi-phase Rietveld refinements of structural models for the neutron diffraction data were carried out using the FullProf software package.33 Due to significant overlap of diffraction peaks from the steel housing and current collectors, and the strong preferred orientations of crystallites for these phases, structure-independent profile fits were used.
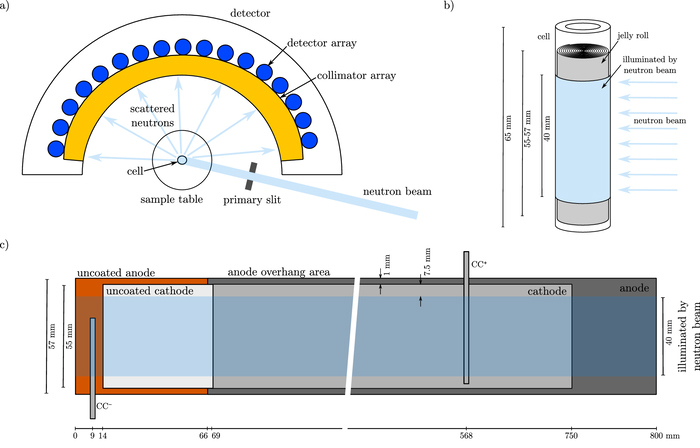
Figure 1. a) Schematic of high-resolution powder diffractometer SPODI and setup of neutron diffraction experiment, b) rectangular cross section of 40 mm height, illuminated by neutron beam, and c) schematic of electrode geometries of the investigated cell.
Post-mortem analysis
Scanning electron microscopy (SEM) was used to qualitatively investigate the surface morphology of the electrodes of cycled and uncycled cells. The cells were opened in a glove box (M. Braun Inertgas-Systeme GmbH, Germany) under an argon atmosphere, subsequent to the aging experiment. We punched out electrode samples at different positions along the electrode and obtained images using a benchtop SEM (JCM-6000, JEOL Ltd., Japan) with an acceleration voltage of 15 kV.
Results and Discussion
Electrochemical characterization
Figure 2 shows the mean values (solid lines) and standard deviations (light-colored) of the relative capacity and relative resistance over equivalent full cycles (EFC) for the various test procedures. The test procedures # 1 and # 2, which have the same charging and discharging currents and varying resting times, both show a nonlinear capacity fade, whereas # 3 and # 4, which have an increased discharging current or decreased charging current, give a linear capacity fade (see Figure 2a). The increase in the relative discharge resistance at 50% SoC is in accordance with the capacity loss and equally demonstrates either a nonlinear (test procedures # 1 and # 2) or linear (test procedures # 3 and # 4) behavior, as depicted in Figure 2b. As shown by Schuster et al.,34 capacity fade and impedance rise correlate dependent on the operational strategies. Assuming an end of life of 80% state of health (SoH), the achievable battery life is as follows: # 1 ≈ 400 EFC, # 2 ≈ 550 EFC, # 3 ≈ 800 EFC and # 4 > 850 EFC. Shortening the relaxation time between cycles positively influences the lifetime by roughly 40%. At the same time, a higher discharging current and unchanged relaxation almost doubles the cell's lifetime. The strongest effect is shown by a reduced charging current, with a lifetime exceeding 850 EFC. It should be noted that these results are valid for this cell type and within the scope of this aging experiment. The temperature increase for all cells under various test conditions is of less than 2°C from the beginning to the ending of cycling, measured at the cell's surface.
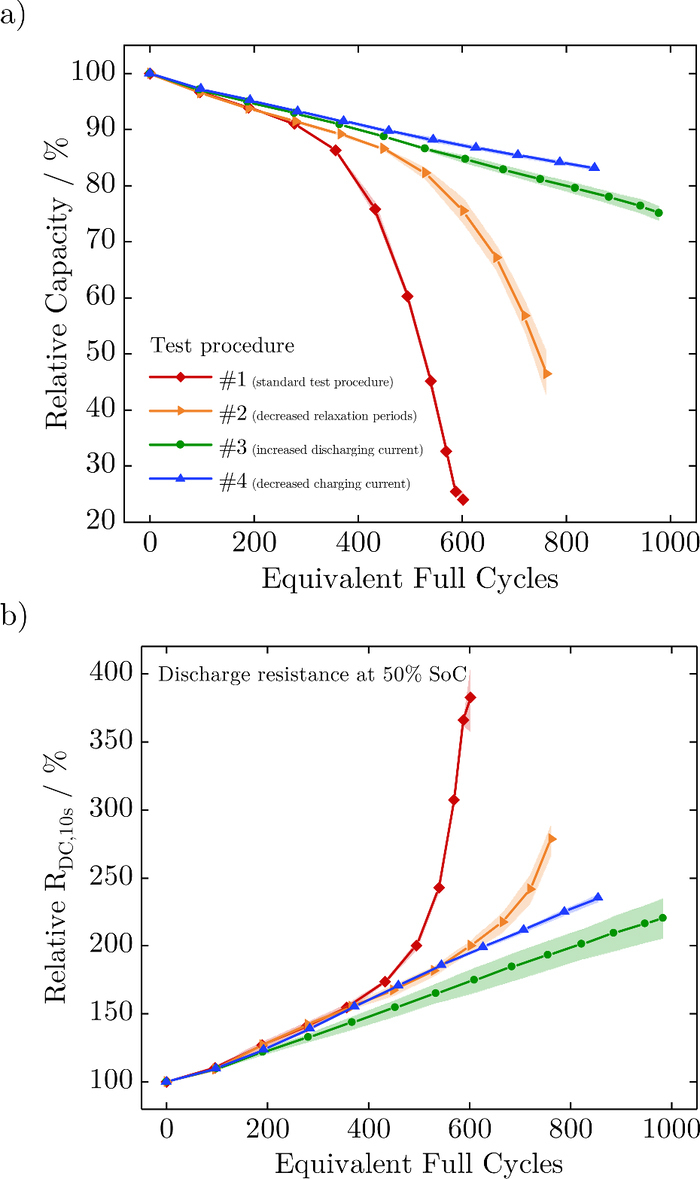
Figure 2. Mean values (solid lines) and standard deviations (light-colored) of the relative capacity (a) and relative resistance (b) over equivalent full cycles for the various test procedures.
Our original goal was to carry out the neutron diffraction experiment with both linearly- and nonlinearly-aged cells for every test procedure. Due to the fast capacity loss for cells cycled with test procedure # 1 and the absence of nonlinear aging for cells cycled with test procedure # 3 and # 4, we were only able to investigate differently aged cells for test procedure # 2. This results in 12 cells at different SoH, and in uncycled ones that were fully charged or discharged for the neutron diffraction experiment using a CCCV protocol with a current of 1A ( ≈ C/2) and a cutoff current of 20 mA ( ≈ C/100). The small currents were used to diminish polarization and to guarantee the same SoCs, i.e. the same cell voltages. Table II summarizes the cells and their respective SoH and SoC as investigated in the neutron diffraction experiment.
Table II. Information on the cells investigated in the neutron diffraction experiment.
| Test procedure | #1 | #2 | #3 | #4 | #2 | uncycled | ||||||
|---|---|---|---|---|---|---|---|---|---|---|---|---|
| Cell number | 1 | 2 | 3 | 4 | 5 | 6 | 7 | 8 | 9 | 10 | 11 | 12 |
| SoC for ND experiment/% | 100 | 0 | 100 | 0 | 100 | 0 | 100 | 0 | 100 | 0 | 100 | 0 |
| CheckUp data before cycling | ||||||||||||
| Initial capacity/Ah | 2.0575 | 2.0530 | 2.0576 | 2.0527 | 2.0604 | 2.0487 | 2.0676 | 2.0596 | 2.0556 | 2.0610 | 2.0673 | 2.0506 |
| CheckUp data after cycling and before neutron diffraction experiment | ||||||||||||
| Equivalent full cycles | 599 | 604 | 767 | 770 | 975 | 982 | 852 | 856 | 278 | 278 | 0 | 0 |
| Capacity/Ah | 0.4920 | 0.4532 | 1.0153 | 0.9832 | 1.5295 | 1.5596 | 1.7129 | 1.7157 | 1.8815 | 1.8856 | 2.0673 | 2.0506 |
| SoH/% | 23.9 | 22.1 | 49.3 | 47.9 | 74.2 | 76.1 | 82.8 | 83.3 | 91.5 | 91.5 | 100.0 | 100.0 |
Finally, we obtained differential voltage analysis to investigate the degradation mechanisms.4,35 Figure 3 shows the measured differential voltage of cells for the various test procedures. Furthermore, Figure 3a depicts distinctive material markers that are phase changes of the lithiated graphite. According to Winter et al.,36 the first one shows the transition from phase III+IV to phase II+IIL and the second from phase II+IIL to II+I. As these markers do not shift and QC remains constant, anode active material loss cannot be confirmed. Distinctive material markers that refer to the cathode cannot be assigned in the DVA curves. The absolute irreversible capacity loss Qcell at remaining material markers of the anode reveals a loss of lithium inventory as the dominant aging mechanism for both linearly- and nonlinearly-aged cells.
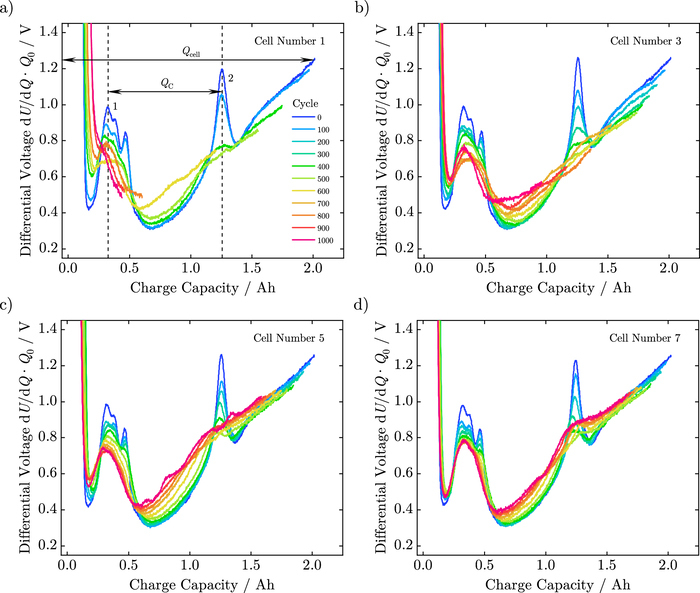
Figure 3. Measured differential voltage of cells from a) test procedure # 1, b) test procedure # 2, c) test procedure # 3, and d) test procedure # 4.
Neutron diffraction
Neutron diffractograms were taken for cells at various SoHs in their fully discharged state (0% SoC) as well as in their fully charged state (100% SoC). Rietveld refinements were carried out of all neutron diffractograms and structural information regarding all polycrystalline battery constituents obtained. Crystal structure models of LiC6 and LiC12 for the anode and LiyNi0.33Mn0.33Co0.33O2 for the cathode were used to analyze the diffraction patterns at 100% SoC. At 0% SoC, crystal structure models of graphite for the anode and LiyNi0.33Mn0.33Co0.33O2 for the cathode were used to analyze the diffraction patterns. The difference in lithium content between 100% SoC and 0% SoC corresponds to the amount of cyclable lithium participating in the charge/discharge process. The loss of cyclable lithium due to aging is estimated by comparing the amount of cyclable lithium in the uncycled and aged cells. Thus, cyclable lithium losses reported in this work are calculated relative to the uncycled cell.
In Figure 4a, LiC6 and LiC12 reflections of the lithiated anode material are clearly visible in the fully charged state of all cells. No LiCz reflections with z > 12, corresponding to phases with low lithium content such as LiC18 or LiC24 or C, are observed in any cell. A decrease in the intensity of the LiC6 (001) reflection peak and increase in the LiC12 (002) reflection peak with decreasing SoH (on aging) is observed. This is related to the decrease in lithium content within the anode. In Figure 4c, the C (002) reflection in the delithiated anode shows no noticeable shift in angular position on aging, which is an indication of the complete extraction of lithium from the anode at 0% SoC, regardless of aging. We presume that the observed intensity reductions of the crystalline carbon peak of the aged cells occur due to diffusion of lithium into the anode overhang area, as all cells were measured for the same amount of time. Since no additional lithiated graphite reflections in this angular region are detected at 0% SoC, and no graphite reflections are detected at 100% SoC an absence of neither lithiated nor delithiated electrochemically detached anode active material can be concluded for all cells.
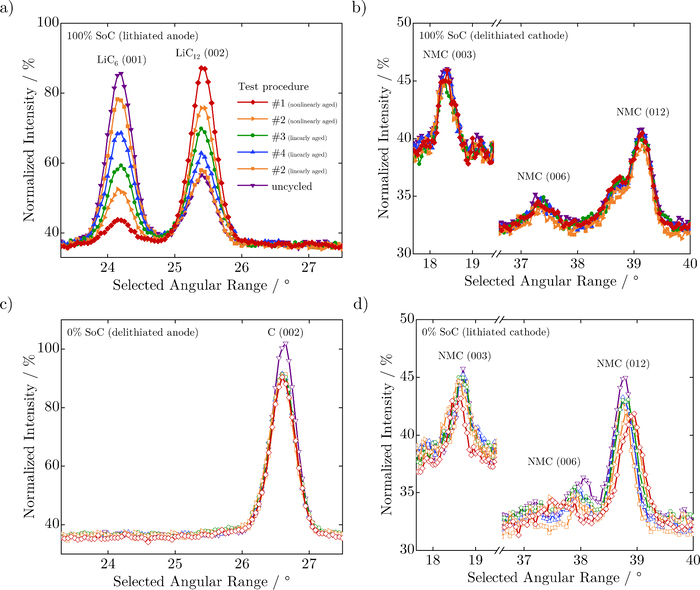
Figure 4. a) and c) present neutron diffraction data from a selected angular range, focusing on the prominent LiC6 (001), LiC12 (002) and C (002) reflections of the anode, where changes in peak intensities of LiC6 (001) and LiC12 (002) reflections indicate a reduction in lithium content in the anode on aging. b) and d) present selected angular range of neutron diffraction data, focusing on the NMC (003), NMC (006) and NMC (012) reflections of the cathode, which in spite of being weak in intensity, show angular shifts indicating a reduction in lithium content in the lithiated cathode on aging.
In Figure 4d, the NMC (003), NMC (006) and NMC (012) reflections of the cathode show angular shifts indicating that the lithium content in the lithiated cathode has decreased during aging. On the other hand, these reflections remain fairly similar on aging for the delithiated cathode, as can be seen in Figure 4b, showing that the amount of lithium being removed from the cathode at the upper voltage limit is similar for all cells.
Figure 5 shows full neutron diffractograms of uncycled (a) and b)) and nonlinearly-aged (test procedure # 1, c) and d)) cells in their fully charged and fully discharged state, along with their Rietveld refinements. A high background due to the incoherent scattering of neutrons due to the hydrogen present in the electrolyte and separator is observed for all cells, which tends to increase with angle. From the Rietveld refinement of all cells, electrochemically accessible lithium content in their electrodes and lattice parameters was extracted and compared.
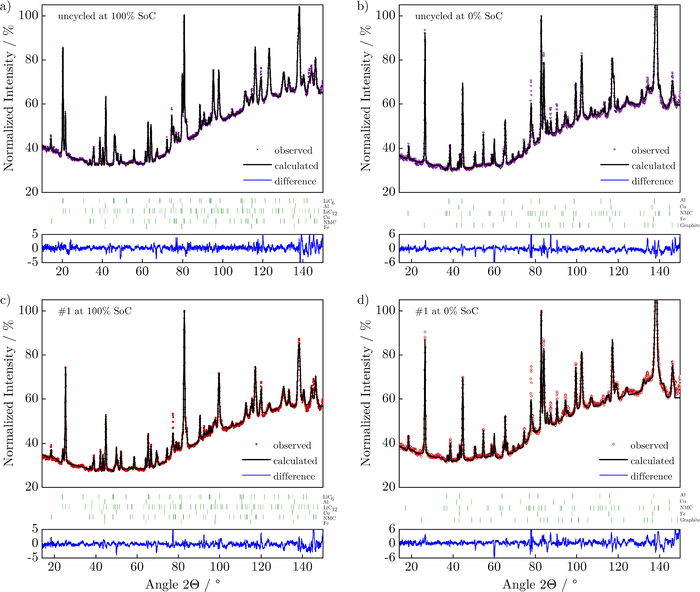
Figure 5. Neutron diffractograms with the full angular range of the a) uncycled cell at 100% SoC, b) uncycled cell at 0% SoC, c) nonlinearly-aged cell at 100% SoC, d) nonlinearly-aged cell at 0% SoC. The experimental data are shown by colored symbols whereas their Rietveld refinements are shown as black lines. The blue lines show differences between data and fit. The vertical bars (green) above the blue line indicate Bragg reflections corresponding to the crystalline phases in the cell (for 100% SoC from top to bottom: LiC6, Al, LiC12, Cu, NMC and Fe, and for 0% SoC from top to bottom: Al, Cu, NMC, Fe and graphite).
Differences in mean lithium content in anodes at 100% SoC and 0% SoC provide a reasonable estimation of cyclable lithium losses in the anode.26 Thus, phase fractions of LiC6 and LiC12 reflections were extracted from the Rietveld refinement of the complete neutron diffractograms of all cells at 100% SoC, and converted to molar fractions. Mean lithium concentrations were calculated as described by Senyshyn et al.37 and shown as anode stoichiometries in Figure 6a. No significant differences in lattice parameters for the anode were observed as a consequence of aging.
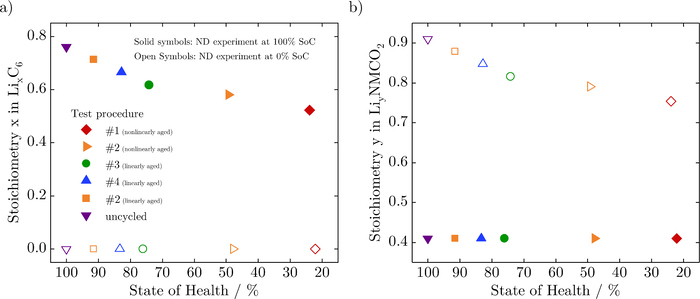
Figure 6. a) Anode stoichiometry x in LixC6 and b) cathode stoichiometry y in LiyNi0.33Mn0.33Co0.33O2 at different SoHs at 0% (open symbols) and 100% (solid symbols) SoC, respectively.
No noticeable differences in the lattice parameter of the cathode are seen at 100% SoC, and the Rietveld refinements show a constant value of z/c = 0.236 for the refined fractional coordinate of the oxygen atoms at the 6c site (0,0,z) for all cells. This parameter gives an estimation of distances between oxygen layers, and the value obtained here is similar to the value obtained in earlier studies for NMC based 18650 cells.24,26 Thus, the average charge at the oxygen ions is similar due to an identical lithium content in the cathodes.
However, the lattice parameter a, which has a constant value of 0.2816nm at 100% SoC, expands for all cells at 0% SoC. Its value at 0% SoC shows a systematic decrease with aging. On the other hand, the lattice parameter c contracts for all cells on discharge, due to the reduction in electrostatic repulsion between the oxygen layers following a decrease in the partial screening of charge by lithium ions. As a consequence of aging, all aged cells show a larger c lattice parameter and a smaller a lattice parameter at 0% SoC compared to their pristine condition, depending on their SoH. Such changes typically indicate a reduction in the amount of cyclable lithium content in the cathode and have also been reported previously.26 From the different c/a values, lithium contents in LiyNi0.33Mn0.33Co0.33O2 were calculated using Vegards law, as shown by Buchberger et al.,38 and are shown as stoichiometries in Figure 6b for all cells at both SoCs.
Marginal lithium deposition
The decrease of the stoichiometry x in the anode at 100% SoC, see Figure 6a, reveals a loss of lithium inventory as the dominant aging mechanism for both linearly- and nonlinearly-aged cells. This capacity loss causes a decrease of the stoichiometry y in the cathode at 0% SoC, as depicted in Figure 6b. Based on the stoichiometry changes, we calculated the loss of lithium inventory both for the anode and the cathode. These capacity losses – which were determined with neutron diffraction independently – match up.
Figure 7 shows the capacity loss for all cells investigated by electrochemical analysis as well as in-situ neutron diffraction. The amount of lost capacity emerging following neutron diffraction is always less than the quantity determined by electrochemical analysis. Based on the setup of the neutron diffraction experiment, the top and bottom of the cell (approx. 25 mm in total compared to a cell height of 65 mm) were not illuminated by the neutron beam in order to avoid noisy signals from the cell holder and safety protection circuitry. Thus, 15 mm of the jelly roll is not captured by the neutron beam. Therefore, we are able to make a statement on the spatial distribution of aging and distinguish between the inner cell area and the edge area. The comparison between capacity loss determined by the two methods reveals an increasing capacity loss in the edge area of the electrodes with ongoing aging. Below an SoH of about 75%, the sharp decline indicates a prominent capacity loss in the edge area of the electrodes that are not illuminated by the neutron beam. We suppose two different dominant aging mechanisms that are the growth of the solid electrolyte interphase in the early stage and marginal lithium deposition in the later stage.
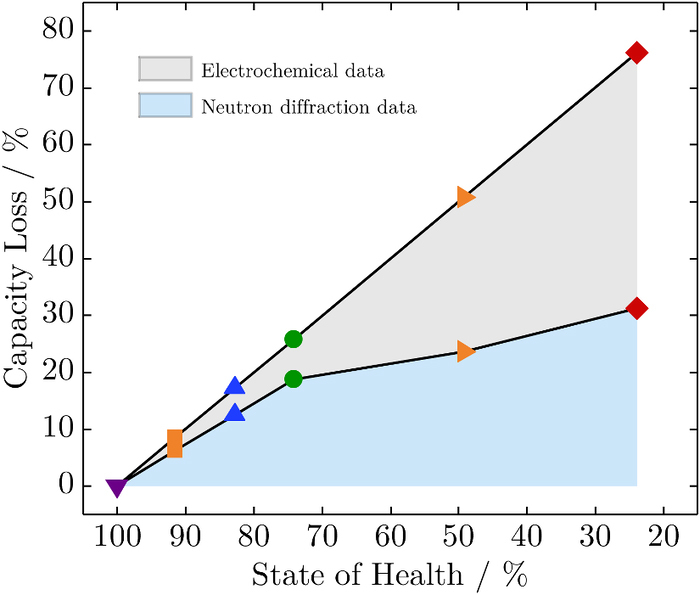
Figure 7. Comparison of the capacity loss determined by electrochemical analysis and in-situ neutron diffraction dependent on the SoH.
Senyshyn et al. revealed a non-homogeneity of the lithium distribution in the graphite anode by spatially resolved neutron diffraction.37 Non-uniformity has been found in both radial and axial directions of 18650-type cells and is affected by a cell fatigue.28 An inhomogeneous aging in combination with a marginal capacity loss is also in accordance with the observations by Cai et al.27 and Birkenmaier et al.39
Capacity recovery
Following the neutron diffraction experiment, the cells were stored for a few weeks in a safety environment because of radiation protection regulations at FRM II. Subsequently, we ran additional checkup tests. Figure 8a shows the relative capacities over equivalent full cycles, revealing both capacity recovery or capacity loss dependent on the SoH as well as the SoC the cells were stored at. Linearly-aged cells which were fully charged for the neutron diffraction experiment, reveal a capacity loss of less than 3.0%, whereas the fully discharged ones show a capacity recovery of less than 3.2%, as depicted in Figure 8b. This is in accordance with the investigations by Wilhelm et al.,40 showing a decrease or increase in capacity due to lithium diffusion into or out of the anode overhang area following long-term storage. The anode overhang area, as depicted in Figure 1c, does not have cathode counterparts and is designed to avoid lithium deposition at the edges of the anode.
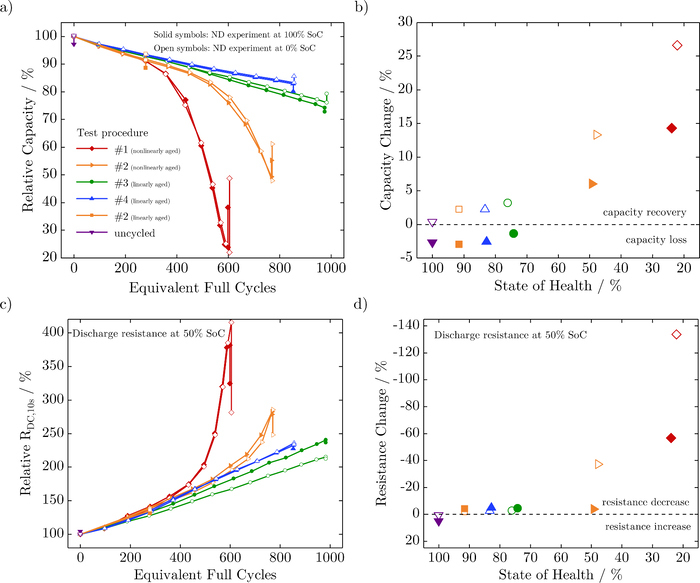
Figure 8. Capacity and resistance change after neutron diffraction experiment and storage due to radiation protection.
In contrast, all nonlinearly-aged cells show a capacity recovery. Cells that were stored at 0% SoC result in a higher recovery than those stored at 100% SoC. The effect of capacity recovery is consistent with lithium stripping, the partial reversible reaction of lithium deposition, as well as the chemical intercalation of lithium into the graphite.13,16,41,42 The reason for a higher capacity recovery for nonlinearly-aged cells compared to linearly-aged ones seems to be that more lithium was deposited than was stored in the anode overhang area. Additionally, lithium deposition and lithium stripping likely proceed faster than lithium diffuses into or out of the anode overhang area.
Figures 8c and 8d show the relative internal resistance Rdc, 10s over equivalent full cycles and how it changes depending on the SoH. Linearly-aged cells reveal a decrease in resistance of less than 4.9%, independent of the SoC the cells were stored at, except the uncycled cells that show an increase in resistance of less than 5.0%. For the nonlinearly-aged cells, the resistance is inversely proportional to the capacity, showing a higher resistance decrease for discharged cells.
Table III summarizes the cells' capacities before and after neutron diffraction, depending on their SoH and SoC.
Table III. Information on the investigated cells and their capacity recovery after neutron diffraction experiment.
| Test procedure | #1 | #2 | #3 | #4 | #2 | uncycled | ||||||
|---|---|---|---|---|---|---|---|---|---|---|---|---|
| Cell number | 1 | 2 | 3 | 4 | 5 | 6 | 7 | 8 | 9 | 10 | 11 | 12 |
| SoC for ND experiment/% | 100 | 0 | 100 | 0 | 100 | 0 | 100 | 0 | 100 | 0 | 100 | 0 |
| CheckUp data after cycling and before neutron diffraction experiment | ||||||||||||
| Equivalent full cycles | 599 | 604 | 767 | 770 | 975 | 982 | 852 | 856 | 278 | 278 | 0 | 0 |
| Capacity/Ah | 0.4920 | 0.4532 | 1.0153 | 0.9832 | 1.5295 | 1.5596 | 1.7129 | 1.7157 | 1.8815 | 1.8856 | 2.0673 | 2.0506 |
| SoH/% | 23.9 | 22.1 | 49.3 | 47.9 | 74.2 | 76.1 | 82.8 | 83.3 | 91.5 | 91.5 | 100.0 | 100.0 |
| CheckUp data after cycling and after neutron diffraction experiment | ||||||||||||
| Capacity/Ah | 0.7862 | 1.0008 | 1.1379 | 1.2553 | 1.4992 | 1.6246 | 1.6579 | 1.7615 | 1.8199 | 1.9305 | 2.0114 | 2.0594 |
| SoH/% | 38.2 | 48.7 | 55.3 | 61.2 | 72.8 | 79.3 | 80.2 | 85.5 | 88.5 | 93.7 | 97.3 | 100.4 |
Post-mortem analysis
SEM imaging discloses degradation mechanisms on the surface of cell components. The detectable phenomena are: the growth of films on electrodes; the clogging of pores; cracks in electrode coatings; the deformation of electrodes; changes on particle surfaces; and particle cracks.22 At the end of the aging experiment, we opened a nonlinearly-aged cell cycled under test condition # 1 and an uncycled cell in an argon-filled glove box. Electrode samples were punched out in the middle part of both anode and cathode, and SEM images obtained. Primary and secondary particles are clearly visible for uncycled as well as nonlinearly-aged cathode samples, as depicted in Figures 9a and 9b. At the same time, the cathode microstructure seems to be unchanged, as also shown by Waldmann et al.43 and Burns et al.44 The anode, in contrast, reveals significant changes. Figure 9c shows the flake-shaped graphite particles from the uncycled anode, whereas the aged anode is shown in Figures 9d–9f at different magnifications. First of all, surface changes are attributed to SEI growth, which causes the clogging of pores and LLI.43–45 Moreover, cracks in electrode coatings and particles due to mechanical stress caused by volume changes are visible.46,47 Figure 9f and the observable morphology changes in particular support our theory of lithium deposition on graphite, as also shown by Honbo et al.48 and Uhlmann et al.49 Although SEM imaging neither reveals the amount of lost capacity nor distinguishes between SEI growth and lithium deposition, we have qualitatively confirmed the aging mechanisms determined by electrochemical analysis and neutron diffraction.
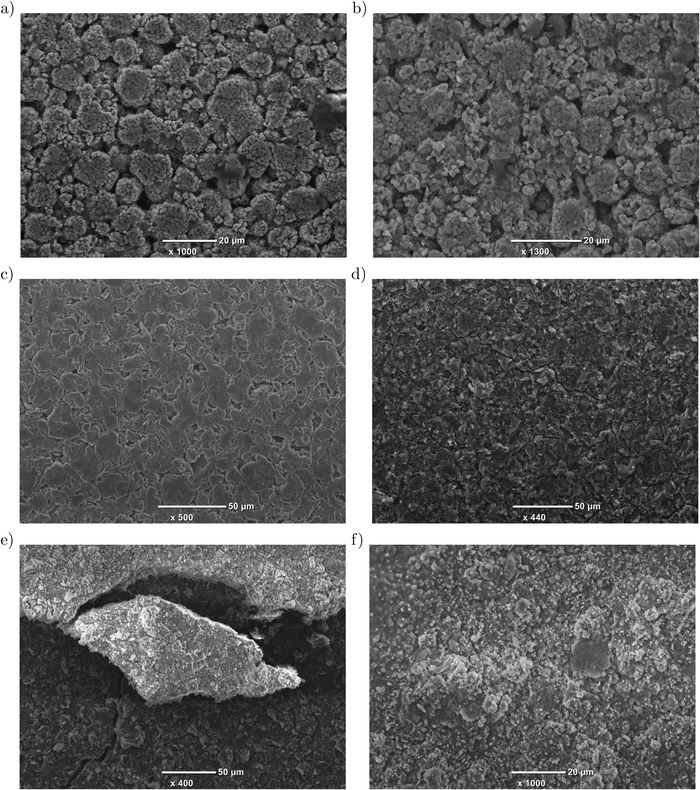
Figure 9. SEM images of electrode samples: a) cathode of uncycled cell, b) cathode of nonlinearly-aged cell, c) anode of uncycled cell and d)-f) anode of nonlinearly-aged cell at different magnifications.
The cells were also opened to gain insights into their internal structure and electrode geometries. Figure 1c emphasizes the anode and cathode geometries, the anode overhang area and the inner cell area, illuminated by the neutron beam.
Conclusions
In this work, the linear and nonlinear aging of commercial 18650-type C/LiNi0.33Mn0.33Co0.33O2 lithium-ion cells was investigated. The cells were cycled under different test procedures at a controlled temperature of 25°C. In-situ neutron diffraction measurements were performed for cells at various SoHs in their fully discharged and charged states. After storage, additional checkup tests were run. Selected cells were opened in a glove box and surface morphologies were qualitatively investigated by SEM.
The main findings are as follows:
- (1)Cells aged with a standard charging and discharging rate of almost 1C, but different resting times, showed a nonlinear capacity fade after a few hundred equivalent full cycles. By increasing the discharging current or decreasing the charging current, the lifetime improved, resulting in a linear capacity fade. Shortening the relaxation time between cycles positively influenced the lifetime by roughly 40%, whereas a higher discharging current almost doubled the cell's lifetime.
- (2)The neutron diffraction experiment and differential voltage analysis revealed the loss of lithium inventory as the dominant aging mechanism for both linearly- and nonlinearly-aged cells. Other aging mechanisms, like the structural degradation of anode or cathode active materials or the deactivation of active materials could not be confirmed.
- (3)The comparison between capacity loss determined by electrochemical analysis and neutron diffraction revealed an increasing capacity loss in the edge area of the electrodes with ongoing aging. We supposed two different dominant aging mechanisms that are the growth of the solid electrolyte interphase in the early stage and marginal lithium deposition in the later stage.
- (4)After a few weeks of storage, checkup tests showed both capacity recovery or capacity loss dependent on the SoH as well as the SoC the cells were stored at. Linearly-aged cells that were fully charged for the neutron diffraction experiment revealed a capacity loss of less than 3.0%, whereas the fully discharged ones pointed out a capacity recovery of less than 3.2%, owing to lithium diffusion into or out of the anode overhang area, respectively. On the other hand, all nonlinearly-aged cells showed a capacity recovery due to lithium stripping, the partial reversible reaction of lithium deposition, as well as the chemical intercalation of lithium.
- (5)SEM images of uncycled and nonlinearly-aged cells qualitatively showed surface layer growth and morphology changes on the graphite anode, whereas the cathode particles appeared unchanged.
The results demonstrate the influence of operational strategies on the lifetime of lithium-ion cells. State-of-the-art battery-management systems reduce the charging current at high anode lithiation states and low temperatures, to prevent lithium deposition. Future enhancements, especially for fast-charging applications, may also take into account predicted and subsequent relaxation time and discharge currents, cell inhomogeneities and geometry, as well as the cell's SoH.
Acknowledgments
The presented work was supported by the German Federal Ministry of Education and Research under grant number 03XP0081 (ExZellTUM II). The neutron diffraction experiment was performed using the SPODI instrument operated by FRM II, at the Heinz Maier-Leibnitz Zentrum (MLZ), Garching, Germany. The authors would like to thank Prof. Dr. Hubert A. Gasteiger's group at the Chair of Technical Electrochemistry, Technical University of Munich, for the opportunity to carry out SEM measurements.
ORCID
Jonas Keil 0000-0002-0674-2676
Neelima Paul 0000-0002-6906-1683
Volodymyr Baran 0000-0003-2379-3632
Peter Keil 0000-0003-4986-2413
Ralph Gilles 0000-0003-2703-4369
Andreas Jossen 0000-0003-0964-1405