Abstract
A previous publication reported the electrochemical characterization of a thermodynamic reference electrode (TRE) for 2LiF-BeF2 (FLiBe) that used the Ni/Ni(II) couple, a BN body and a LaF3 ionic membrane [F. Carotti, H.Wu and R.O. Scarlat, J. Electrochem. Soc. 164, 12 (2017)]. This paper presents the post-operation characterization of the two TREs, operated in the previous publication for 100 hours and 15 hours: ICP-MS of salt samples and SEM/EDS and XRD of BN samples. The results confirm Ni(II) depletion from FLiBe by reaction of NiF2 with the BN electrode body. NiF2 concentration decreases to 0.090 ± 0.011 mol%, measured by ICP-MS. Metallic Ni powders on the BN tube inner surface are identified by XRD and SEM-EDS. The LaF3 membrane maintains its structural integrity after LaF3 reaches its solubility limit in FLiBe, determined to be 0.14 ± 0.03 mol% LaF3. The effective chemical separation between NiF2-doped FLiBe and the main FLiBe bath is confirmed by no increase in Ni content in the main salt bath. LaF3 mass transport to the main salt bath is limited by the 0.3 mm diameter hole in the BN tube that houses the TRE. No significant interaction between FLiBe and BN is detected, as demonstrated by no variation in the B content in the main salt bath. These results point to the feasibility of this design as a stable TRE, as long as NiF2 depletion is addressed and LaF3 is allowed to equilibrate to its solubility limit.
Export citation and abstract BibTeX RIS

This is an open access article distributed under the terms of the Creative Commons Attribution Non-Commercial No Derivatives 4.0 License (CC BY-NC-ND, http://creativecommons.org/licenses/by-nc-nd/4.0/), which permits non-commercial reuse, distribution, and reproduction in any medium, provided the original work is not changed in any way and is properly cited. For permission for commercial reuse, please email: oa@electrochem.org.
Thermodynamic reference electrodes (TREs) are galvanic half-cells that provide a potential reference that is stable in time and reproducible across experiments. TREs enable the derivation of chemical activity and Gibbs free energy values from potential measurements and vice versa.1 In the field of molten fluoride salt electrochemistry, the development of a TRE is constrained by material compatibility. Few electrically insulating and ion-conductive materials have sufficient chemical stability in molten fluorides to avoid chemically contaminating or otherwise modifying chemical activities in salt solutions. While several TREs have been designed and tested in molten fluoride salts,2–4 a TRE for molten 2LiF-BeF2 (FLiBe) that is well-characterized over a broad range of time scales and temperature histories is not yet available.5
Electrochemical characterization of a TRE designed with a BN tube as a container for NiF2-doped FLiBe and a LaF3 membrane was recently published by the authors in Ref. 6. Lanthanum fluoride crystal has been previously shown to be an effective ionic membrane, selectively permeable to F−, and electrically insulating.3,7,8 The Ni/Ni(II) redox couple is thermochemically characterized in FLiBe2,6 and the formal potential at dilute concentrations of NiF2 in FLiBe is known;9 therefore, Ni/Ni(II) can be used in the design of a TRE as long as the chemical activities of the Ni metal and Ni2+ in FLiBe solution are known and maintained constant. The half-cell potential E of this TRE of the first kind is predicted by the Nernst equation, Eq. 1:
![Equation ([1])](https://content.cld.iop.org/journals/1945-7111/166/15/H835/revision1/d0001.gif)
where E0'Ni/Ni(II) is the formal potential, xNi(II) is the molar fraction of Ni(II) ions in FLiBe, xNi is the concentration of Ni metal in the solid phase, T is the temperature at which the TRE operates, R is the ideal gas constant and F the Faraday constant. xNi is assumed unity for the metallic Ni rod. The Nernst equation indicates that a stable half-cell potential requires a stable concentration of Ni(II) ions in FLiBe. The solubility of NiF2 in FLiBe is well-characterized in the temperature range of 480°C to 600°C.10 NiF2 was added to FLiBe at its saturation value in order to maintain a known Ni2+ concentration in FLiBe. The TRE exhibited a stable and Nernstian behavior for ten hours of operation, along with low noise and favorable electrochemical properties. After ten hours of electrode lifetime, the electrode showed an unexpected drift in the measured potential. This drift was hypothesized to be due to depletion of Ni(II) from the TRE salt solution.
The present study tests the hypothesis of NiF2 reduction in the TRE body by post-operation characterization of the TRE materials. It is likely that NiF2 depletion is not a large engineering challenge for a TRE since NiF2 can either be continuously replenished or it can be loaded in overabundance when the electrode is assembled. Confirmation of this cause for the electrode drift would be encouraging to TRE designers. Additionally, other reactions or interactions among the TRE materials (LaF3, EuF3, BN, Ni, NiF2 and FLiBe) are considered that could affect the activity coefficients of Ni2+ in solution or could compromise the F− selective permeability of the electrode membrane. Chemical and material characterization is performed on the two TREs, whose electrochemical performance was studied by the authors in Ref. 6. The two TREs were operated for different durations, 100 hours and 15 hours, and were prepared with different concentrations of NiF2. The long-duration electrode exhibited a potential drift. A comparative material characterization of the two electrodes provides for this study the possibility to identify the time-scale of degradation mechanisms that lead to potential drift.
Experimental
Sample preparation
Electrochemical tests are conducted in Ref. 6 with two separate TREs, RE-01 and RE-02. Table I summarizes the details of RE-01 and RE-02. The electrode body is a 35 mm tall BN closed-end tube. A LaF3 single crystal membrane provides ionic conductivity with the main salt bath; it is in contact with the main salt bath through a 0.3 mm diameter hole on the side of BN tube. As reported by the manufacturer, low-concentrations Eu (nominally 0.3% molar fraction) is present as a dopant to the LaF3 crystal to increase its ionic conductivity. RE-01 operated for around 100 hours and showed a potential drift of more than 70mV vs. a glassy carbon quasi-reference electrode. RE-02 operated for roughly 15 hours. For additional details on the electrode design, electrode materials, salt preparation, and salt characterization the reader is directed to the previous publication by the authors.6
Table I. Details of reference electrodes RE-01 and RE-02, electrochemically tested by the authors in Ref. 6.
| RE-01 | RE-02 | ||
|---|---|---|---|
| FLiBe [g] | (7.064 ± 0.002)10− 1 | (7.577 ± 0.002)10− 1 | |
| NiF2 [g] | (2.43 ± 0.02)10− 2 | (1.17 ± 0.02)10− 2 | |
| NiF2 [mol%]* | 1.18 ± 0.03 | 0.53 ± 0.03 | |
| Molten Time [hours] | 100 | 15 | |
| Melt-freeze cycles | Multiple | Multiple | |
| Temperature [°C] | 500-600 | 500-600 |
*Mole fractions are calculated on a basis of a three-component system comprised of NiF2, LiF and BeF2.
Table II lists the salt samples and BN samples collected for analysis and provides details about collection method and visual appearance. All sample preparation and sample storage are performed inside a glove box (LC-Technology) that maintains an argon atmosphere with oxygen and moisture below 1ppm. The BN tubes of RE-01 and RE-02 are cut open using a metal razor blade to extract the salt from the TREs. Salt samples are prepared by breaking up the salt with an agate mortar and pestle (Sigma-Aldrich, part Z112526). The samples are sealed in borosilicate vials in the glove box and sent for ICP-MS analysis. Even though the sample collection method aims to limit sample contamination, the contamination of salt samples by BN cannot be excluded due to the dusty nature of BN. BN samples are collected using a razor blade to separate two pieces (BN-01 and BN-02) from RE-01 and stored in borosilicate vials in the glove box.
Table II. List of samples analyzed, sample collection method and visual aspect of samples. Photographs of the samples are provided in Table SM-01 of Supplemental Material.
| Salt samples from RE-01 | |
| RE-01-T - Top salt sample. It presents black coloration/particles on the top and side surfaces; internally, it has a white color. | |
| RE-01-M - Middle salt sample. It presents a white color and little black on the outside surface. | |
| RE-01-B - Bottom salt sample. It presents back specks on the side surfaces; internally, it has a white color. It could include fragments of the LaF3 crystal, due to the physical separation process. | |
| Salt samples from RE-02 | |
| RE-02-M - Middle salt sample. It presents a green color and very little black on the outside surface. | |
| Salt samples from main salt batch (Salt-01) and blank (Salt-02) | |
| Salt-01 - Two separate salt samples were collected from the main salt batch, in which RE-01 and RE-02 were immersed during electrochemical testing reported in Ref. 6. Total mass of main salt batch was 43 g. The samples are collected from the center of the frozen salt puck and present a clear white look. | |
| Salt-02 - Two separate salt samples were collected from FLiBe prior to the electrochemical tests. The samples are clear white. | |
| XRD and EDS samples from RE-01 | |
| BN-01 - BN wall of RE-01 not in contact with FLiBe. Powder form. | |
| BN-02 - BN wall of RE-01 in contact with NiF2-doped FLiBe. Solid form. | |
| BN-03 - Approximately 15 mg of mixed black and white powders collected in the bottom of RE-01 are collected for analysis by XRD. Powder form. | |
Sample characterization
The ICP-MS analysis is performed by the University of Wisconsin - State Laboratory of Hygiene and follows the procedure previously described in Refs. 8, 11. Samples are digested in acidic aqueous solution using two dissolution matrices, one with HF, one without HF. Both digestions proved to be equally effective at dissolving most of the elements and the analytical results from multiple digestions are averaged. Lanthanum, europium, and boron are exceptions. La and Eu ICP-MS values are lower and have more scatter when digested with-HF compared to digestion without-HF. This effect could be caused by volatilization or precipitation of species when HF is added to the acidic aqueous solution. For La and Eu, only the results from digestion without-HF are considered. Due to the limited size of the collected sample, RE-01-M is not digested without-HF; the La and Eu values in RE-01-M are inferred, with large uncertainty, from the values measured for the with-HF digest; details of this calculation are provided in Supplemental Material. Boron values are lower when digesting without-HF; for B, only results from digestion with-HF are considered.
The ICP-MS elemental content is reported in wppm, defined as the ratio of the weight of the element to the weight of salt sample analyzed. The mole fractions are calculated on a basis of a multi-component system comprised of LiF, BeF2, and the solute species considered; for the purpose of these calculations, the LiF-BeF2 molar ratio is assumed to be 2.00:1. This approach is equivalent to using a FLiBe molar weight of 33.0 g/mol; a similar convention is used in Ref. 9.
For X-ray diffraction (XRD) analysis, powdered salt samples are prepared on a glass microscope slide in the glove box. Double-sided tape is used to fix the sample to the surface of the slide. Kapton film (0.3 mm thick, SPEX Sample Prep) is wrapped around the slide to contain the sample and to limit air exposure of the sample. XRD is performed with a Bruker D8 Discover diffractometer equipped with a CuKα monochromated radiation source (λ = 1.541 Å) operated at 50 kV and 1000μA, using the software Diffrac. The area detector rotates in 10o steps, 20o to 80° and each step has a duration of 5 minutes. A 0.5 mm collimator is used and the sample stage is rotated at a rate of 0.3 rotations per minute to provide a random sampling of crystal orientations in the sample. The instrument is calibrated with corundum (Al2O3) as the standard material (NIST SRM 676a). XRD raw data undergoes Kα2 component stripping and background subtraction using the Diffrac.Eva v3.1 software. PDF-4+ 2016 (International Center for Diffraction Data) powder diffraction file (PDF) library is used for pattern identification and peak assignment. Raw XRD data is reported in Supplemental Material.
Scanning Electron Microscopy (SEM) is performed with a LEO 1530 instrument, which uses a Schottky-type field-emission electron source. Energy Dispersive Analysis System (EDS) (5 kV accelerating voltage, 27.5 take-off angle), which is integrated into SEM, is used to determine the elemental composition of sample surfaces. The SEM/EDS samples are prepared in the glove box. During transfer from the glove box to the SEM/EDS instrument air exposure is likely, for a duration of less than two hours.
Beryllium safety
BeF2, like all beryllium-containing compounds, is a hazardous chemical. The glove box, fume-hood, and personal protective equipment provide protection from respiratory and dermal exposure to beryllium-containing chemicals. Beryllium contamination in the laboratory is monitored by surface swipes. The work in the present study is performed during the period of June 2015 through June 2016, during which a total of 202 surface swipes are analyzed. Any detection of beryllium above the detection limit of 0.025 μg/100 cm2 (a total of 18 swipe samples with detectable Be) is followed by cleaning and decontamination actions. The housekeeping goal for the lab is 0.2 μg/100 cm2;12 during the duration of the present study this goal is exceeded on two occasions, followed by updated standard operating procedures and extensive lab cleaning and decontamination.
Results and Analysis
Visual observations
Salt from RE-01 and RE-02 is removed as relatively intact cylinders of frozen salt. RE-02 frozen salt presents a green tint, which is typically observed when NiF2 is added to FLiBe solution. Such a green tint was absent from the RE-01 salt. A large quantity of black powders is visible at the top and on all the outside surfaces of the salt cylinder in RE-01 and to a lesser extent in RE-02. To avoid the presence of floating or deposited insoluble components, RE-01-M and RE-02-M are salt samples collected from the center of the RE-01 and RE-02 salt cylinders; these two samples are assumed to be representative of the bulk salt in RE-01 and RE-02. The internal cavity of the BN tubes, originally of white color, is found partially covered with black residue. This phenomenon is most evident in RE-01 (Figure 1) and it is also present in RE-02 to a lesser extent.
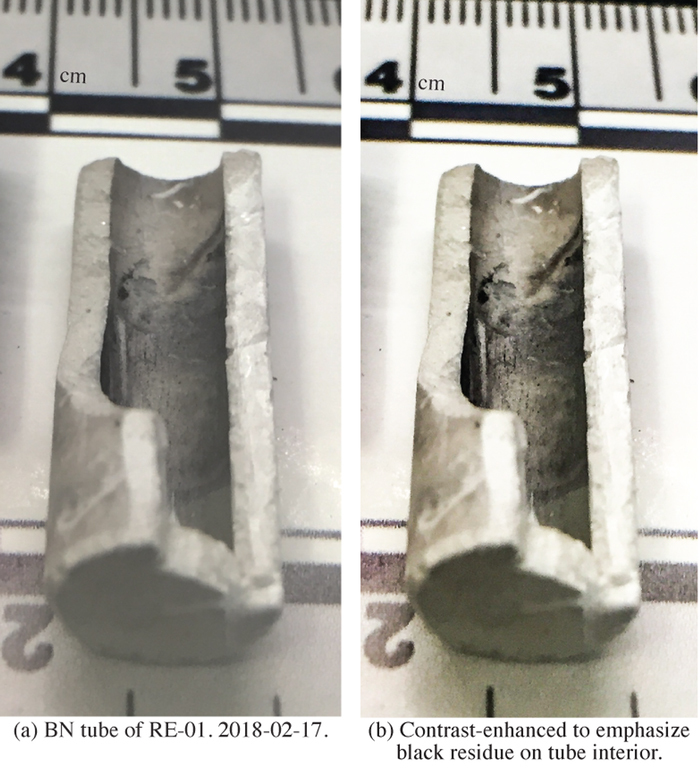
Figure 1. RE-01 BN tube. Black residue is observed on the interior of the tube, after exposure to NiF2+FLiBe. No black residue is visible on exterior of the BN tube, after exposure to FLiBe.
Salt elemental analysis
ICP-MS results demonstrate a change in the mass fraction of Ni, La, Eu and B after operation of the TREs, as reported in Figure 2. The results for these elements are discussed here, and the full ICP-MS dataset of 47 analyzed elements is reported in Figure SM-03 of Supplemental Material.
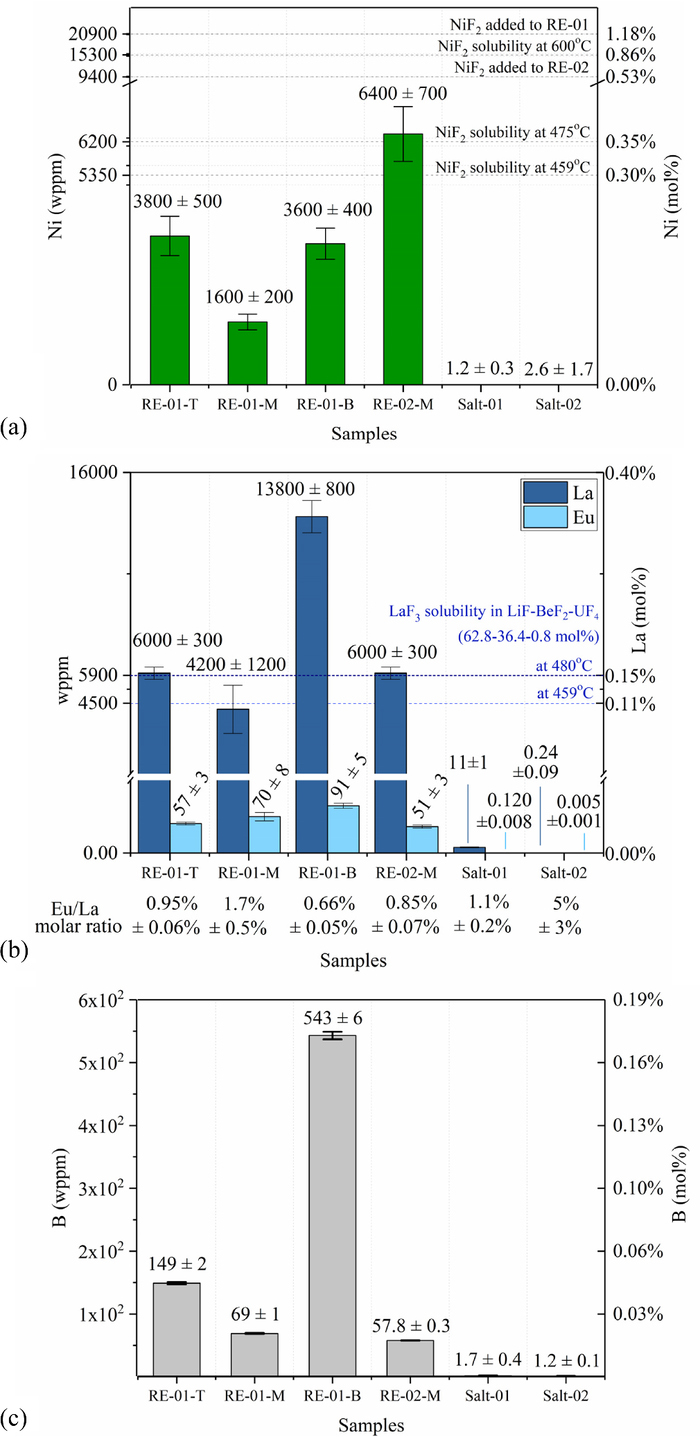
Figure 2. Elemental analysis of FLiBe samples, by ICP-MS. (a) Nickel. Error bars are one standard deviation of multiple digests. NiF2 solubility in FLiBe from.6,10 (b) Lanthanum and europium. Error bars are one standard deviation of ICP-MS runs of a single digest. LaF3 solubility value in LiF-BeF2-UF4 (62.8-36.4-0.8 mol%) from.13 Eu/La in as-manufactured LaF3 crystal is 0.3 mol%. (c) Boron. Error bars indicate one standard deviation of multiple digests with HF.
Nickel fluoride depletion
Figure 2a shows that the Ni mass fraction in all the three RE-01 samples is lower than in RE-02. This demonstrates higher depletion of NiF2 after 100 hours of RE-01 operation than after 15 hours of RE-02 operation. It is to be noted that the initial loading of NiF2 in RE-01 was twice as high as in RE-02 (see Figure 2a). Nevertheless, after operation, the concentration of NiF2 in RE-01 is smaller than in RE-02, indicating that the NiF2 depletion occurs over a timescale of ten hours to hundreds of hours.
The measured NiF2 in both RE-01 and RE-02 is lower than the NiF2 that is originally added to them. It is possible that RE-02 depleted over the course of 15 hours; it is also possible that the observed decrease was due to the compositional fractionation during solidification. The lowest temperature datum available for NiF2 solubility in FLiBe is 6200 wppm at 475°C, which is equal to the RE-02-M value (t-test, 95% confidence).10 The linearly extrapolated solubility at the melting point of FLiBe (459°C) is 5200 wppm, which is two standard deviations below RE-02-M. While there is uncertainty in the absolute values of NiF2 loading above 5200 wppm, there is less uncertainty in the comparison between RE-01 and RE-02, because they experience the same thermal transient during solidification. Furthermore, this uncertainty does not affect the RE-01 values, all of which are below 5200 wppm.
Boron nitride integrity and impermeability
Figure 2a shows no increase in the Ni mass fraction in Salt-01 compared to Salt-02 (t-test, 95% significance), indicating that BN is not penetrated by Ni ions. Figure 2c shows that the quantity of B found in Salt-01 is not statistically different than the B found in Salt-02 (t-test, 95% significance). Thus, there is no indication of corrosion products of BN in FLiBe. Salt-01 and Salt-02 are not in contact with BN surfaces at the time of sampling; and contamination by BN powders is not expected as a source of error for these samples. No other indications of BN degradation in FLiBe are observed.
Boron is found in the salts of RE-01 and RE-02 (Figure 2c). Given the dusty nature of BN, boron content in TRE salt samples could be due to contamination of the samples by BN powders; however, because the sampling process was similar for RE-01 and RE-02, a comparison between the two remains reliable. BN redox reaction with NiF2 could produce soluble boron species in the salt. Higher boron content is observed in RE-01 than in RE-02. This indicates that the BN reaction occurs over a timescale of ten hours to hundreds of hours.
Lanthanum fluoride crystal dissolution
RE-01-M and RE-02-M show a statistically equivalent LaF3 content, which averages to 5400 +/− 1000 ppm across RE-02-M, RE-01-M, and RE-01-T. Figure 2b shows that this amount is within one standard deviation of LaF3 solubility of 6300 wppm at 480°C in LiF-BeF2-UF4 (62.8-36.4-0.8 mol%). Temperature-extrapolation to 459°C yields LaF3 solubility of 4500 wppm,13 also within one standard deviation of the observed value. This indicates that LaF3 reaches a solubility limit in FLiBe within less than 15 hours of equilibration time. Europium, nominally present at 0.3 mol% in the LaF3 crystal procured from Crystran Ltd, UK, is also detected. Eu in RE-01-M is higher than in RE-02-M, indicating that its solubility has not yet been reached within 15 hours.
Salt-01 presents a statistically higher La content than Salt-02, and more than two orders of magnitude smaller than RE-01-M and RE-02-M. Similarly, Eu in Salt-01 is statistically higher than in Salt-02. Since the LaF3 crystal has some solubility in FLiBe, a small flux of lanthanum and europium occurs through the small hole in the BN tube that allows for ionic contact between the TRE and the main salt bath.
Spatial variability of RE-01 composition
Composition variability is observed among the three solid salt samples from RE-01. The bottom salt volume can include precipitated species. Ni metal (9000 kg/m3) and NiF2 (4700 kg/m3) are of higher density than FLiBe (2000 kg/m3). The top salt volume could include powders that remain suspended due to surface tension effects. RE-01-T and RE-01-B have equal nickel content, higher than RE-01-M, and lower than the solubility limit. RE-01-M has less than 30% of the NiF2 solubility limit and less than 5% of the initial NiF2 added to RE-01, confirming Ni(II) depletion. RE-02-M is at the solubility limit of NiF2 in FLiBe at its melting point.
Similarly, spatial distribution of La concentration is observed in RE-01. The higher La concentration in RE-01-B is attributed to two possible effects: i) solid fragments of the LaF3 crystal that are physically trapped in RE-01-B, ii) saturated LaF3 precipitated out of solution during cooling transients. RE-01-T and RE-01-M have equal LaF3 content, pointing in the direction of imperfect sampling being the cause for the high LaF3 content in RE-01-B. RE-01-B had 0.65% Eu/La, compared to 1.2% in RE-01-M and 1.0% in RE-01-T, and also compared to 0.85% in RE-02 and 1.1% in Salt-01. The lower Eu content in RE-01-B is closer to the 0.3% expected in the LaF3 crystal. This observation indicates that small fragments of the LaF3 crystal were collected with the RE-01-B sample. We conclude that samples collected from the middle of the electrode salt are most likely to be representative of the bulk composition of the melt.
BN surface analysis
XRD results performed on BN-01, BN-02 and BN-03 are reported in Figure 3. BN-characteristic peaks are labeled with their respective Miller indexes, from the Powder Diffraction Files (PDF) in Table III. Additional peaks of smaller intensity found in BN-01 between 2θ of 30° and 43° are attributed to constituents of the BN and are considered as part of the BN background when interpreting the BN-02 and BN-03 spectra. The diffraction patterns of BN-02 and BN-03 show two additional peaks, which correspond to the two main peaks of the metallic Ni. These peaks do not match any major peaks of NiF2 (see Table III). These results demonstrate the presence of metallic Ni on the inner surfaces of the TRE.
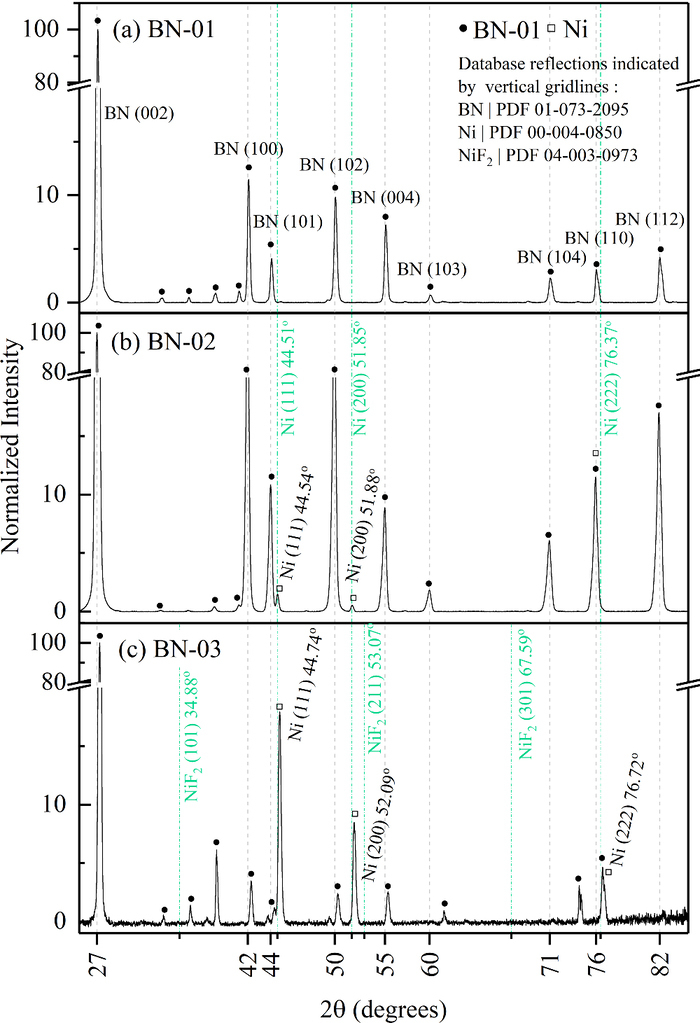
Figure 3. XRD of boron nitride samples. The full dots indicate the peaks that were found on BN-01. In BN-02, two additional small peaks are attributed to a small amount of metallic Ni (and not to NiF2). In BN-03, presence of metallic Ni in abundance is confirmed.
Table III. Expected diffraction peaks for BN, Ni and NiF2. For NiF2 the peaks of relative intensity higher than 10% are given.
| Miller | Relative | |||
|---|---|---|---|---|
| Compound | Number | Indices (h,k,l) | 2Θ (°) | Intensity (%) |
| (002) | 26.75 | 100 | ||
| (100) | 41.61 | 14 | ||
| (101) | 43.87 | 4.5 | ||
| (102) | 50.16 | 12 | ||
| h-BN | 01-073-2095 | (004) | 55.11 | 5 |
| (103) | 59.54 | 1 | ||
| (104) | 71.35 | 2.5 | ||
| (110) | 75.94 | 4 | ||
| (112) | 82.19 | 6 | ||
| (111) | 44.51 | 100 | ||
| Ni | 00-004-0850 | (200) | 51.85 | 42 |
| (222) | 76.37 | 21 | ||
| (110) | 27.1 | 100 | ||
| (101) | 34.88 | 50 | ||
| NiF2 | 04-003-0973 | (111) | 40.05 | 15.6 |
| (211) | 53.07 | 50 | ||
| (220) | 55.88 | 16.5 | ||
| (301) | 67.59 | 15.3 |
Figure 4 presents the results of the SEM / EDS analysis performed on BN-02. Three textures are observed (Figure 4a). EDS point scans are used to identify the elemental composition of each of the textures (Figure 4b). EDS cannot identify the contribution of Li, Be and B signals as they are grouped together below the lowest energy peak; EDS does differentiate among N, Ni, and F. Texture 1 is a layered structure that is present across all of the BN-02 sample and appears to be the underlying substrate. EDS on Texture 1 shows high N content, and no Ni or F. Texture 1 is attributed to BN.14 Texture 2 consists of micrometer-sized porous particles on top of Texture 1 and is observed across all the BN-02 sample. EDS on Texture 2 shows high Ni content, small amount of N, and no F. Texture 2 is attributed to metallic Ni. Texture 3 consists of 1–10 um droplet-shaped structures deposited on top of Texture 1. Texture 3 is only present in some regions on the BN-02 sample surface. EDS on Texture 3 shows high F content, small amount of N, and no Ni. Texture 3 is attributed to droplets of frozen salt on the BN surface. Additional SEM pictures are reported in Figure SM-02 of Supplemental Material.
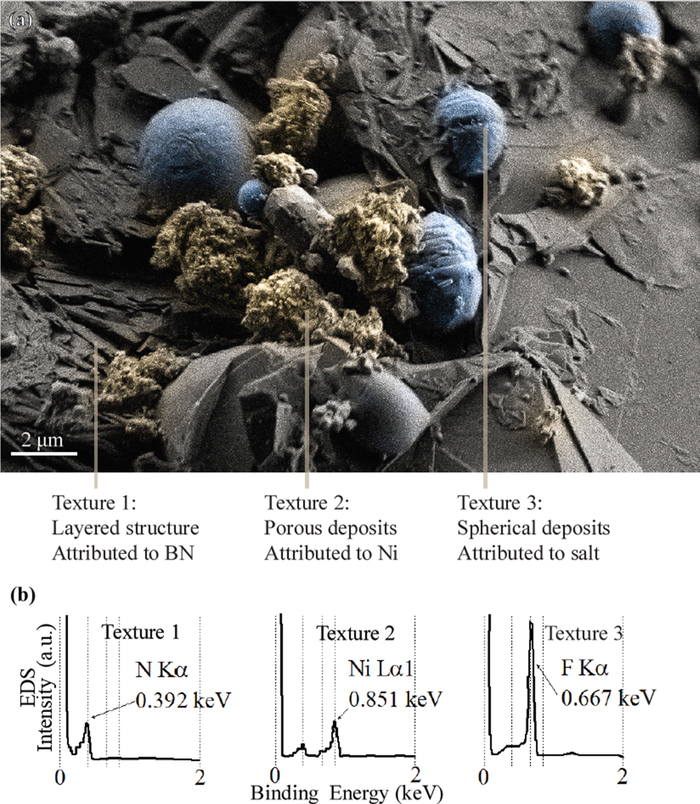
Figure 4. (a) SEM of BN-02. Color tint differentiates among three observed textures. (b) EDS point scans on each of the surface textures. Texture 2 (porous deposits, high Ni signal, and no F signal) is attributed to nickel metal.
Discussion
Reduction of NiF2
BN is expected to reduce Ni(II) to metallic Ni and form boron fluoride species. Figure 5 presents the Ellingham diagram for the chemical species relevant to possible reactions in the TRE. The reaction between NiF2 and BN (Eq. 2) is thermodynamically favorable above 150°C.15
![Equation ([2])](https://content.cld.iop.org/journals/1945-7111/166/15/H835/revision1/d0002.gif)
The decrease of Ni(II) concentration in the RE-01 salt being due to its reduction to metallic Ni by reaction with BN is confirmed by post-characterization of RE-01. After 100 hours operation at 600°C, visual inspection shows no green coloration of the RE-01 salt, indicating depletion of NiF2. ICP-MS confirms NiF2 concentration decreases to 0.090 ± 0.011 mol% after 100 hours of operation. Based on Equation 1, a TRE potential drift of 85 ± 5 mV would be observed when the concentration of Ni(II) in the TRE solution drops from its solubility value of 0.859 ± 0.016 mol% at 600°C to 0.090 ± 0.011 mol%. Electrochemical measurements report a drift of 70 ± 5 mV, based on time-dependent OCP measurements vs. a glassy-carbon quasi-reference electrode immersed in the main salt (shown in Figure 6 of the authors previous publication6). ICP-MS concentration measurements are within two standard deviations of electrochemical measurements for RE-01.
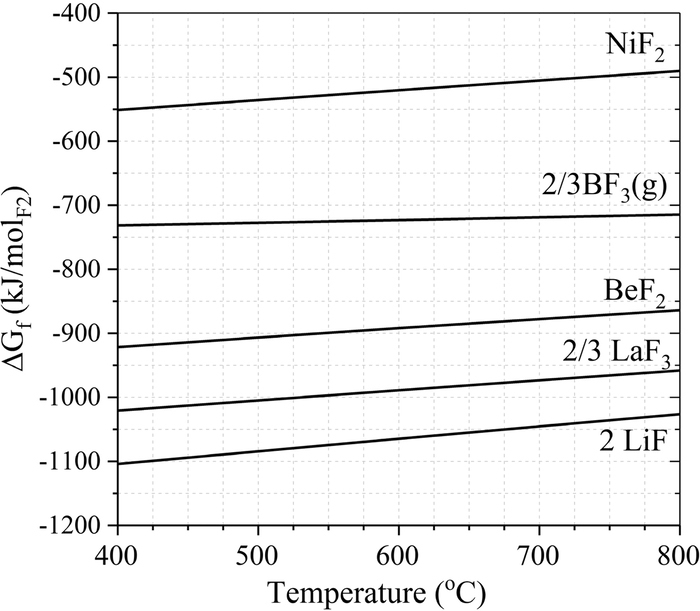
Figure 5. Ellingham diagram of the major chemical species relevant to possible reactions occurring in the FLiBe TREs.15
The black powders found at the bottom of RE-01 and on the surface of the RE-01 BN tube are identified by XRD and SEM-EDS to be metallic Ni. Boron content is higher in RE-01 than in RE-02. These results support the hypothesized reaction in Eq. 2. Some amount of black powders is visually observed in RE-02, indicating that also in RE-02 some amount of NiF2 is reduced to Ni. Boron content in RE-02-M is higher than in Salt-01 by more than one order of magnitude, indicating that at 15-hours the NiF2 reduction reaction has already proceeded.
The boron reaction product
Reaction 2 postulates production of volatile BF3(g). However, observed boron content is higher in RE-01 (0.0212 ± 0.0002 mol%) than in RE-02 (0.01764 ± 0.00009 mol%), and both are higher than in Salt-01 (0.0052 ± 0.00012 mol%). Bates and Quist probe the structure of BF−4 anions in alkali-metal fluoroborate melts, including LiBF4, by IR emission spectrum and Raman spectroscopy; they report that the samples decomposed too rapidly for reliable emission data to be collected.16 Polyakova et al. studied the electrochemical behavior of soluble boron in molten KBF4+LiF-NaF-KF in the range of 2.6 to 15.9 mol% at 550°C to 700°C.17 Therefore, the observation of some amount of FLiBe-soluble boron is not surprising.
Formation of LiBF4 (Eq. 3) is thermodynamically favorable and can be considered as a possible solubilization mechanism for BF3(g) in FLiBe.
![Equation ([3])](https://content.cld.iop.org/journals/1945-7111/166/15/H835/revision1/d0003.gif)
If the Reaction 3 is responsible for the consumption of NiF2 in RE-01 from 1.2 mol% to 0.09 mol% and all of produced B remains soluble in the salt, then 0.74 mol% B would be expected in RE-01 salt. The measured value is lower by a factor of 40. If Reaction 3 is at equilibrium with 0.09 mol% NiF2 and 1 atm partial pressure of N2(g) bubbles, then 5 mol% B would be expected in RE-01 salt, 250 higher than the observed value. Another reaction to consider is the thermal degradation of LiBF4:
![Equation ([4])](https://content.cld.iop.org/journals/1945-7111/166/15/H835/revision1/d0004.gif)
If Reaction 4 is at equilibrium with 1 atm partial pressure of BF3(g) bubbles, then 0.6 mol% LiBF4 would be expected in RE-01 salt. The measured value is lower by a factor of 28. Challenging the bounding assumption of 1 atm BF3(g), the partial pressure of BF3(g) in equilibrium with the observed 0.02 mol% LiBF4 is calculated to be 3600 Pa.
In summary, soluble boron species are observed in small concentrations in the TRE salt, assumed to be solvated by FLiBe as LiBF4 (i.e. BF4− anions). The majority of the boron produced by the reduction of NiF2 is not retained in the salt.
Other factors that may affect the activity of NiF2
An LaF3 solubility limit of 0.140 ± 0.003 mol% is observed, based on samples collected in solid form from RE-01 and RE-02. This value is similar to the LaF3 solubility of 0.14 mol% at 480°C and 0.11 mol% at 459°C, reported in LiF-BeF2-UF4 (62.8-36.4-0.8 mol).13 This indicates that with a surface area of < 0.5 cm2, and a salt inventory of < 0.8 g, the equilibration time between the LaF3 crystal and FLiBe is less than 15 hours. The impact of 0.14 mol% of LaF3 on the activity coefficient of NiF2 in FLiBe solution is not known. However, the reasonably short equilibration time provides for a way to ensure a stable and repeatable TRE potential.
The presence of Eu in solution indicates that Eu has a non-zero solubility in FLiBe. RE-02 salt (15 hours at temperature) has 0.0011 mol% Eu; RE-01 salt (>100 hours at temperature) has 0.0015 mol% Eu. It is uncertain if the dissolution of Eu is limited by Eu solubility in FLiBe, or by the dissolution rate of the LaF3 crystal, or by the diffusivity of Eu in the LaF3 crystal. It is not expected for Eu at concentrations as low as 0.0015 mol% to impact the activity coefficient of NiF2 and the electrode potential is expected to be stable even if Eu dissolution has not yet reached equilibrium.
Only a small fraction of the boron reaction product is retained in the RE-01 salt after 100 hours of operation: 3% retention of the boron products in RE-01 after 100 hours of operation with an initial NiF2 loading of 1.2 mol%, and ≥16% retention of the boron reaction products in RE-02 after 15 hours of operation with an initial NiF2 loading of 0.53 mol%. It is advantageous to retain in the salt only a small fraction of retained boron products because soluble BF4− could impact the complexation of Ni2+ in FLiBe solution, and hence change the NiF2 activity coefficient. The impact of xBF4- on the activity coefficient of Ni2+ in FLiBe merits further study.
Integrity of TRE body
The BN body with a 0.3 mm diameter hole and the LaF3 crystal provide an efficient separation between the TRE salt and the main salt. This barrier is not penetrated by nickel as demonstrated by no increase in nickel content between Salt-02 and Salt-01 (t-test, 95% significance). In a FLiBe solution where only LiF and BeF2 are present in the melt, such as the main salt bath, BN should maintain its stability (see Ellingham diagram in Figure 5). BN is chemically stable in FLiBe, as demonstrated by no increase in boron between Salt-02 and Salt-01.
Lanthanum is detected in Salt-01 at a value higher than in Salt-02. The LaF3 dissolution rate into the main salt is limited by the small LaF3 surface exposed, pointing to the importance of the BN TRE body in protecting the LaF3 crystal from dissolution in FLiBe. The LaF3 crystal maintains its structural integrity because the dissolution of the LaF3 single crystal membrane is limited by the 0.14 mol% LaF3 solubility limit in the TRE compartment and the flux to the main salt bath is limited by the small surface area exposed (<0.25 mm2). The LaF3 membrane stability could be negatively impacted by temperature transients and freezing and melting cycles of the TRE, which could drive further LaF3 removal from the crystal membrane instead of re-dissolving deposited LaF3. The integrity of the LaF3 membrane upon several thermal cycles merits further study. Based on the Ellingham diagram in Figure 5, the LaF3 membrane should not be subject to reduction reactions in neither the NiF2-loaded TRE salt nor the main salt bath.
TRE design considerations
To avoid interaction of NiF2 with BN, alternative redox couples could be used for a FLiBe TRE. Some of the redox couples that are below BF3 on the Ellingham diagram include: AlF3, MnF2, TiF2, and TiF3.15 The amount of information available for Ni ions in FLiBe (solubility values, formal potentials, the chemical and electrochemical characterization of the Ni/Ni(II) redox couple, Nernstian behavior and reversibility) and the relatively low cost and easy manufacturability of metallic Ni electrodes will need to be weighed against the inconvenience of managing the NiF2-BN reaction.
To avoid NiF2 depletion from the electrode cup caused by the identified reaction with BN, and to extend the duration of stability of the TRE, excess NiF2 could be added to the electrode compartment. A NiF2 content higher than three or four times its solubility value would most likely extend the electrode lifetime considerably. This solution will be tested in future experiments with this type of TRE. This engineering solution could be susceptible to buildup of soluble boron compounds in the TRE salt, which could cause electrode drift by impacting the activity coefficient of Ni2+. Hence this engineering solution must be accompanied by testing of the boron content in the TRE salt as a function of operation time.
Alternatively, the geometry of the TRE can be optimized to eliminate contact surface area between the TRE salt and the BN tube by containing the electrode salt in a cup machined from a LaF3 crystal. The BN body on the exterior of the LaF3 crystal is still needed to limit the contact surface area between LaF3 and the main salt. This is important because with a sufficiently large amount of main salt the 0.14 mol% solubility of LaF3 in FLiBe can lead to loss of the integrity of the LaF3 membrane: 370 mg of LaF3 would dissolve in 43 g of FLiBe, which is 45% of the LaF3 crystal. Dissolution of LaF3 in the TRE salt is not a concern because the TRE salt inventory is small relative to the size of the LaF3 membrane (830 mg): 6 mg LaF3 would dissolve in 700 mg of FLiBe, which is 0.7% of the LaF3 crystal.
Conclusions
TREs provide a known, stable and reproducible potential reference and enable the direct extraction of thermodynamic information from electrochemical signals. In this work, we conduct a destructive analysis of Ni/Ni(II) TREs operated and electrochemically characterized in FLiBe.6 The materials analysis confirms that the electrochemical drift previously reported is due to the depletion of Ni(II) from the FLiBe solution. The reduction is driven by NiF2 reaction with the BN electrode body. ICP-MS confirms NiF2 concentration decreases to 0.090 ± 0.011 mol% at the end of 100 hours of operation. This  would correspond to 85 ± 5 mV potential drift, within two standard deviations of the observed potential drift of 70 ± 5 mV. Black powders are found at the bottom of RE-01 and on the surface of the RE-01 BN tube. XRD and SEM-EDS identify the powders to be metallic Ni. Boron content is higher in RE-01 than in RE-02. The reaction forms metallic Ni and BF3(g) and a fraction of the boron fluoride products are retained in the salt, e.g. as Li+BF4−.
The rest of the TRE materials and design elements appear to satisfy their functional requirements in the FLiBe TRE. The effective chemical separation between NiF2-doped FLiBe and the main FLiBe bath is confirmed by no increase in nickel content in the main salt bath. The LaF3 membrane maintains its structural integrity after LaF3 reaches its solubility limit in FLiBe, determined to be 0.140 +/−0.003 mol% LaF3. The LaF3 mass transport to the main salt batch is limited by the 0.3 mm diameter hole in the BN tube that houses the TRE. The main salt batch results in only minor contamination with LaF3 after 100 hours of operation. No significant interaction between FLiBe and BN is detected, as demonstrated by no variation in the boron content of the main salt bath. No evidence of other degradation mechanisms is observed in this analysis. This points to the feasibility of this FLiBe TRE, as long as NiF2 depletion is addressed and LaF3 is allowed to equilibrate to its solubility limit.
Acknowledgments
This research was performed using funding received from the DOE Office of Nuclear Energy's Nuclear Energy University Program project numbers 15–8352 and IRP-17-14541. Instrumentation support at the UW Materials Research Science and Engineering Center was provided by NSF grant DMR-1121288 for XRD facilities. F.C. and R.S. designed the experiments. F.C. and A.L conducted the experiments. H.W. performed the SEM/EDS and supported the experimental campaign and sample characterization. M.S. provided design, experimental and discussion inputs. R.S. performed the calculations in discussion. F.C. and R.S. wrote the manuscript. All authors analyzed and discussed the results and reviewed the manuscript.
ORCID
F. Carotti 0000-0002-6705-8819
R. O. Scarlat 0000-0003-3302-1142