
Abstract
Amorphous hard carbons (AHCs) and metal oxides such as TiO2 are of interest in applications for energy storage including pseudo/super-capacitors and lithium-ion batteries. We present measurements of lithium diffusion and distribution in anatase TiO2 and several ordered AHCs prepared by soft/hard-templating techniques, some with capacities > 800 mAh/g. The investigated AHCs have surface areas between 60–937 m2/g and pore volumes between 0.04–1.01 cc/g. Li-diffusion was measured using two complimentary techniques (1) Galvanostatic Intermittent Titration Technique (GITT), and (2) a stretched exponential to investigate the voltage-relaxation (VR) GITT curve. VR-GITT provides two parameters related to (i) the geometry through which the diffusion is occurring, and (ii) a time scale yielding the diffusion constant with knowledge of an appropriate length scale. Both methods find diffusion constants in very good agreement with each other. Most importantly, the VR-GITT fitting parameters serve as a distinctive characterization tool and are able to distinguish between AHCs with different pore geometries and synthesis techniques. Further analysis of the VR curves was performed by numerical integration of the diffusion equation and reverse Monte Carlo simulated annealing to investigate the Li density profile in both TiO2 and the carbons, and suggest that lithium may plate nanopores of AHCs.
Export citation and abstract BibTeX RIS
State-of-the-art Li-ion battery anodes in commercial consumer electronic devices are based on graphite, with a maximum theoretical specific capacity of LiC6, of 372 mAh/g. Potentially viable anode materials, which include Sn and Si have high specific capacities of 994 mAh/g and 4200 mAh/g respectively, exceeding the capacity of graphite, and therefore are desirable alternatives.1 Amorphous hard carbons have been extensively investigated as anode materials for Li-ion applications.1–7
Hard carbons (HC) are disordered materials; any graphitic domains present have very short coherence length (10–20 nm) as measured by X-ray diffraction.8 HCs made with phenolic resins, as opposed to carbon sources such as sucrose, start with aromatic structures and can have more extended fullerene-like order depending on the carbonization temperature.9 HCs compared to commercially available graphite show higher Li-ion capacity, but lower rate capabilities. For example, Ni et al. has demonstrated that HCs derived from phenolic resins can deliver 526 mAh/g capacity, which is about 40% higher than graphite.2 The main drawbacks of hard carbons are large irreversible capacity, the hysteresis in the voltage profile between charge and discharge cycles, and the low density of materials.1,3–5,10
Previous research on non-ordered hard carbon materials for Li-ion battery applications include studies of irreversible/reversible capacity reduction,6,7,11 understanding the Li insertion mechanisms12–14 and improving capacity by doping with other materials.15,16 Buiel et al. has discussed reducing the irreversible capacity by 50 mAh/g by applying ethylene gas using a chemical vapor deposition technique to minimize the air exposure of the materials.6 Also, in another published report by Buiel et al., it has been shown that reversible capacities are decreasing due to the formation of fullerenes inside the micro pores with the increasing heat-treatment temperature.11 Guo et al. has demonstrated that reversible capacity of 1675 mAh/g can be obtained by a composite of SiO2 and hard carbon prepared by a hydrothermal reaction.15
Ordered hard carbons have also been investigated as anode materials due to their unique properties. Li et al. has conducted a study to analyze the electrochemical properties of ordered mesoporous carbon prepared by the inorganic-organic-surfactant tri-constituent co assembly method and found that the material can deliver reversible specific capacity of 1048 mAh/g along with good cycling ability and capacity retention of 500 mAh/g even after 50 cycles.17 A comparative study has been conducted by Saikia et al. to investigate two different ordered mesoporous structures, namely CMK3 and CMK8 for anode materials and shown that CMK8 structure has more favorable properties like higher reversible capacity, better cycling ability and rate capability than CMK3.18
Apart from a Li ion battery material, hard carbons can be used in several other energy related applications. Hard carbons have unique properties such as chemical inertness, higher stability, ordered structures with higher pore volumes and surface areas, the ability to introduce hetero atoms into the surface without destroying the structures, and tunable pore sizes.2,3,19,20 These properties of carbon are beneficial in hydrogen storage applications,21–26 super capacitors,20,27 and in the latest Na-ion battery technology.14,28 In hydrogen storage materials mesoporous carbons can be used for the nanoconfinement of metal hydrides, which allows one to alter the thermodynamic and kinetic properties with respect to the bulk hydrides. Hard carbon materials have been used as a substrate for infiltration of different metal hydrides including LiBH4,21,22 NaAlH4,23 Li4BN3H10.24 Liu et al. has investigated the decomposition and wetting behavior of confined LiBH4 inside nanoporous hard carbon prepared from low temperature pyrolysis of phenolic resins and found that the diborane gas release can be eliminated by confining the LiBH4 in 2 nm pores. Lowering of the desorption temperature of LiBH4 compared to the bulk is also observed when it is confined in the ordered nanopores of the carbon.21 Supercapacitor electrodes made with template based hard carbon materials which have 3D structures and controllable pore sizes can deliver high specific capacitance; approximately 100–300 Fg−1 in aqueous medium and 50–150 Fg−1 in organic medium.20
Moreover, hard carbons may be used in solid-state batteries for confinement of active materials such as conversion reactions where limited diffusion of reactants may improve reversibility. Additionally, solid electrolytes at the forefront of research contain fast Li-ion conductors29–32 may be interfaced with hard carbon materials where the diffusion of Li at the interface becomes important to control the electronic and ionic conductivities between solid electrolyte and the electrode surface. For example, mixed conductive Li2S nano composite electrodes can be made with Li2S as active material, polyvinylypyrrolide (PVP) as the carbon source, and Li6PS5Cl as solid electrolyte in ethanol for all solid state lithium sulfur batteries.33 LiBH4 also can be used as solid electrolyte together with composite electrodes made with elemental sulfur and carbon additives.31 In the NASICON type solid electrolytes better electron conduction can be obtained by mixing the materials with single wall carbon nano tubes for all solid state lithium oxygen batteries.32
The use of alternative carbon-based anodes requires detailed diffusion investigation to understand the Li diffusion mechanisms inside these carbons. Moreover, proper diffusion analysis would reveal information about favorable structural properties of electrode materials for battery applications. Even though several studies have been conducted to analyze electrochemical properties such as capacity, rate performance, and charge-discharge performance of ordered mesoporous carbons, only a few diffusion analysis studies have been reported in the literature. To the best of our knowledge, this is the first detailed diffusion study conducted on pure forms of ordered mesoporous carbons synthesized by organic-organic di-constituent assembly (NPC-1), organic-inorganic-surfactant tri-constituent assembly (NPC-2) and nanocasting method (CMK3) carbon materials.
The nanoporous hard carbons discussed in this work are highly ordered, with well-defined pore structure. These carbon materials have surface areas in excess of 600 m2/g, pore volumes between 0.4–1.5 cc/g and uniform pore size distributions. Two synthesis techniques used to obtain our ordered carbons are (1) nanocasting that uses a hard silicate template, and (2) soft templating, which uses organic-organic or organic-inorganic self-assembly processes.34–37
Diffusion Measurements
There are several electrochemical techniques for determining diffusion coefficient of Li ions inside a host material. The Galvanostatic Intermittent Titration Technique (GITT),38 electrochemical impedance spectroscopy (EIS), and potential intermittent titration (PITT) are some examples of such techniques.39 GITT is one of the most widely used diffusion analysis methods in the literature. Diffusion coefficients are calculated based on the voltage response during the current pulse and the equilibrium voltage change after the relaxation is complete. The diffusion constant calculated from the original GITT presentation was derived assuming that the diffusion process inside the electrode follows Fick's Law.38
Although the GITT process has been known for some time, it was designed to measure the diffusion constants during the current pulse and there is much less work on the voltage response during the relaxation. In this work we introduce a variation on the GITT technique based on an analysis of the voltage relaxation between current pulses. We refer to this as voltage-relaxation GITT or VR-GITT. This method uses the same experimental procedure as GITT, but employs a stretched exponential to analyze the relaxation data instead of the voltage response during the galvanostatic current. From the stretched exponential one obtains a time constant representing the time Li ions take to redistribute after each current pulse inside the electrode material, and a geometry-dependent parameter that distinguishes diffusive behavior in different local environments. The use of a stretched exponential to extract the time constant and hence diffusion coefficient has not been used with the GITT technique. Most importantly, materials with flat voltage plateaus can use VR-GITT to analyze the diffusion coefficient along the plateau, which we illustrate with a two-phase material later in this paper. Second, we have combined our VR-GITT electrochemical measurements with reverse Monte Carlo to infer the lithium distribution in the carbons as a function of composition. To our knowledge the use of Monte Carlo methods, combined with a variation of the GITT technique is new.
As a demonstration of the utility of the methods we have described, we show VR-GITT applied to the well-studied nanoparticle anatase TiO2 and demonstrate how it is able to give the diffusion constant as a function of Li concentration. We determine the diffusion constant as the LixTiO2 undergoes a phase transition. The results we obtain provide a powerful confirmation of the theoretical and other experimental work on anatase TiO2, in particular indicating very easily the transition from beta-TiO2 to the lithium titanate 1:1 phase.40–46 The use of the stretched exponential in fitting the voltage relaxation curves also gives very accurate open cell voltages as the asymptotic plateau of the exponential. This can be clearly seen in the extracted plateau voltages for TiO2 in the samples.
Below we present the diffusion dynamics of different types of carbons with different pore structures using GITT and VR-GITT. This allows us to understand the variations of diffusion coefficients in highly ordered mesoporous carbons by comparing the differences and similarities with each other. Our GITT diffusion results validate the new VR-GITT diffusion method.
The first part of the paper describes the VR-GITT technique in detail and is used to characterize the hard carbons we have synthesized. Diffusion coefficients are presented as a function of Li-concentration. The latter part of the paper describes the density profiles of lithium in the hard carbons as a function of Li-concentration determined using a reverse Monte Carlo technique.
Experimental
Four types of carbons were prepared according to the following synthesis procedures. Out of these four, two carbon types with 2D hexagonal structure (NPC-1, NPC-2) were prepared using soft template technique. NPC-1 was synthesized according to the referenced literature.34 In this preparation phenolic resins were used as the carbon precursor and triblock copolymer as soft template in the organic-organic self-assembly process. NPC-2 was prepared by the inorganic-organic-surfactant self-assembly method according to the literature.35 In this process tetraethyl orthosilicate (TEOS) was used to obtain higher surface areas and pore volumes. The third carbon type was composed of solid carbon rods (CMK3) which was prepared using the hard template method. CMK3 was prepared using sucrose as carbon source and SBA-15 as the hard template material.36 Finally, for comparison, to get a lower pore volume, the fourth type of carbon (GNPC) was prepared similar to NPC-1 synthesis process but, without triblock copolymer material.
Brunauer-Emmett-Teller (BET) method was used to calculate the surface area and Barrett- Joyner-Halenda (BJH) method was used to calculate the total pore volume. Pore size distributions from the adsorption branch were analyzed from both NLDFT models and BHJ method. Total pore volume was calculated by the amount adsorbed at a relative pressure of 0.99. These experiments were carried out using nitrogen adsorption isotherms at 77 K by Coulter SA3100 analyzer for the synthesized samples followed by outgassing process at 300°C for at least 1 hour. NPC-1, NPC-2 and CMK3 were analyzed by the 2D-nonlocal density functional theory (2D-NLDFT) Cylinder Heterogeneous Surface model using the SAIEUS program47 since these samples contain cylindrical nanopore channels in the P6m symmetry. The 2D heterogeneous surface model was used for the GNPC type. Next, particle sizes of these samples were analyzed by ImageJ48 software using Scanning Electron Microscopy (SEM) images. Finally, powder X-ray diffraction (XRD) measurements were performed with Cu Kα radiation source on a Rigaku Ultima IV multipurpose X-ray diffraction system.
Coin cell preparation
In this study two-electrode coin cells were used for the electrochemical analyses. All carbon materials and polyvinylidene fluoride (PVDF) (301F) were baked using custom built Sievert type apparatus at 300°C and at 110°C respectively overnight. The purpose was to remove moisture from the electrode materials. The whole assembly process was done inside an argon filled glove box with oxygen content below 1 ppm. Four different slurries were made using synthesized carbon samples as active material, PVDF as binder and N-methyl-2-pyrrolidone (NMP) as solvent. The ratio between active material and binder was 9:1. No carbon black was added in the process. Electrodes were prepared by coating thin layer of the slurry on a battery grade Cu foil. These electrodes were baked at 70°C for 10 minutes and then at 120°C for overnight inside the glove box. Coin cells were assembled with metallic lithium chip as reference/counter electrode and a carbon electrode as the working electrode. 1 M LiPF6 in a mixture of 1:1 ethylene carbonate (EC) and diethylene carbonate (DEC) was used as the electrolyte. Two layers of Celgard brand separators were sandwiched between Li metallic chip and working carbon electrode which was eventually sealed under pressure of 50 kg/cm2 using hydraulic crimping machine (MTI; MSK 110). All cells were rested for two hours to saturate before taking any measurements.
Electrochemical measurements
First, cells were cycled for 7 cycles between 0.00 V and 3.00 V vs Li/Li+ with constant current density of 30 mA/g using Maccor 4300 model to avoid effects of solid electrolyte interphase formation (SEI) for the diffusion measurements. Then all the cells were rested for one day and subsequently subjected to galvanostatic intermittent titration technique (GITT). This method is composed of constant current pluses followed by a relaxation period. In the experiment, 15 minutes current pulses with an approximately C/2 current and 4 hours of relaxation were used. The C value was calculated based on the cycling measurement results for each battery. More details can be found in the supporting information. The GITT process was continued until the carbon electrode reached a voltage of zero with respect to Li/Li+. Before the de-insertion current pulses began, the sample was allowed to soak at zero volts for 10 hours to ensure full insertion. De-insertion continued with current pulses of C/2 for 15 minutes and 4 hour relaxation period. All the voltage vs time measurements were recorded at room temperature using a Maccor model 4300 instrument.
Data fitting
Results and Discussion
Structural characterization of the carbons
According to the BET results in Figure 1a, all of the carbon types except GNPC exhibit a type IV isotherm based on the IUPAC classification.51 This indicates the presence of mesoporosity and microporosity in the samples resulting in large pore volume and surface area. GNPC has a type I isotherm, exhibiting very low surface area and a micro-porous nature in contrast to the other samples. GNPC was made with phenolic resins without polymer (F127), it therefore has no ordered morphology at the nanoscale, yet retains a disordered carbon structure.52 Figure 1b shows the pore size distribution of the samples from NLDFT models. NLDFT method provides a better understanding about the lower pore size regions (<2 nm) compared to the BJH method.53 Nonetheless, poor fitting in the micropore region caused higher standard deviations (Table S1) for CMK3 and NPC-1 compared to NPC-2. We use 2D Cylindrical model for CMK3 even though it has more slit like pores as evident from the reported H3 type hysteresis loop.36 This is probably the reason we obtain higher standard deviations for CMK3 carbon. Pore size distributions from the BJH method are also included in supplementary documents for comparison (Figure S2). All of the carbon types except GNPC contain micropores and mesopores according to the pore size distributions. Summary of N2 Physisorption results are given in Table I. The SEM images (Figure S3) show the particle size variation between different carbon samples. The particle size of the GNPC was assumed to be similar to NPC-1 since these samples were sieved through the same 74 μm size sieve. The largest particle size for the carbons CMK3, NPC-1, NPC-2, and GNPC are shown in Table I.
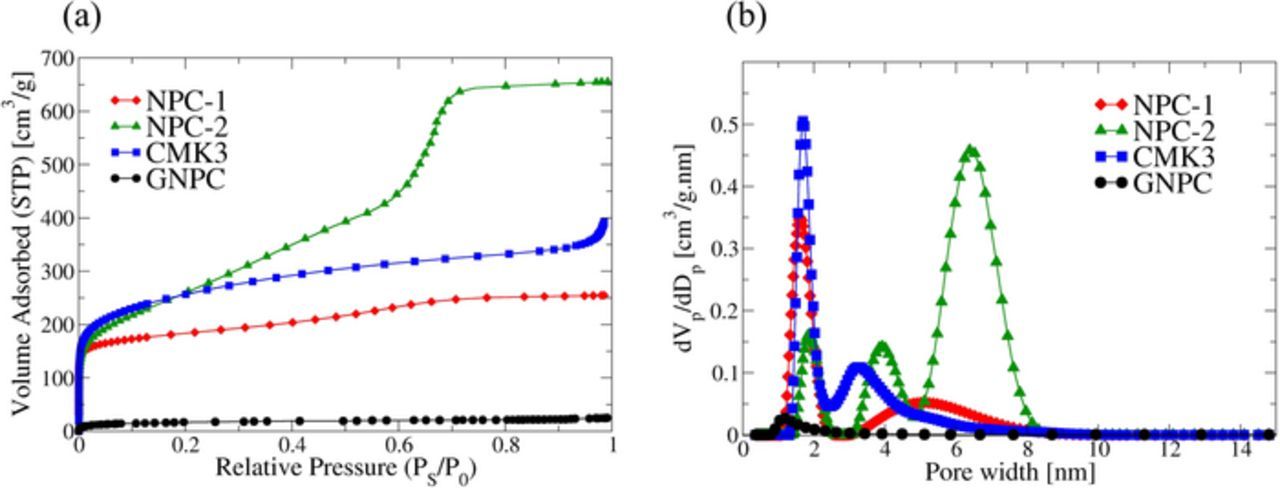
Figure 1. (a) Nitrogen adsorption isotherms for synthesized carbon samples at 77 K, and (b) Pore size distributions calculated from the adsorption branch. The highest surface area and pore volume are for NPC-2.
Table I. Characterization of carbon samples from Nitrogen Physisorption and X-ray measurements.
| Sample | Surface Areaa [m2/g] | Total Pore Volumed [cm2/g] | d Spacingc [m2/g] | Coherence Lengthd [nm] | Largest Particle Sizee [μm] |
|---|---|---|---|---|---|
| NPC-1 | 644 | 0.39 | 0.39 | 0.83 ± 0.01 | 121.13 |
| NPC-2 | 937 | 1.01 | 0.39 | 0.78 ± 0.01 | 144.00 |
| CMK3 | 905 | 0.60 | 0.38 | 0.78 ± 0.01 | 103.59 |
| GNPC | 60 | 0.04 | 0.39 | 0.88 ± 0.01 | 121.13 |
| Graphite | _ | _ | 0.336 | 45.3 ± 0.2 | _ |
aCalculated by the BET method. bEstimated by the amount adsorbed at a relative pressure of 0.99. c,dCalculated from the (002) Bragg peak and the Scherrer equation. eMeasured from the SEM images.
Figure 2 shows wide-angle XRD patterns for all the carbon samples. These XRD patterns have been used in Scherrer equations to calculate the (002) interlayer spacing and coherence length which are shown in Table I. The broad peaks corresponding to graphitic (002) and (100) at around 26° and 43° two theta, respectively, indicates no significant long-range order; the carbon network itself is glassy, with very small graphitic nanodomains. However, the GNPC structure shows higher intensity and somewhat narrow peaks with slightly lower d spacing and higher coherence lengths compared to the other carbon samples. This suggests that the GNPC structure may be slightly more graphitic on the nanoscale, compared to the other ordered carbons.
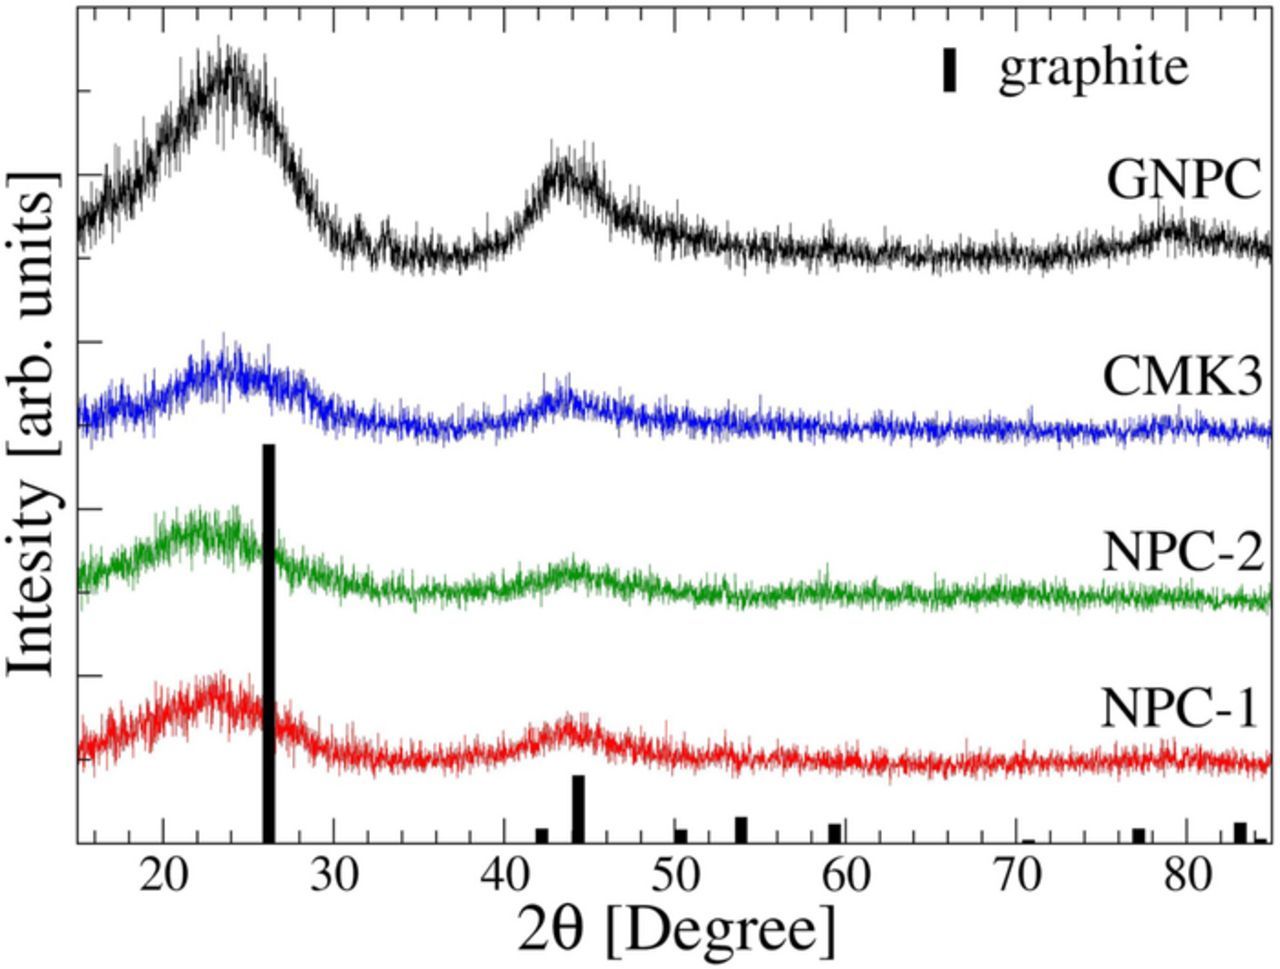
Figure 2. Powder XRD experimental results for carbon samples. Broad intensity around 26° and 43° suggest the amorphous nature of the carbon.
Voltage-relaxation GITT measurements
In addition to analyzing the voltage response during the current pulse, it is useful to examine the relaxation of the open cell voltage (OCV) following current pulses. The depolarization technique, developed for planar interfaces,54,55 can be used to analyze the OCV relaxation curve in order to get diffusion coefficients in thick electrode pellets. In the depolarization method, the diffusion coefficient is calculated from the gradient obtained from a plot of the logarithm of [OCV(t) - OCV(t = ∞)] vs time. In contrast we employ a stretched exponential to analyze the relaxation curves and refer to our approach as voltage relaxation (VR-GITT), and we calculate diffusion constants assuming a spherical particle geometry. It is important to note that during the diffusive relaxation process the dominant contribution comes from the largest particles in the material. SEM indicates these sizes are in the micron range.
It is known that the stretched exponential is more appropriate to model relaxation and decay processes than the standard exponential function.56–58 Prominent examples include polymer dynamics, and diffusive processes such as rehydration. The above mentioned different systems can be explained with stretched exponential function, exp ⌊ − (t − t0/τ)α⌋, having either fixed or variable alpha (α) between zero and one and tau (τ) larger than zero depending on the system.56 In diffusive processes the α parameter is shape-related and is important behavior to understand in our material where the pores and channels are ordered. Marabi et al. has shown that the stretched exponential shape factor α can have distinct values depending on the geometry and the mechanism of water uptake such as 0.67, 0.72 0.81 for spheres, cylinders and slabs respectively when considering rehydration.59
A simple stretched exponential for a typical voltage relaxation in our electrochemical data is captured by the expression in Eq. 1
![Equation ([1])](https://content.cld.iop.org/journals/1945-7111/165/11/A2824/revision1/d0001.gif)
Where, Vmax is the relaxed open cell voltage obtained from the fitting, Vmin is the minimum voltage of the recovery curve, (t−t0) is the relaxation time (difference between initial and final relaxation time), τ is the time constant, and α is the shape-related factor. Fitting of the stretched exponential to a typical VR curve is shown in Figure S4. The diffusion constants following every current pulse were calculated using
![Equation ([2])](https://content.cld.iop.org/journals/1945-7111/165/11/A2824/revision1/d0002.gif)
where L is the radius of the largest particle. To validate the diffusion constants calculated from our extracted time constants, diffusion coefficients were also calculated based on the standard GITT equation which is based on a one-dimensional diffusion process:60
![Equation ([3])](https://content.cld.iop.org/journals/1945-7111/165/11/A2824/revision1/d0003.gif)
Here r is the radius of the particle, t is the duration of the current pulse, ΔEs is the change in equilibrium voltage during the current pulse, ΔEt is the total transient voltage change after the IR drop. This equation holds when t ≪ (r2/D). The voltages of the experimental GITT curves are shown in Figure S5. The VR-GITT data show that NPC-1 has the lowest recovery voltage and fastest relaxation process. This suggests that NPC-1 may not have as deep trap sites discussed in Mochida et al. as compared to CMK3 and NPC-2.12 A possible explanation may be the following. When some portion of Li ions intercalate into deep trap sites on the first insertion they will have diffusion barrier activation energies larger than the other intercalated Li ions during the voltage recovery. Therefore, the recovery voltages may provide some information about the trap sites. Li resident in a deep trap site will increase the diffusion rate for diffusing Li that cannot enter the site. A competing mechanism, however involves the blocking of a diffusive path by the resident Li. These competing effects may be difficult to determine from the VR-GITT data.
We note one drawback of the standard GITT technique is the ΔEs term in the numerator of Equation 3 which represents the change in equilibrium voltage of the material upon, e.g. insertion of Li. In a two-phase region where the equilibrium voltage does not change ΔEs would be zero, the diffusion constant may not be calculated in this manner. See for example Zhu and Wang.61 However, if one uses the voltage relaxation curve and extracts the time constant, a calculation of the diffusion constant is possible with knowledge of the relevant length scale for the diffusion. As it is sometimes difficult to measure diffusion constants, especially over a large concentration region, the VR-GITT technique provides one more characterization tool. For these purposes, and also to provide a more well-studied standard for our analysis that follows, we show the VR-GITT technique applied to nanoparticle anatase TiO2. This material has been investigated for lithium-ion anodes and its nanoparticle phase diagram is understood as a function of Li concentration.40–46 We present diffusion measurement results across the entire two-phase region of anatase TiO2 + beta Li titanate during Li insertion and de-insertion. The VR-GITT results for anatase TiO2 demonstrate the ease of use and power of the method.
In the Li-Ti-O system there are three phases of relevance for lithium-ion battery applications: (1) alpha-phase anatase with stoichiometry LiδTiO2, (2) beta lithium titanate, Li0.5Ti1O2, and (3) gamma phase Li1Ti1O2. These phases and the nanoparticle phase diagram have been investigated previously.40–46 (The preparation of our nanoparticle anatase TiO2 is described in the supplementary.)
The VR-GITT results for 35 nm anatase TiO2 is shown in Figure 3. Figure 3a shows the fitted final voltages from the stretched exponential yielding the plateau voltage. First, it is clear that there is a plateau region for the 35 nm particles. Insertion of lithium into anatase TiO2 proceeds via a two-phase region corresponding to the transformation of alpha-TiO2 to the beta lithium titanate phase. The length of the plateau becomes shorter with smaller particle size (See the supplementary Figure S6 for 11 nm particle size), in agreement with the reported nanoparticle phase diagram in the literature.40 The drop in potential near full insertion corresponds to the formation of the gamma phase with 1:1 ratio of Li:Ti. The ionic conductivity in this phase is lower, and there is a corresponding change in the extracted VR-GITT parameters.
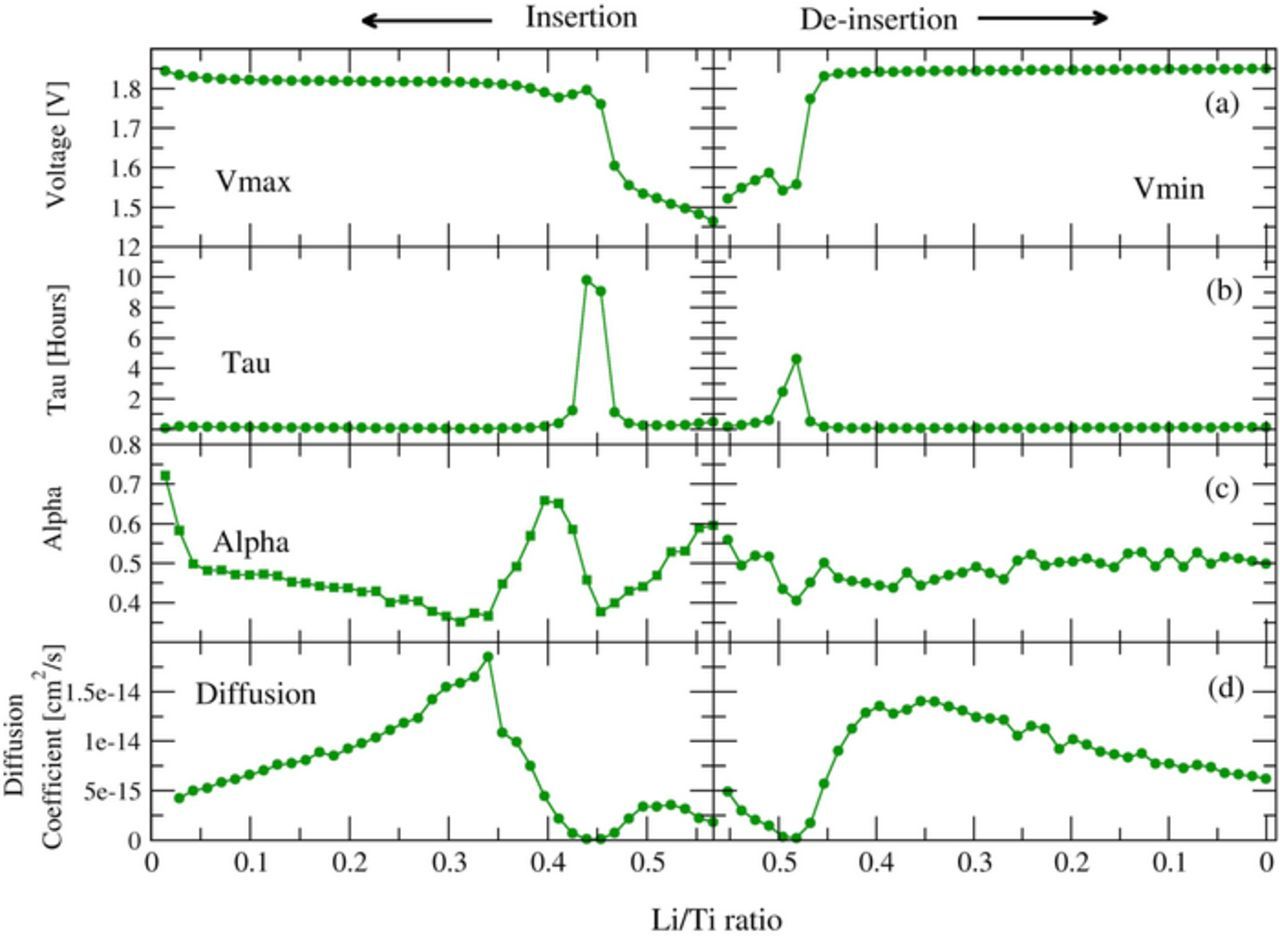
Figure 3. (a) VR-GITT fitted voltages, (b) Extracted time constants (τ), (c) Stretched exponential shape parameters (α), and (d) Diffusion coefficients form VR-GITT method for 35 nm nanoparticle anatase TiO2.
The extracted tau parameters and corresponding diffusion coefficients are shown in Figures 3b, and 3d. Most interestingly, small changes in the extracted tau parameter indicate a diffusion coefficient that increases as the concentration of lithium increases during the phase transition from alpha to beta. The reason that the diffusion coefficient of Li+ increases is the following.42 Density functional theory calculations show that at low lithium concentration in anatase TiO2 there is strong localization of the electron e− from the intercalated Li to a 3d state of the closest Ti center, forming a bound polaronic state of the Li+ to the Ti center. This binding is roughly 56 meV. As the lithium concentration increases in the anatase TiO2 and these gap states begin to fill and form a delocalized band, the binding of Li+ to these states falls, manifesting as a higher diffusion rate of Li+. VR-GITT measurements of lithium intercalation into anatase TiO2 illustrate the above explanation in detail. Further, Figure 3c shows the extracted shape parameters from the VR-GITT fits and indicate that the diffusion proceeds largely with the same character (spherical) except at the point where the formation of the gamma Li1Ti1 phase appears. There the alpha parameter increases noticeably.
Lithium diffusion in hard carbons
Figure 4 contains the extracted time constants and α parameters vs Li concentration using Equation 1 for different carbon samples. Voltages that relax sharply at the beginning of the relaxation are given by smaller values of α. The extracted α values generally lie between 0.2–0.5. As evident in Figure 4a the α shape parameter clearly distinguishes carbons synthesized with and without silicate in the preparation process. The shape parameter data fall into two distinct groups. A strong variation of α for carbons NPC-1 and GNPC without silicate and a non-varying α for carbons NPC-2 and CMK3 prepared with silicate. The time constants are generally increasing and shown in Figure 4b, with the exception of the one non-porous carbon GNPC, which shows a rapid drop in τ. The low capacity in these measurements is due to large current density used during the VR-GITT pulse.
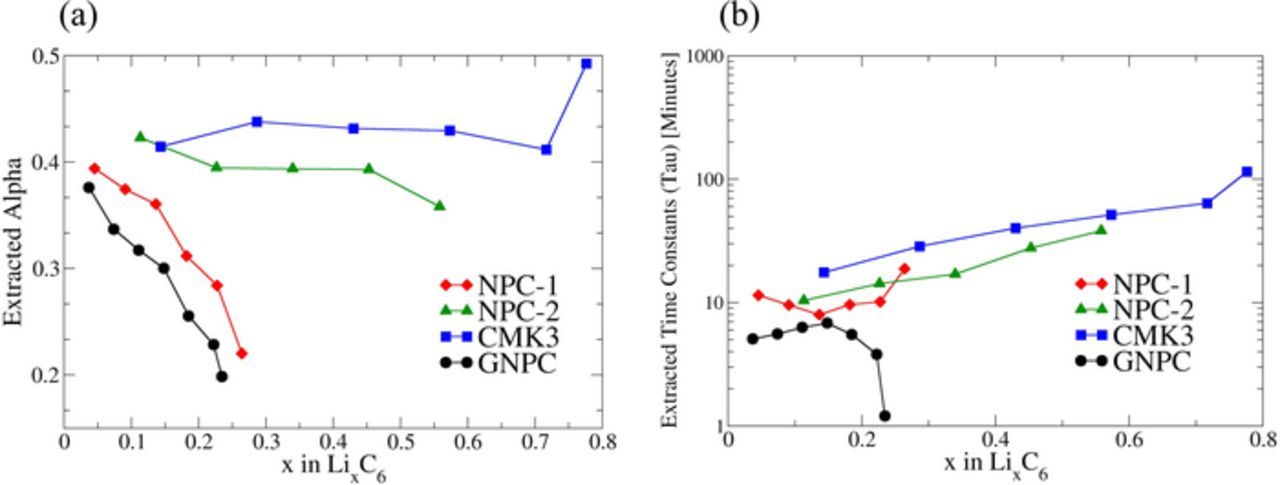
Figure 4. (a) Extracted Alpha (α) values as a function of Li concentrations, and (b) Extracted time constants (τ) as a function of Li concentrations for carbon samples. Tau and Alpha were obtained by VR-GITT analysis method.
Figure 5 shows the diffusion coefficients for carbon samples from both the VR-GITT time constant (Equation 2) and the standard GITT (Equation 3). These results show very good agreement with each other. All the obtained diffusion coefficients from VR-GITT and GITT are in the range of 10−7 and 10−9 cm2s. This shows an agreement with the range of reported diffusion coefficients for carbonaceous materials.39,62–64 However, due to the lack of the Li diffusion measurements for the exact materials discussed in this study, we cannot compare the values directly.
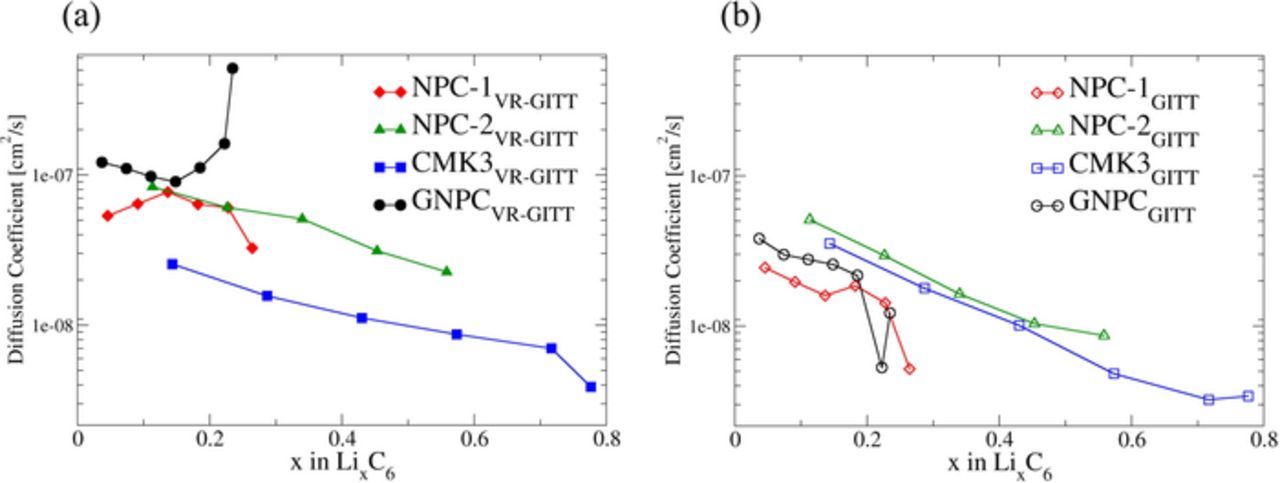
Figure 5. Diffusion results from (a) VR-GITT method (closed symbols), and (b) GITT method (open symbols). The maximum difference between two methods with in order of one magnitude for all the other materials except for GNPC.
GNPC shows the highest diffusion coefficients. This may be due to more graphitic nature of the GNPC sample. Persson et al. have shown that Li diffusion values in highly oriented pyrolytic graphite (HOPG) in the direction parallel to graphene layers is about ∼10−7–10−6 cm2s−1 whereas the diffusion along the grain boundaries is about ∼10−11 cm2s−1 through computational calculations.65 This suggests if our GNPC has more graphitic nano-domains it should have a higher diffusion coefficient.
Computational modeling of the lithium density profile
Li plating is a well-known phenomenon which occurs specially under low temperatures, high current pulse and high State of Charge (SOC). There have been several studies reported in literature about the investigation of Li deposition inside electrode material under different conditions. One common finding is that uneven Li plating leads to form dendrites and may even pierces the separator causing internal short circuit of the battery.66–72 Li plating inside the electrode material without leading to dendritic growth depending on the morphology of the electrode material is also found to be possible. This phenomenon can lead to very high reversible capacities for the materials. In these cases, formation of metallic Li occurs inside the interior of the pores or in the cavities/defect sites of the material and it will not lead to form destructive dendrites on the electrode surface.73–76
The lithium capacities in excess of LiC6 in the cycling data strongly suggest that lithium must be plating inside the pores of the carbon. Interestingly, NPC-2 type carbon with very high specific area and pore volume can give reversible capacities above 1000 mAh/g which is more than two times of the standard graphite capacity (Figure S7). One hypothesis is that the lithium plates during the relatively high current pulse on insertion in the GITT measurement, and then diffuses through the carbon slowly. If this is the case, we expect a non-uniform distribution of lithium in the carbon particles during insertion. After full insertion and during the de-insertion VR-GITT measurements, we expect that this non-uniformity will be smaller.
In order to investigate the distribution profile of lithium in the carbon particles we employed computational modeling of the diffusion process during the voltage relaxation on each insertion and de-insertion. We extracted density profiles numerically by integrating the diffusion equation and using Monte Carlo methods to determine the lithium density profile following every VR-GITT current pulse. The details are as follows.
The outer edge of the particle that is in contact with the electrolyte is the surface that provides the measured voltage response. Our objective was to use this voltage response to calculate the concentration profile of lithium in the particles immediately following the current pulse in the VR-GITT experiments. We deduced the initial lithium profile by assuming lithium was incorporated into the (mostly surface region) of the carbon particles during the (short) current pulse, and that this high-concentration diffused into the carbon particles over the relaxation period of the measurement (Figure S8). The resulting voltage response is given by the concentration of the lithium on the outer edge of the particle (Figure S9). In order to make the computations tractable we assumed spherical particles. To obtain the time evolution of the lithium concentration we used a standard Crank-Nicolson integration routine with Dufort-Frankel near r = 0. Our computations allowed for a diffusion constant that varied as a function of distance from the center of the particle, D(r). This assumption allows for the difference in diffusion rates along the pore channels and/or through the carbon matrix itself. The simplification that D is only a function of r and not a complicated function of the carbon pore morphology is a reasonable one on based on the length scale ratio of the pore size (10−9 m range) to the particle size (10−6 m range). The carbon particles are not monolithic ordered structures, but are comprised of small domains of ordered pores. The size of the domains is much smaller than the micrometer size of the largest carbon particles.
For each voltage response curve, collected during the VR-GITT measurement, we determined the initial lithium density profile in the particle using standard Monte Carlo simulated annealing (MCSA) to fit the experimental voltage response. The cost function was therefore the difference between the experimental voltage relaxation and the computed voltage response, given an initial density profile. An example MCSA computation is shown in Figure S10. For all computations the integrated density was normalized to unity and the resulting density profiles f(r), and diffusion constant profiles D(r) are dimensionless.
Monte Carlo details
We used N = 20 spherically concentric shells or bins in a particle for the simulations. In each shell the density and diffusion constant profiles were allowed to vary according to three different configuration changes, (i) scaling of the overall profile, f→ (1 +/− δ)*f (ii) increase or decrease of profile, f→ (f +/− δ), (iii) increase or decrease profile of single bin, fi → (fi +/− δ). An exponential annealing schedule was used with T(n) = exp (−n/n0), with n0 = 2, and a total of 10 temperature steps. The number of configuration changes for each temperature was Nc = 103. The value of δ for each of the configuration changes was chosen so that rejection percentages were in the range of 65% to 75%.
The relaxation curve at each VR-GITT data point represents the diffusion of lithium in the particles at either an increasing or decreasing total Li concentration if the measurement was taken as an insertion or de-insertion. The initial lithium density profiles f(r), are plotted as a function of the cycle number and the particle radius in Figure 6. Peaks appearing along the density profiles f(r) vs radius graph denote high Li concentration positions in the particle. In our model we consider outer surface as the surface where electrolyte makes contact with the carbon particle. This includes both the outer edge of the particle and the inner surface of the nanopore channel. High Li concentration points appearing along the radius of the particle should be due to agglomerations/plating of Li inside the nanopore channels. In previous studies Li plating in defects and cavities have been observed for graphene and mesopore carbons.74,75 Moreover, intercalation of plated Li into graphite during relaxation period have been reported.77 Uhlmann et al. have reported that the shape of the voltage curve during charging and during relaxation for graphite in the presence of plating. However, we have no two-phase region and we did not observe any voltage plateau in voltage relaxation curves for our amorphous hard carbon materials.77
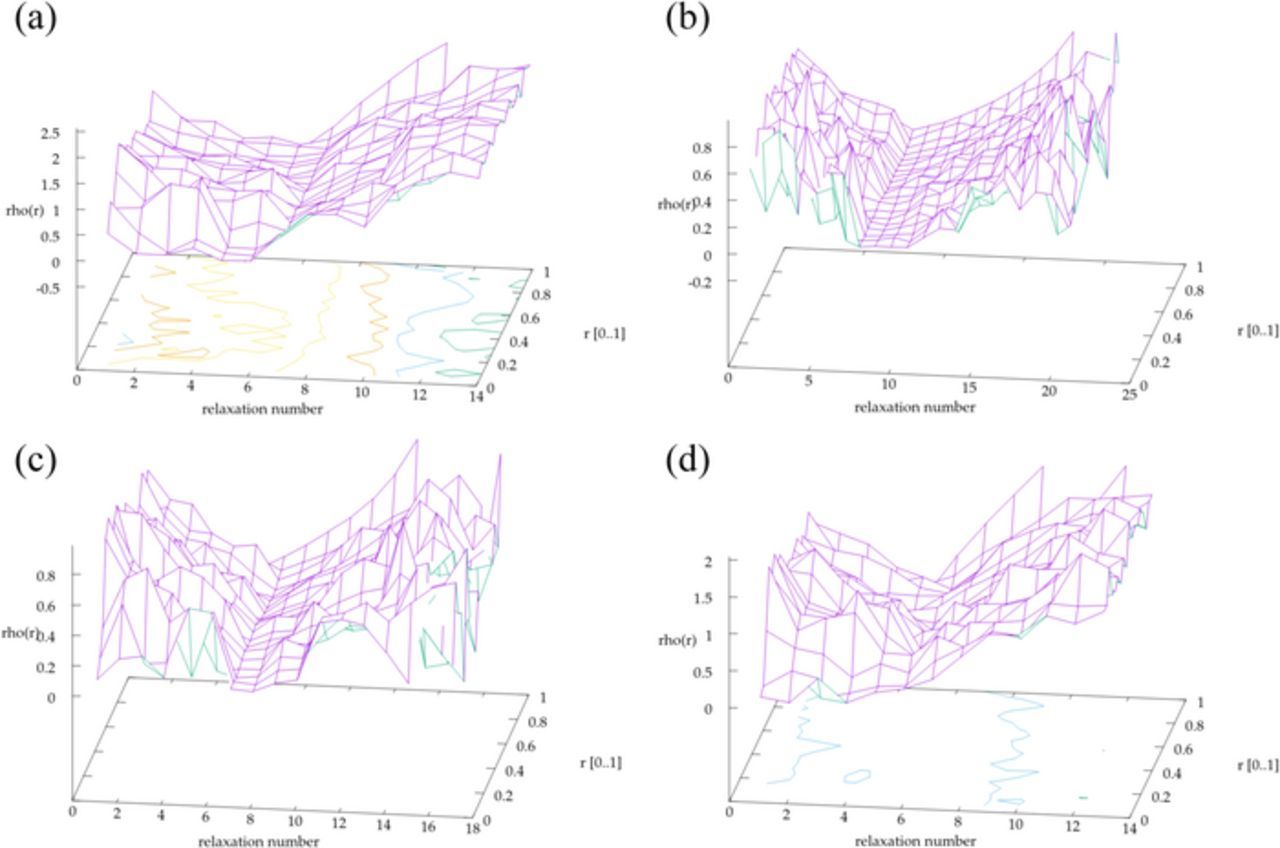
Figure 6. Lithium density profiles computed from the voltage relaxation curves for each carbon sample during both insertion and de-insertion. The valleys appear near full insertion. (a) CMK3, (b) GNPC, (c) NPC-1, and (d) NPC-2.
There are no reports in the literature of direct observation of Li plating or intercalation of plated Li for our carbons. However, plating and intercalation occur in graphite and graphene support the possibility of a similar phenomenon happening inside the amorphous carbons used in this paper. According to BET analysis our carbon samples have hexagonal nanopore structures. These pore channels are not perfectly smooth and have cavities and sharp protrusions along the pore channels. So, during high current pulse, it is likely that Li may plate in these areas and diffuse into the particle during the relaxation.
The results of the MCSA computations are revealing. First, we note that the variation of the inferred diffusion coefficients was small (within a factor of 5) across the VR-GITT measurement of a sample and a varying diffusion constant was not necessary to obtain the density profiles. Second, the density profile becomes flat as the concentration of lithium reaches its maximum value and returns to a more featured landscape upon de-insertion (Figure 6). A flat voltage profile indicates evenly distributed Li inside the pores. The zero voltage soaking step following the VR-GITT insertion pulses evidently increases the Li concentration and smooths its density profile. After the voltage soaking period, the density profiles stay flat until few de-insertion current pulses for GNPC and NPC-1. This may suggest that a higher amount of Li plating occurs in these samples compared to NPC-2 and CMK3. This is in contrast to a well-studied material such as anatase TiO2 nanoparticles. An example of the VR-GITT applied to this material shows a very flat landscape of lithium concentration profile across insertion and de-insertion and only an increase in the density right at the edge of the particle upon full insertion (Figure S11).
To support our density profile analysis, we quantified the degree of fluctuation in the density plots. The results indicate that the computed lithium profiles of the carbon samples are significantly more non-uniform than the standard provided by the TiO2 anatase nanoparticles. Figure 7 shows the standard deviation for the calculated density profiles at each step of the VR-GITT process, i.e., the fluctuations in the profile from r = 0 to r = 1, for each relaxation curve that was fitted using MCSA. The similarity between the samples prepared with silicate (CMK3, NPC-2) or without (NPC-1, GNPC) is again very apparent in the de-insertion standard deviations. A direct comparison of the carbon data with the standard TiO2 is not possible because of the difference in particle size and due to the differences in the experimental procedure. In our TiO2 experimental procedure, no soaking step was involved between insertion and de-insertion. However, the time scale for relaxation of all of the samples is of the order required by the approximate known diffusion constants for carbon and TiO2, and so the standard deviation profiles do provide some indication of the initial lithium density profiles inside the particles.
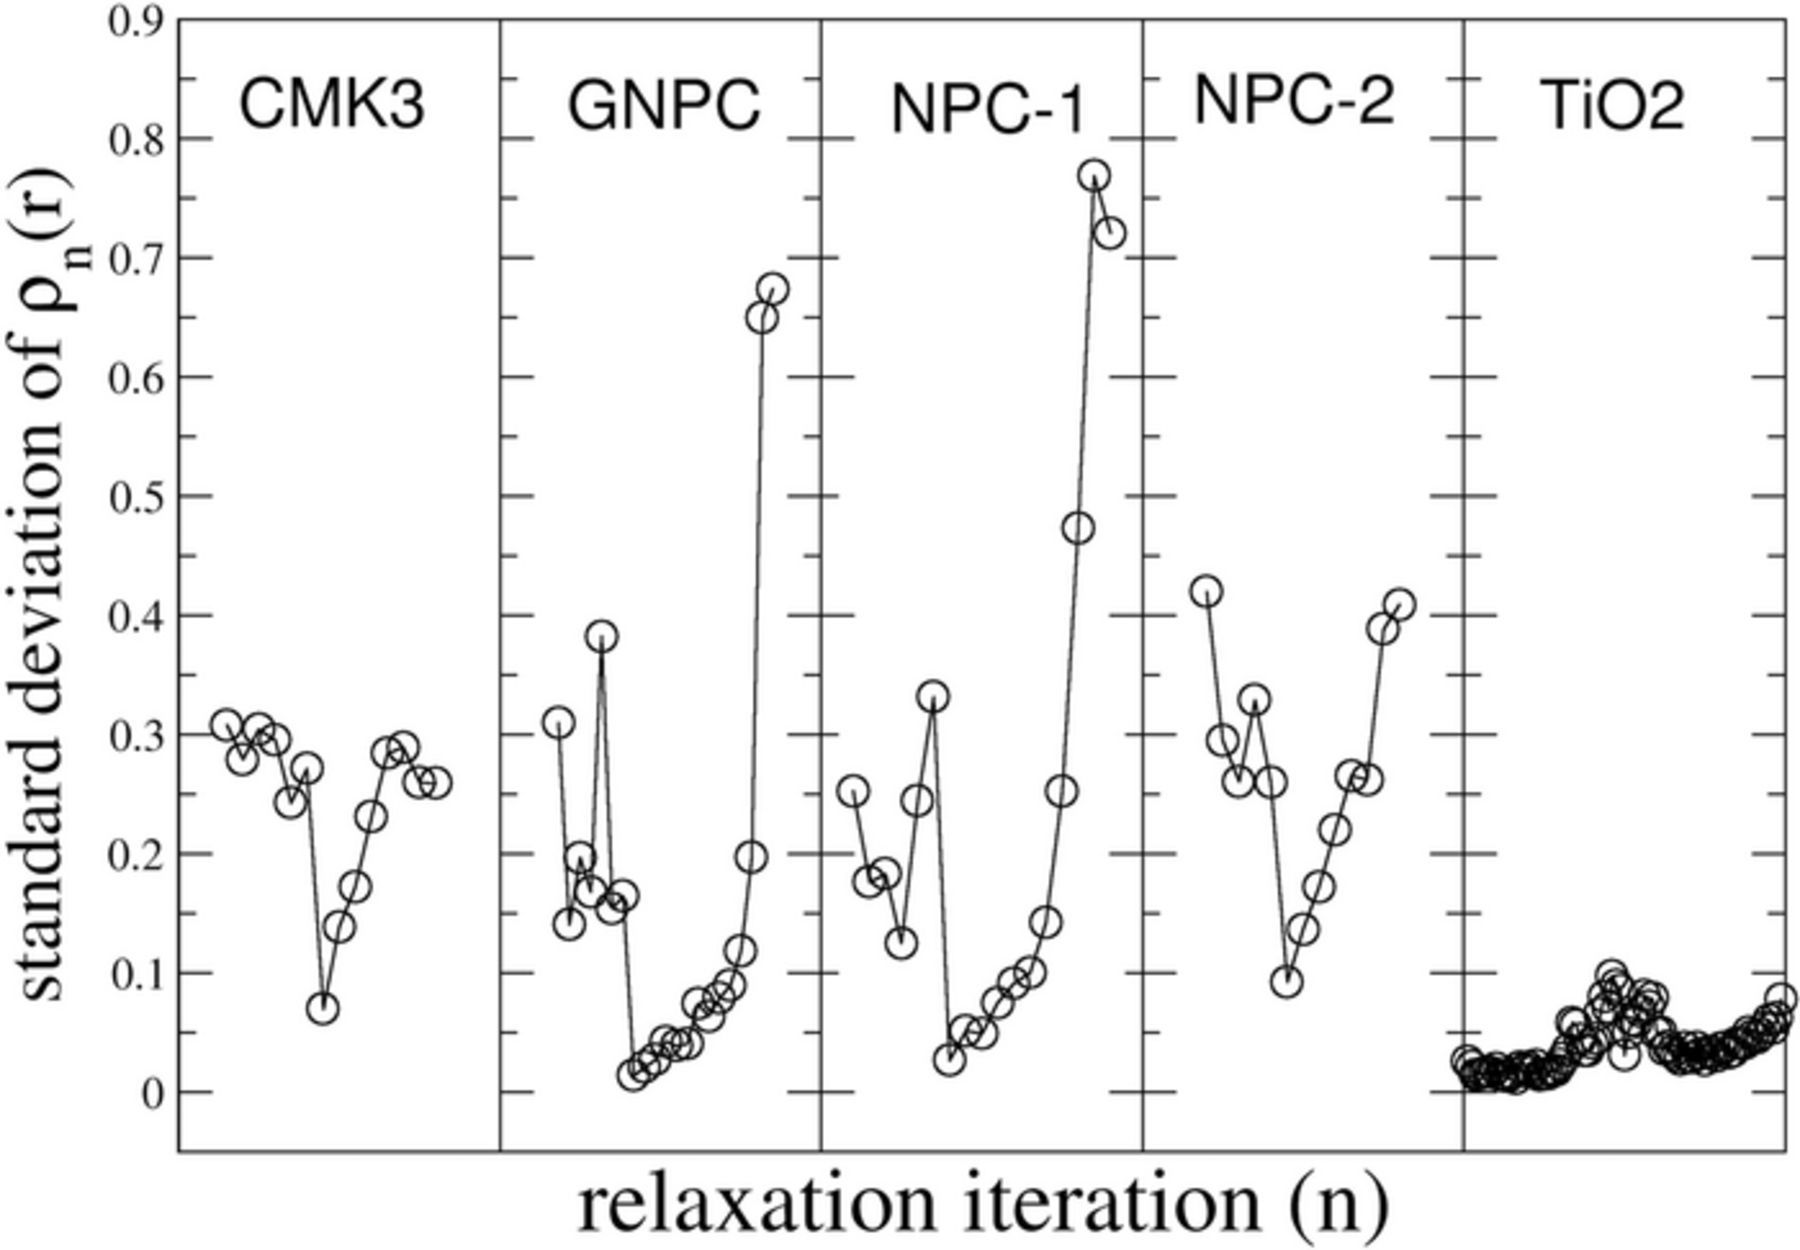
Figure 7. Standard deviations of the voltage profile for each voltage relaxation curve for both insertion (first data points) and de-insertion. The standard deviation is lowest for fully inserted samples of carbon. The TiO2 standard shows relatively much lower fluctuation of the lithium density in the particles.
Our results show that the density profiles in the carbons become more uniform (smaller standard deviation) as the Li concentration increases and the most uniform following the zero voltage soaking step. This indicates that the Li is most evenly distributed at full insertion. A calculation of the pore volume of the materials and the Li concentration from the VR-GITT measurements shown in the SI indicate that if plating occurs in the pores, it fills no more than about 10–20% of the pore volume. Interestingly for the GNPC-type carbon, which has the lowest pore volume, this number is calculated to be around 100%. This suggests that if plating initiates on the 'sharp' edges of the pore walls during a high current pulse, it may evenly distribute itself over the surface of the pore wall and/or intercalate over time.
Conclusions
The lithium ion diffusion in ordered amorphous hard carbons was investigated using the voltage relaxation data from standard GITT measurements. Our results indicate that both GITT and VR-GITT diffusion constant results are generally in agreement with each other. All carbon diffusion coefficients investigated in this study were in the range of 10−7 and 10−9 cm2s from both methods. Moreover, our results show that the newly developed VR-GITT method is also helpful in distinguishing differences between carbon samples. Particularly, carbon samples made with and without silicate can be clearly identified from the α parameter obtained by VR-GITT. The fact that our method can distinguish between different carbon preparation techniques means it is able to distinguish microstructural features of the carbon. The methods here may be used to characterize new electrochemical materials in addition to carbons. For example, the alpha parameter may be extracted for a variety of anode and cathode candidates over a range of Li concentrations that may be very specific to the preparation method of the material.
In addition to the newly developed VR-GITT method, this paper presents a new approach to investigate the inside of electrode by calculating Li density profiles. Initial Li density profiles derived from the voltage relaxation data provide information about the Li distribution inside the particle just after the current pulse. According to our results, we observed non-uniform Li distributions inside the carbon particles. We believe this non-uniformity is due to Li plating during the high current pulse. We were also able to show that higher amount of Li plating occurs in the non-silica based carbon samples. Our results suggest that mitigating the plating problem in high-current charging environments may be possible with engineered nanoporous electrodes where plating may be directed to occur inside a pore structure with a small free pore volume.
Finally, our results show that the VR-GITT technique is a simple method for investigating diffusion in the two-phase region of materials where there is a flat voltage profile that makes the standard GITT unreliable.
Acknowledgments
The authors thank David Osborn for assistance in the XRD measurements and obtaining SEM images. This work was partially supported by funds from the Research Board Award from the University of Missouri. The authors gratefully acknowledge research support from the Hydrogen Materials Advanced Research Consortium (HyMARC), established as part of the Energy Materials Network under the U.S. Department of Energy, Office of Energy Efficiency and Renewable Energy, Fuel Cell Technologies Office, under Award Number DOE – EE0007656.
ORCID
Waruni Jayawardana 0000-0002-3258-3277
Eric H. Majzoub 0000-0002-7091-0638