Abstract
Novel carbon fiber microelectrode (CFME) and flow cell experiments were used to investigate electrode treatments for vanadium flow batteries (VFBs). Linear sweep voltammetry (LSV) and electrochemical impedance spectroscopy (EIS) on CFMEs showed that electrode treatments at positive potentials enhance the kinetics of V2+/V3+ and inhibit the kinetics of VO2+/VO2+, while electrode treatments at negative potentials inhibit the kinetics of V2+/V3+ and enhance the kinetics of VO2+/VO2+. XPS analysis showed changes in oxygen-containing species on electrode surfaces after treatment, supporting the suggestion that such species are responsible for the observed effects. The kinetics of VO2+/VO2+ are significantly faster than that of V2+/V3+. Based on the CFME results, the range of potential experienced by a negative electrode in a flow cell during operation corresponds to a region where it is being deactivated by reduction, and the redox potential of the positive half-cell falls in a region where the electrode is activated for the V2+/V3+ reaction. This is supported by flow cell experiments which showed that the overpotential at the negative electrode increases with charge-discharge cycling but decreases significantly when the positive and negative electrolytes are interchanged. Periodic electrolyte interchange and other in-situ electrochemical treatments of electrodes may be a practical means of improving voltage efficiency in VFBs.
Export citation and abstract BibTeX RIS

This is an open access article distributed under the terms of the Creative Commons Attribution Non-Commercial No Derivatives 4.0 License (CC BY-NC-ND, http://creativecommons.org/licenses/by-nc-nd/4.0/), which permits non-commercial reuse, distribution, and reproduction in any medium, provided the original work is not changed in any way and is properly cited. For permission for commercial reuse, please email: oa@electrochem.org.
The all-vanadium flow battery (VFB) has received attention as a load leveling technology for large-scale energy storage.1–4 This technology is capable of interfacing with renewable energy sources and provides an alternative solution to balancing power consumption and generation. Despite the advantages, VFBs have not yet been widely commercialized. Significant improvements are needed to enhance flow battery systems. Limitations include ion transport through the membrane, mass transport resistances within the electrodes, and electrode reaction kinetics.5
Recently, attention has been directed toward improvement of electrochemical properties of carbon based electrode materials. Modifications via thermal treatments, chemical oxidation, or electrochemical oxidation are thought to enhance electrochemical activity.6–12 The presence of oxygen containing functional groups has been shown to directly affect the kinetics; surface oxides resulting from the aforementioned treatments are thought to act as active sites, catalyzing the vanadium reactions.13 Some researchers have reported an increase6–12 while others reported a decrease14 in activity upon functionalization of carbon electrodes. Many of these studies have been conducted using glassy carbon,15,16 graphite,17 carbon paper,18 multi-walled carbon nanotubes,19 or carbon composites.20 One group concluded that the kinetics for the VO2+/VO2+ reaction are faster than the V2+/V3+ reaction at a plastic formed carbon electrode, but found the opposite when using pyrolytic graphite.21 Previously, we reported that electrochemical oxidation treatments enhanced the V2+/V3+ reaction kinetics, whereas electrochemical reduction treatments enhanced the VO2+/VO2+ reaction kinetics.22,23 This was demonstrated using a range of carbon materials including glassy carbon, carbon paper, carbon xerogel, and carbon fiber electrodes.
It is apparent that kinetics are dependent on the nature of the electrode surface; thus, it is important to investigate factors affecting kinetics at electrode materials used in practical redox flow batteries.13,24 Investigations have been carried out using porous electrodes, such as carbon felt25 or carbon paper.18 However, due to the 3-dimensional structure of these electrodes, complex current distributions and electrolyte access make kinetic analysis difficult. For this study, novel microelectrodes fabricated using single carbon fibers extracted from bulk carbon felt were used to characterize electrode kinetics of vanadium redox couples in order to study application-relevant electrode surfaces. Flow battery experiments were then performed to demonstrate the effectiveness of the kinetic enhancements caused by electrochemical treatments of the electrode surfaces.
Experimental
Carbon fiber microelectrodes (CFME) were prepared from carbon felts (GrafTech). Single fibers (15 ± 3 μm diameter determined from SEM micrographs) were extracted from the bulk felt at random and electrical contact was made to copper wires on either end of the fiber using silver ink (EPO-TEK H20S). The copper wires were placed inside a glass capillary and sealed along with the junctions, which include both ends of the fiber, using non-conductive epoxy (Loctite E-05MR Hysol) so that only the fiber was exposed to solution (refer to Fig. 1). All CFMEs used in this study were fabricated from the same batch of carbon felt. Before use, electrodes were preconditioned as discussed later. In addition, to minimize any effects of electrode history, electrodes were also subjected to a normalization treatment22,23 between experiments, consisting of three cycles, each of 60 s at −2.0 V and 60 s at +1.5 V.
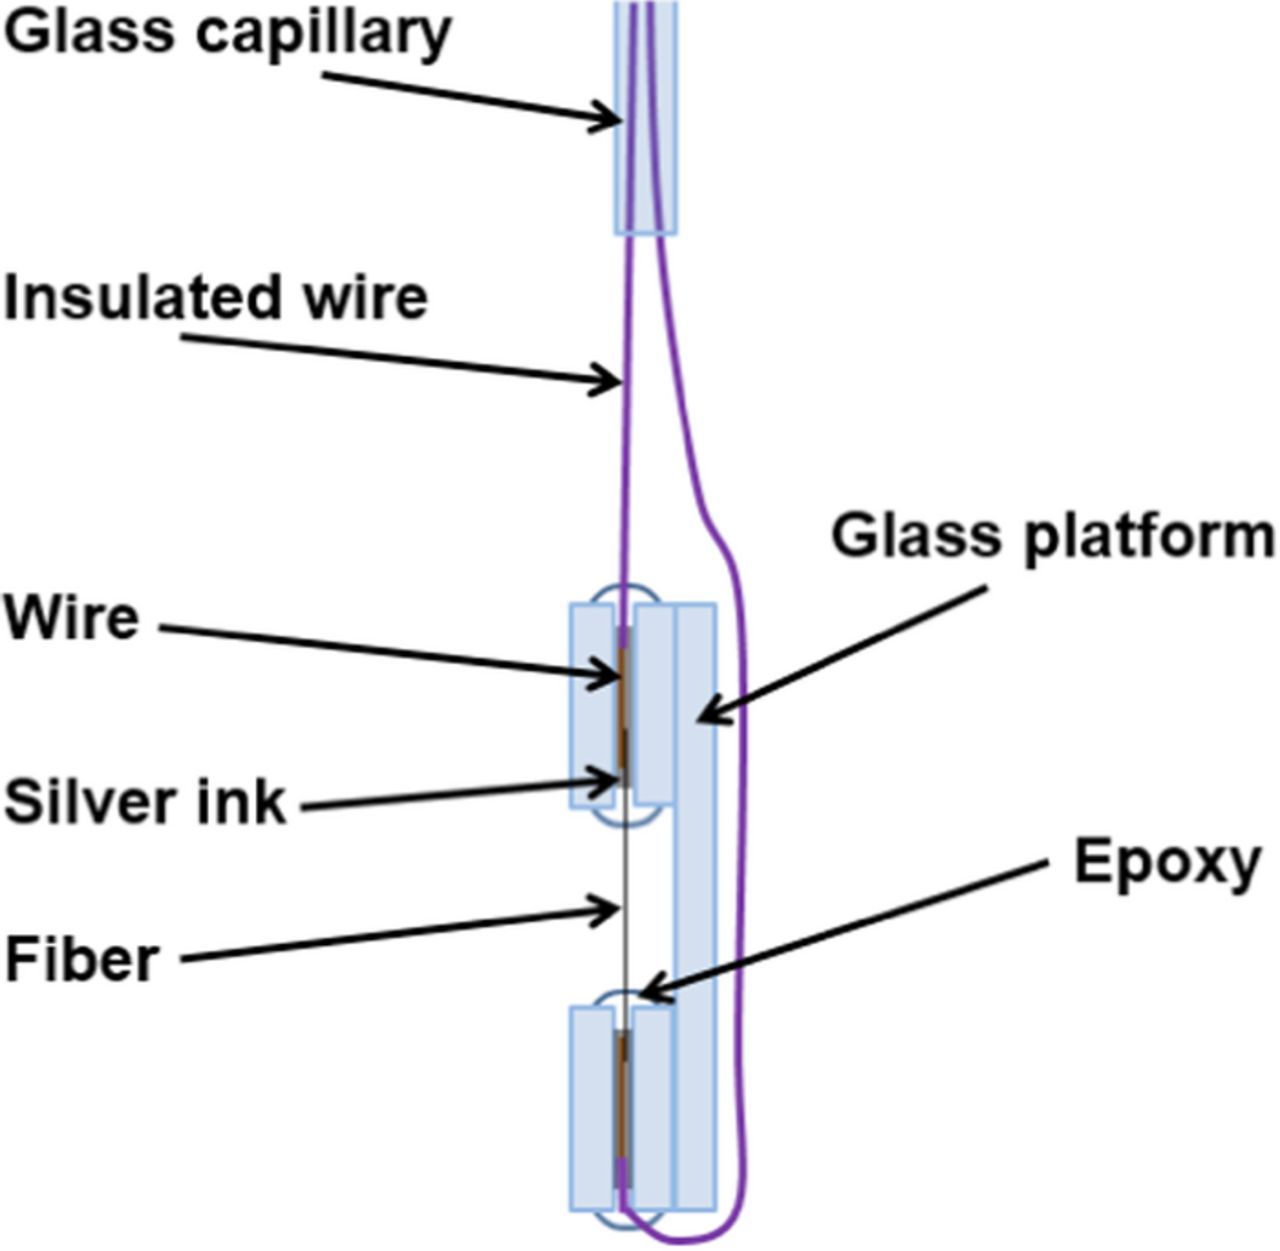
Figure 1. Schematic of carbon fiber microelectrode (CFME).
Linear sweep voltammetry (LSV) and electrochemical impedance spectroscopy (EIS) experiments on CFMEs and electrochemical treatments of felt for surface analysis by X-ray photoelectron spectroscopy (XPS) were performed in a standard three-electrode cell with a potentiostat/galvanostat (Solartron SI 1287) and an impedance phase analyzer (Solartron SI 1260). The cell had a platinum counter electrode and saturated Hg/Hg2SO4 reference (mercury/mercurous sulfate electrode, MSE) inside a Luggin capillary. This reference was used in the three electrode cell to eliminate possible contamination due to chloride ions, which becomes important when the electrode geometry is miniaturized.26 The electrolyte was thermostatted at 25°C and deaerated by purging with nitrogen for 20 minutes; a nitrogen blanket was maintained over the electrolyte during experiments.
Rate constants using LSV (at 5 mV s−1) were estimated from the linear region (±20 mV overpotential). Electrochemical impedance spectroscopy was performed between 200 kHz and 0.2 Hz and at the open circuit potentials with an AC potential of ± 10 mV. Zplot software was used to model and fit impedance data; the Randle's equivalent circuit was used to determine the diameter of the charge transfer loop.
For XPS experiments, "test strip" electrodes were constructed using 5 mm × 5 mm felt samples bonded with carbon ink (Acheson) to long Grafoil strips (UCAR carbon Co.). The back and edges of the Grafoil strips were electrically insulated using non-conductive epoxy so that only the carbon felt was exposed to the solution. XPS analysis was carried out using a PHI Versaprobe 5000 Scanning X-Ray Photoelectron Spectrometer. Scanning electron microscopy (SEM) imaging was carried out using a Hitachi S4800 SEM.
The cell used for flow battery experiments is shown schematically in Fig. 2. Graphite felt (GFA5 Sigratherm, supplied by SGL Carbon Group) electrodes, 50 mm × 50 mm × 6 mm, were contacted by carbon-polymer plates (Sigracet PPG-86, supplied by SGL Carbon Group) and separated by a 180-μm membrane (Nafion 117, supplied by DuPont). Electrolytes (2 mol dm−3 vanadium, 4 mol dm−3 total sulfate) were circulated by a peristaltic pump at a flow rate of 0.4 cm3 s−1. On both the positive and negative sides, the electrolyte exiting the cell was contacted by a carbon probe electrode (directly) and by a saturated Ag/AgCl reference electrode (via a 4 mol dm−3 H2SO4 bridge between Nafion membranes). The cell was charged and discharged at 100 mA cm−2 (2.5 A), at room temperature (23.0–23.7°C) with a 10-minute period at open circuit between each charge and discharge.
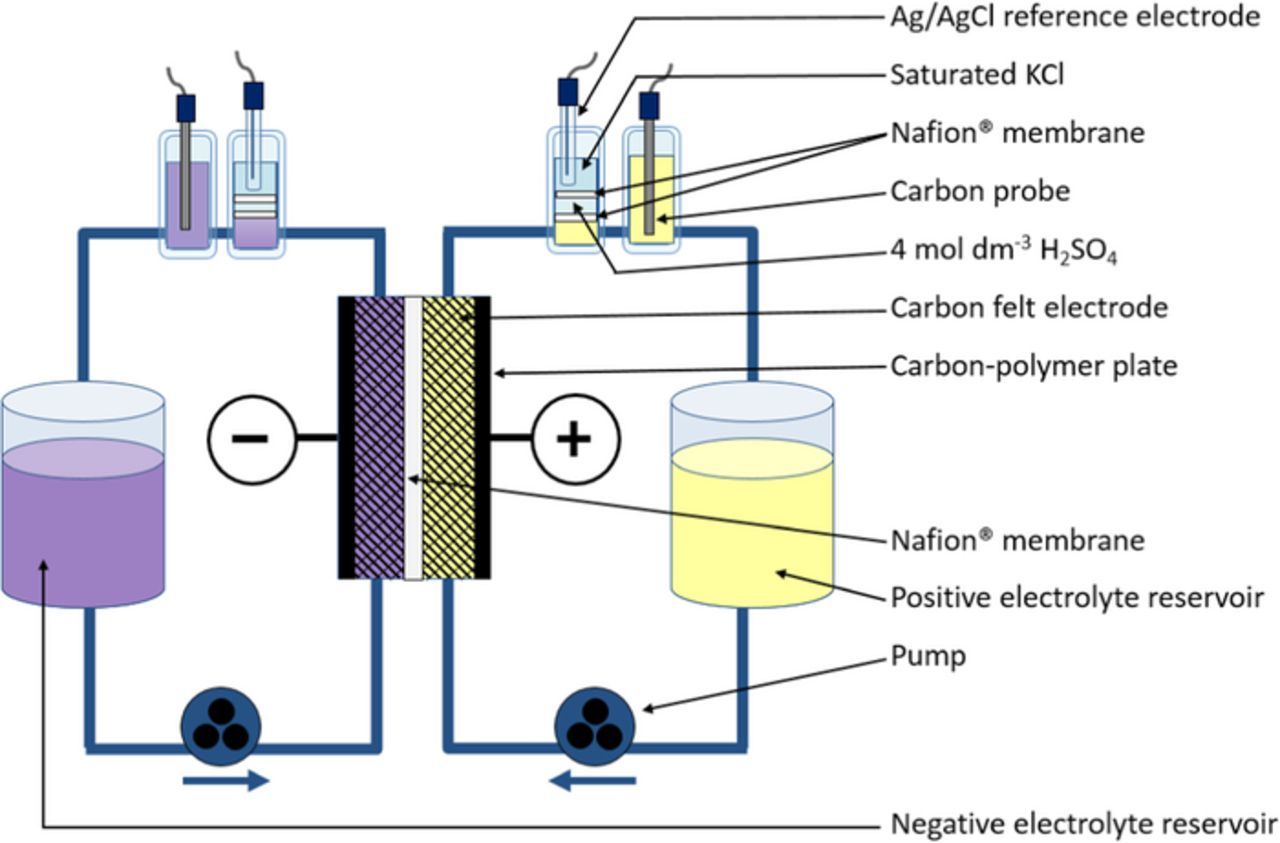
Figure 2. Schematic of VFB setup used for electrolyte preparation and flow cell experiments.
All chemicals were analytical grade and were used without further purification. The VO2+ electrolyte solutions were prepared using sulphuric acid and vanadyl sulfate (VOSO4) supplied by Sigma Aldrich. Vanadium concentrations were determined against KMnO4 standards. Solutions containing V2+ and VO2+ were prepared by reducing or oxidizing the VO2+ solution in a flow cell, which were then used to make mixed electrolyte solutions. The details of this procedure have been previously reported.27
Results and Discussion
Characterization of CFMEs
It is important to characterize electrochemical processes at carbon felt electrodes, particularly since they are widely used in flow batteries. This is often difficult due to their porous structure and the complex geometry of their surface. Therefore, this work describes a novel approach to this problem: single fibers were extracted from the felt and used to construct microelectrodes, on which the V2+/V3+ and VO2+/VO2+ reactions could be characterized using LSV and EIS. These electrodes were typically 5 mm in length and 15 ± 3 μm in diameter with an approximately circular cross-section. The morphology of a typical fiber is shown by the SEM micrograph in Fig 3; the solid core is obvious from the inset. Their microcylindrical geometry simplified the analysis of kinetics; slow-scan voltammetry enables steady-state analysis of rate constants at stationary electrodes due to enhanced diffusion. The CFME technique was validated by comparison with platinum microcylindrical electrodes fabricated in a similar manner.28
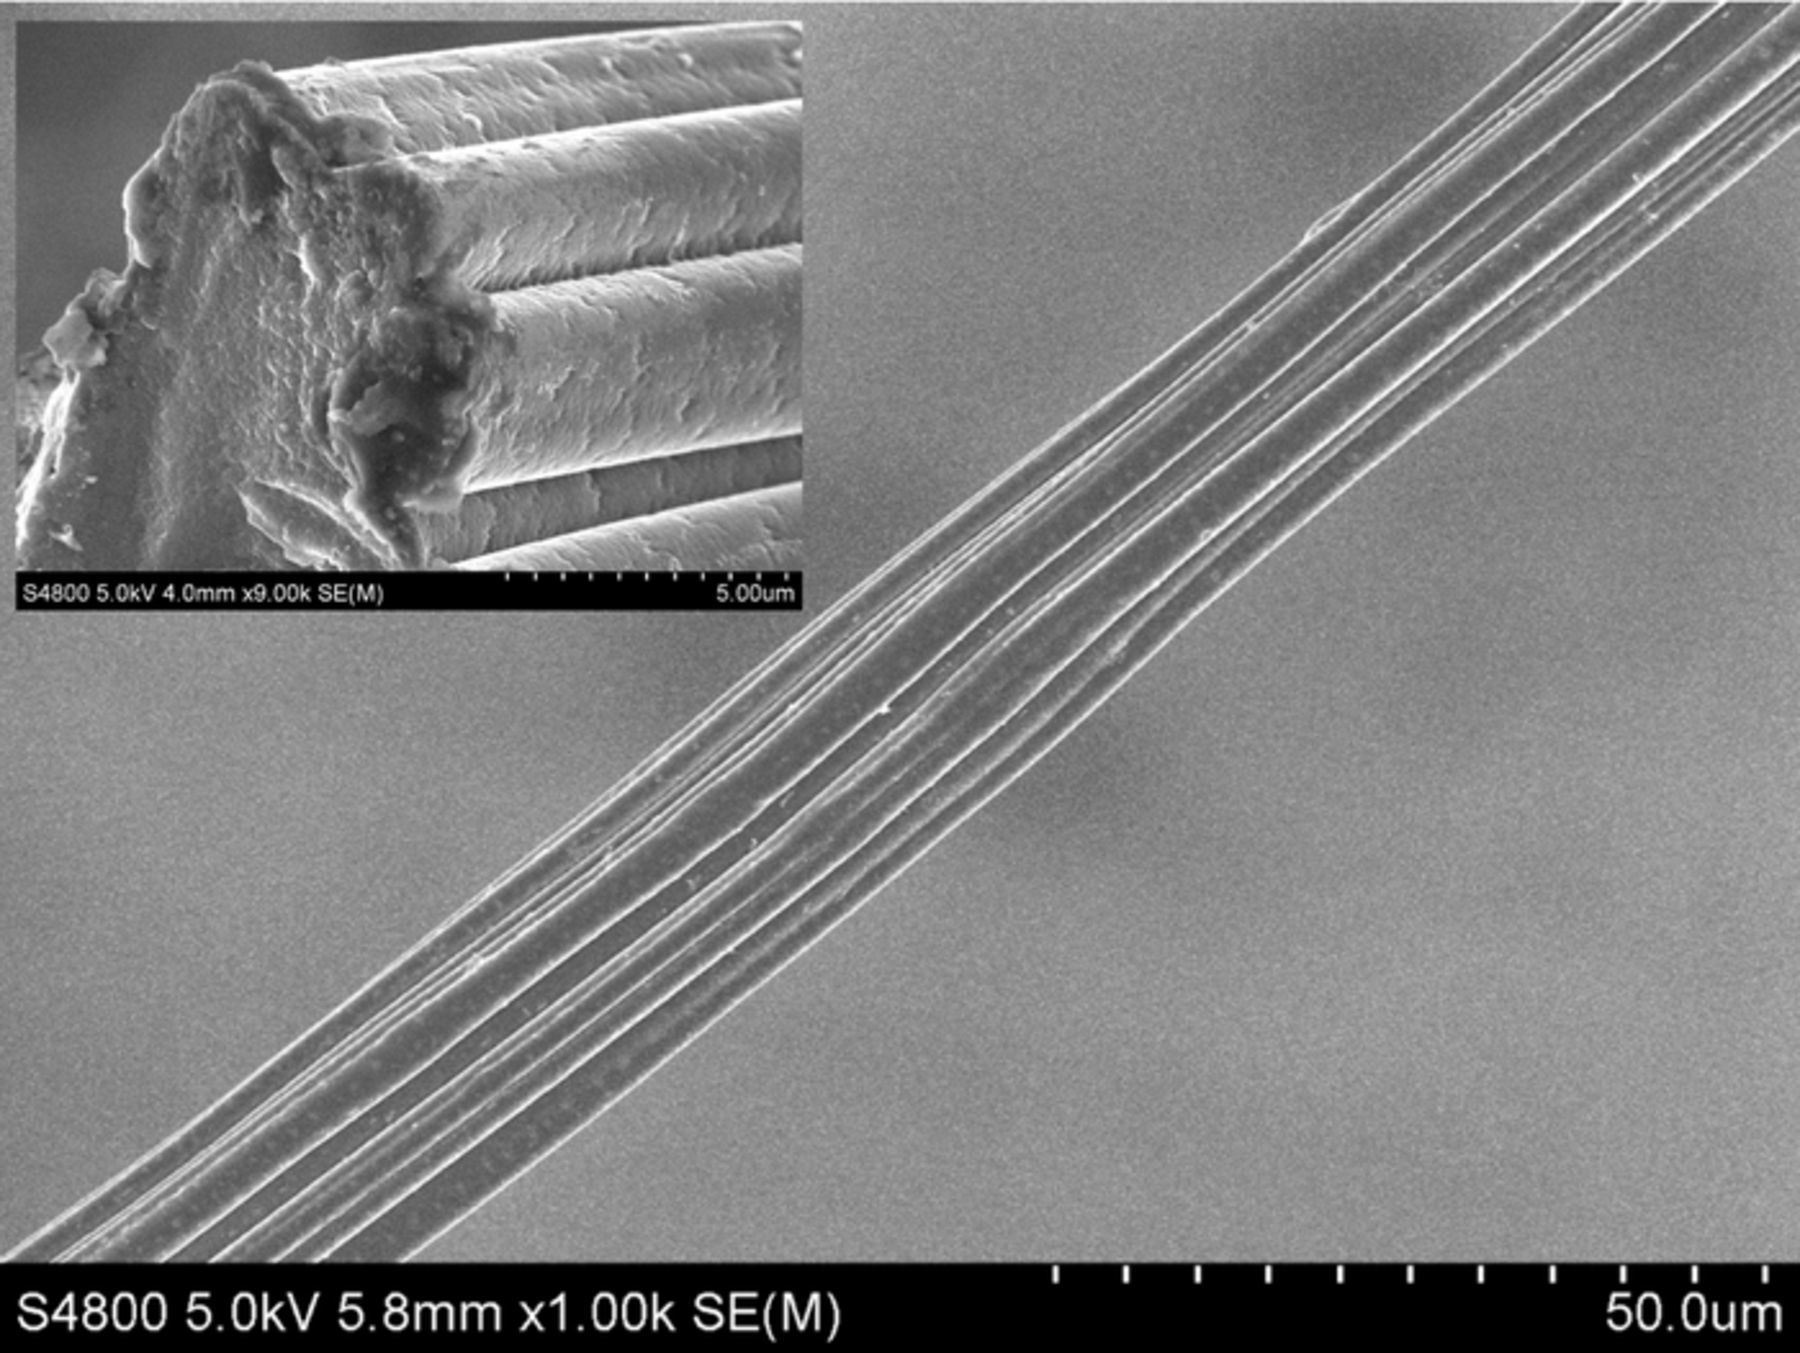
Figure 3. SEM micrographs of a typical carbon fiber.
Carbon electrodes often require preconditioning or cleaning processes in order to obtain a stable surface response, and many treatment procedures can be found in the literature.13,15,29–33 The CFMEs in this study were "preconditioned" by scanning from −0.5 V to +1.3 V for 50 cycles at 100 mV s−1.
The active surface area of CFMEs was monitored by electrochemical capacitance, after preconditioning for various numbers of cycles (capacitance was determined using cyclic voltammetry at varying scan rates between 0.16 V and 0.56 V vs MSE). It was found that the capacitance increases with preconditioning from a value of 18 ± 3 μF cm−2 for an untreated electrode, eventually reaching a steady state value of 262 ± 41 μF cm−2 after ∼30 cycles. It is important to note that the capacitance did not change during subsequent experiments, indicating a stable surface and a stable surface area. Electrochemical treatments, such as the process described here, have been shown to cause damage within the crystal lattice; such defects also expose more surface sites.34 Thus, the electrochemical preconditioning treatment yields a larger active surface area in addition to developing a reproducible surface. Furthermore, the preconditioned fibers were found to contain less surface contaminants than the untreated samples. SEM-XEDS analysis revealed that the surface of the untreated felt was contaminated with an aluminum-containing compound, which was not present after preconditioning.
Figure 4 shows a typical CV for a preconditioned CFME compared to that of a glassy carbon electrode. Both the CFME and the glassy carbon electrode exhibit typical carbon response, with peaks present around 0 V (MSE) which are associated with hydroquinone species on the carbon surface.35
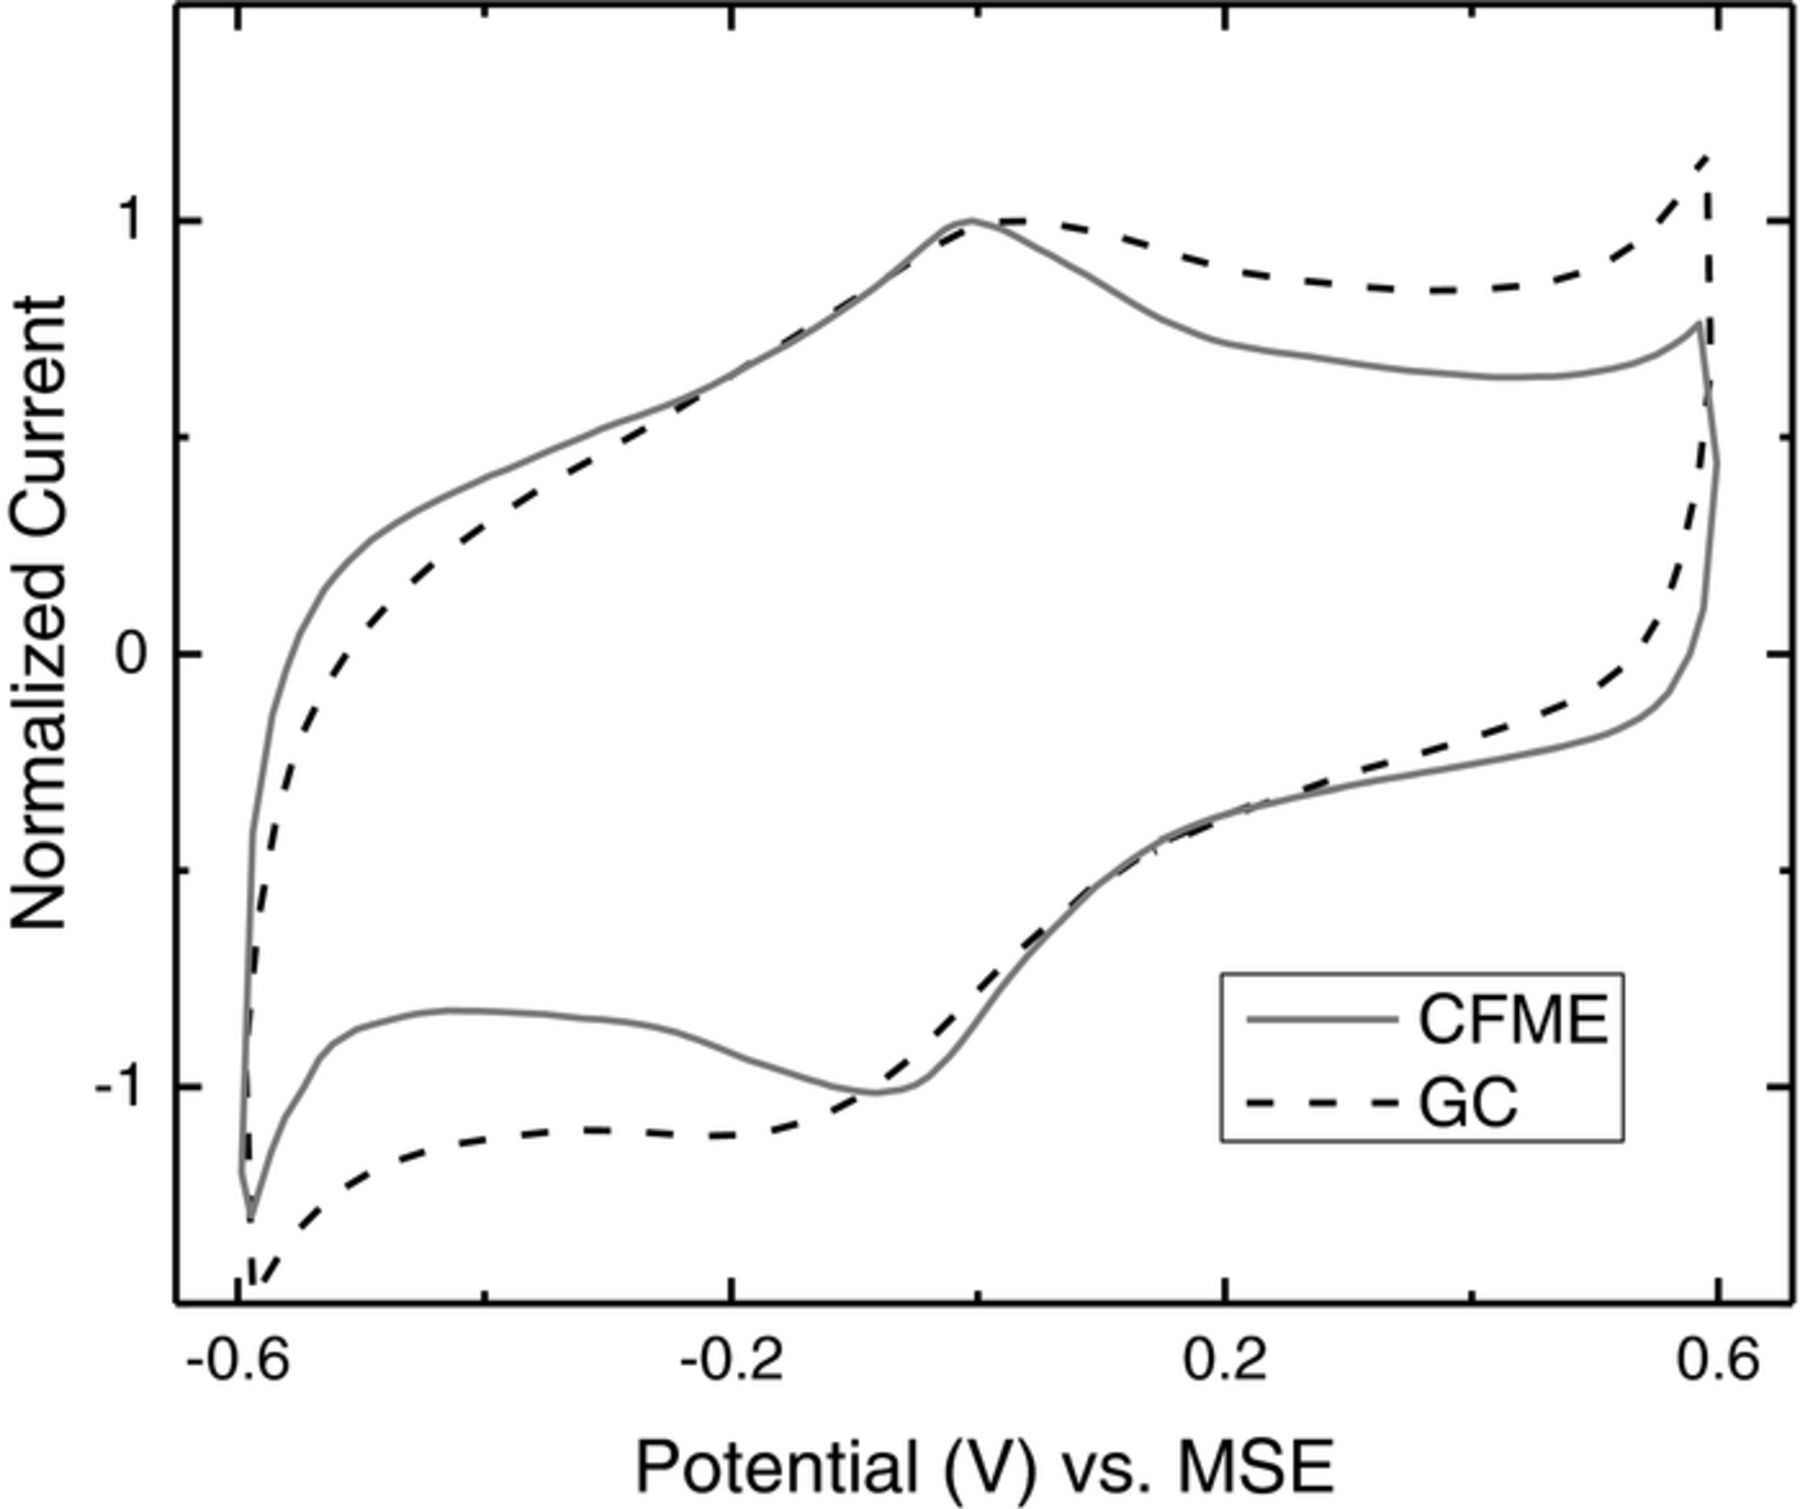
Figure 4. Comparison of typical CVs (100 mV s−1) at a preconditioned CFME and a glassy carbon (GC) electrode in 3 mol dm−3 H2SO4. The currents were normalized to the peak current at about 0 V (MSE).
Surface analysis of carbon felt using XPS
X-ray photoelectron spectroscopy was used to investigate the effects of treatment potential on functionalization of the fiber surfaces in the carbon felt. In a typical experiment, a carbon felt "test strip" electrode (see Experimental section) was preconditioned in 3 mol dm−3 H2SO4, as described above, and then held at a selected potential for 20 minutes. Felt samples treated in this way were then analyzed by XPS to identify surface elements.
The oxygen to carbon ratios obtained from survey scans for treated electrodes are summarized in Table I (typical surveys can be referenced in the appendix, Fig. A1). Electrodes that were treated at high positive overpotentials showed a greater percentage of oxygen present on the surface. When held at a potential of +1.5 V (MSE) the oxygen to carbon (O/C) ratio increased to 0.49 compared to 0.15 for an electrode held at −2.0 V (MSE). The untreated felts also had a low O/C ratio (0.09): this was increased after preconditioning as the preconditioning scans ended at a potential of +1.3 V (MSE). The slightly higher O/C ratio of the reduced samples compared to the untreated sample may be attributed to surface oxides that were not reduced after preconditioning. Thus, oxidation treatment increases the surface oxygen content while reduction treatment decreases it.
Table I. Comparison of elemental composition of electrode surfaces after the treatments indicated (all potentials are vs. MSE). The elemental composition was obtained from XPS survey scans (as in Fig. A1). The oxygen:carbon ratios are shown for each. Electrodes were treated in 3 mol dm−3 H2SO4, as described in the Experimental section.
| Elemental Composition (Atomic %) | |||
|---|---|---|---|
| Electrode Treatment | Oxygen | Carbon | Oxygen:Carbon |
| Untreated | 8.5 | 91.5 | 0.09 |
| Preconditioned | 25.2 | 74.8 | 0.34 |
| +1.5 V | 32.8 | 67.2 | 0.49 |
| +1.3 V | 28.5 | 71.5 | 0.40 |
| +1.0 V | 11.8 | 88.2 | 0.13 |
| −0.5 V | 13.7 | 86.3 | 0.16 |
| −0.9 V | 12.6 | 87.4 | 0.14 |
| −2.0 V | 13.1 | 86.9 | 0.15 |
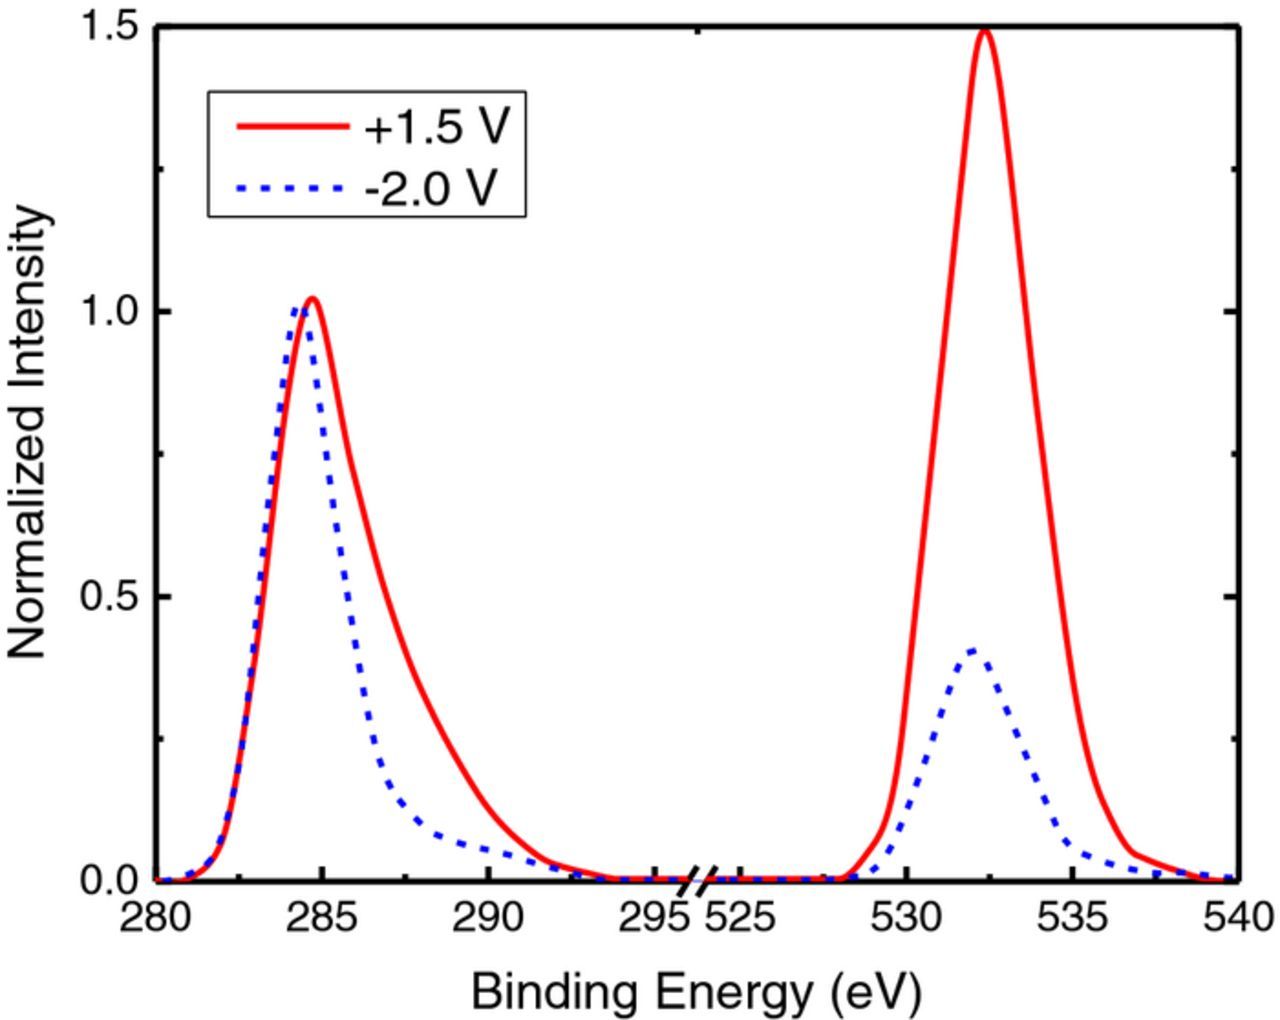
Figure A1. Typical XPS survey scans of carbon felt samples after electrochemical treatments in 3 mol dm−3 H2SO4 after reduction at −2.0 V (blue) compared to oxidation at +1.5 V (red). The two spectra were normalized with respect to the intensity of the C1s peak.
High resolution XPS of the C1s and O1s peaks (Fig. A2) provide some insight onto the change in surface chemistry and the functional groups present on the carbon surface after treatment at high positive overpotentials. From the high resolution C1s fits, the emergence of two peaks located at 286.5 eV and 289 eV indicate the presence of phenolic and carbonyl groups36 on the surface which was oxidized at +1.5 V (MSE). The high resolution O1s peaks also signify the presence of phenolic and carbonyl groups (peaks at 532.5 eV and 532 eV). These peaks were not observed for the untreated or the reduced electrodes.
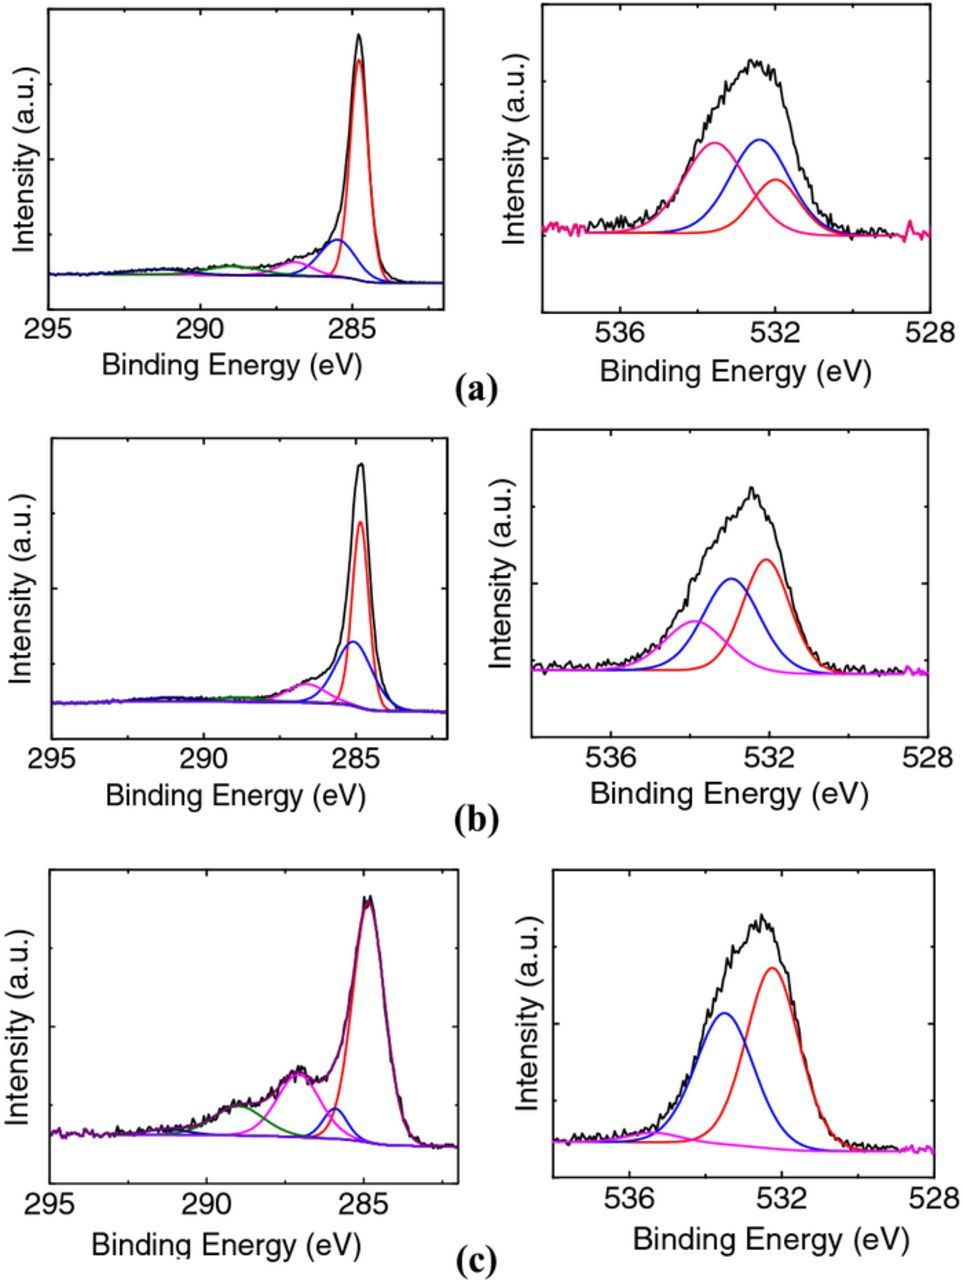
Figure A2. Curve fitted high-resolution C1s and O1s spectra for the (a) untreated sample compared to felt samples that were (b) reduced at −2.0V and (c) oxidized at +1.5 V.
Effects of treatment on kinetics
We have previously reported22,23,37 for a range of carbon materials that the kinetics of V2+/V3+ are enhanced by electrode treatments at positive potentials while the kinetics of VO2+/VO2+ are inhibited. Conversely, we have shown that the kinetics of VO2+/VO2+ are enhanced by electrode treatments at negative potentials while the kinetics of V2+/V3+ are inhibited. In this work, we extend our study to application-relevant carbon felt electrodes and use single fiber microelectrodes to study the effect of electrochemical treatment on the kinetics of V2+/V3+ and VO2+/VO2+ by LSV and EIS.
To study the effect of electrochemical treatment on the kinetics of V2+/V3+ the electrodes underwent reduction at −2.0 V (MSE) and oxidation at +1.5 V (MSE) as described in the Experimental section. The resulting LSV traces are shown in Fig. 5 where the oxidized electrode surface (red, solid lines) exhibits higher currents and steeper slopes when compared to the reduced surface (blue, broken lines).
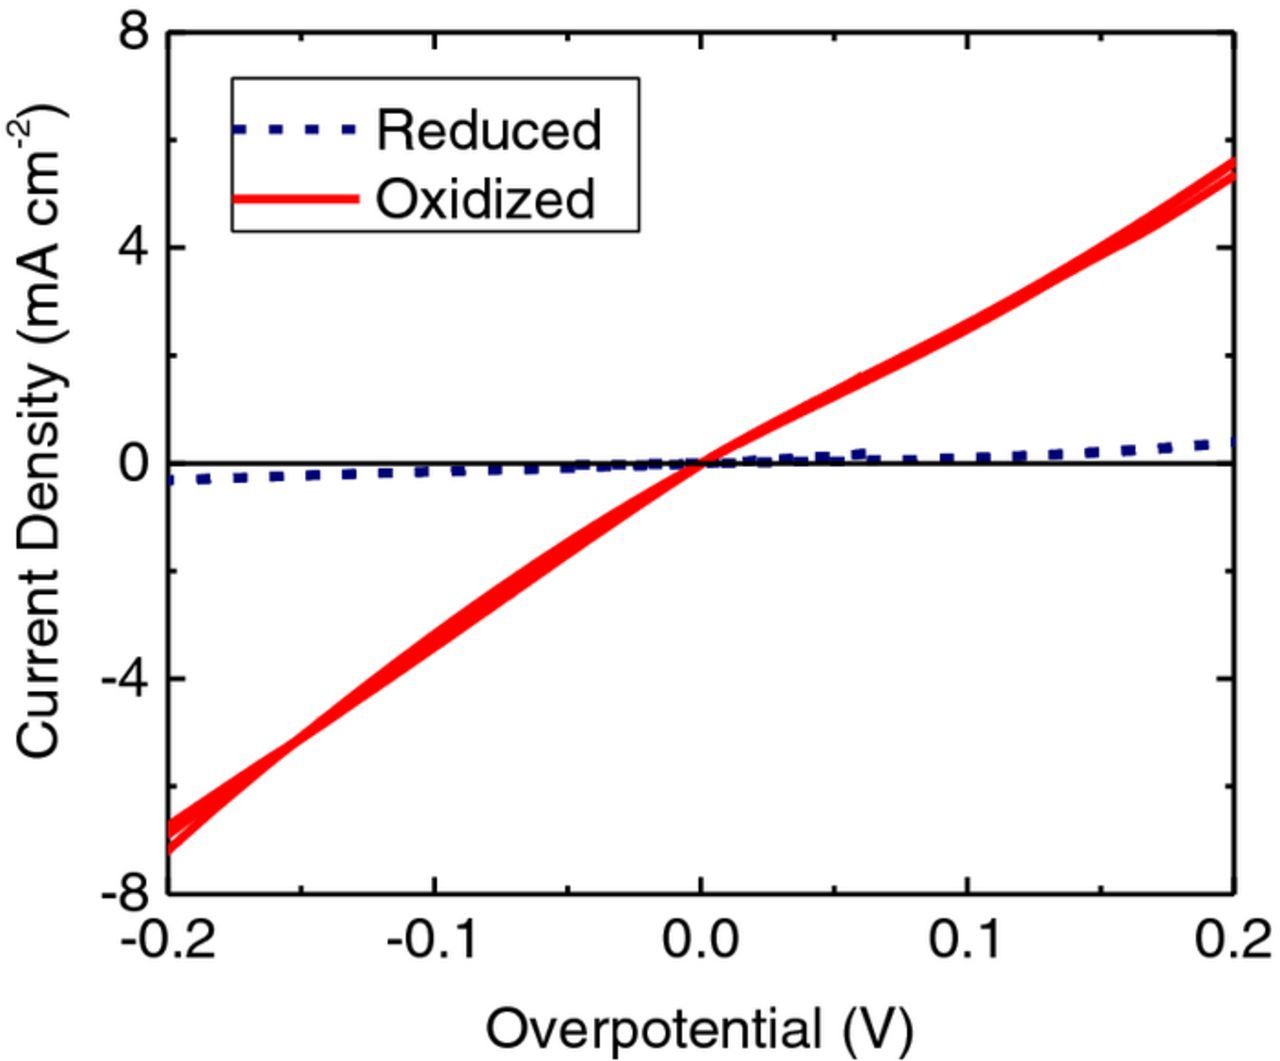
Figure 5. LSVs (5 mV s−1) at a CFME in V2+/V3+ electrolyte performed using the same electrode in the same electrolyte but after two different treatments; reduction at −2.0 V (MSE) or oxidation at +1.5 V (MSE). The LSVs from cycles 2, 4, and 6 are shown.
The same CFME was tested in a VO2+/VO2+ electrolyte after undergoing the same oxidation and reduction treatments as above. The resulting LSV traces are shown in Fig. 6 where the reduced electrode surface (blue, broken lines) exhibits higher currents and steeper slopes when compared to the oxidized surface (red, solid lines). These results suggest that the kinetics of V2+/V3+ reaction are enhanced by oxidation treatment while the kinetics of VO2+/VO2+ are enhanced by reduction treatment. Similar results were obtained using EIS to monitor the kinetics. Furthermore, in both Fig. 5 and Fig. 6 the electrode was alternately oxidized and reduced for a total of 6 iterations (one iteration consists of a reduction treatment and an LSV followed by an oxidation treatment and an LSV; for clarity, only the LSVs from iterations 2, 4, and 6 are shown). This demonstrates excellent reproducibility and indicates that the effect is not the result of a change in surface area.
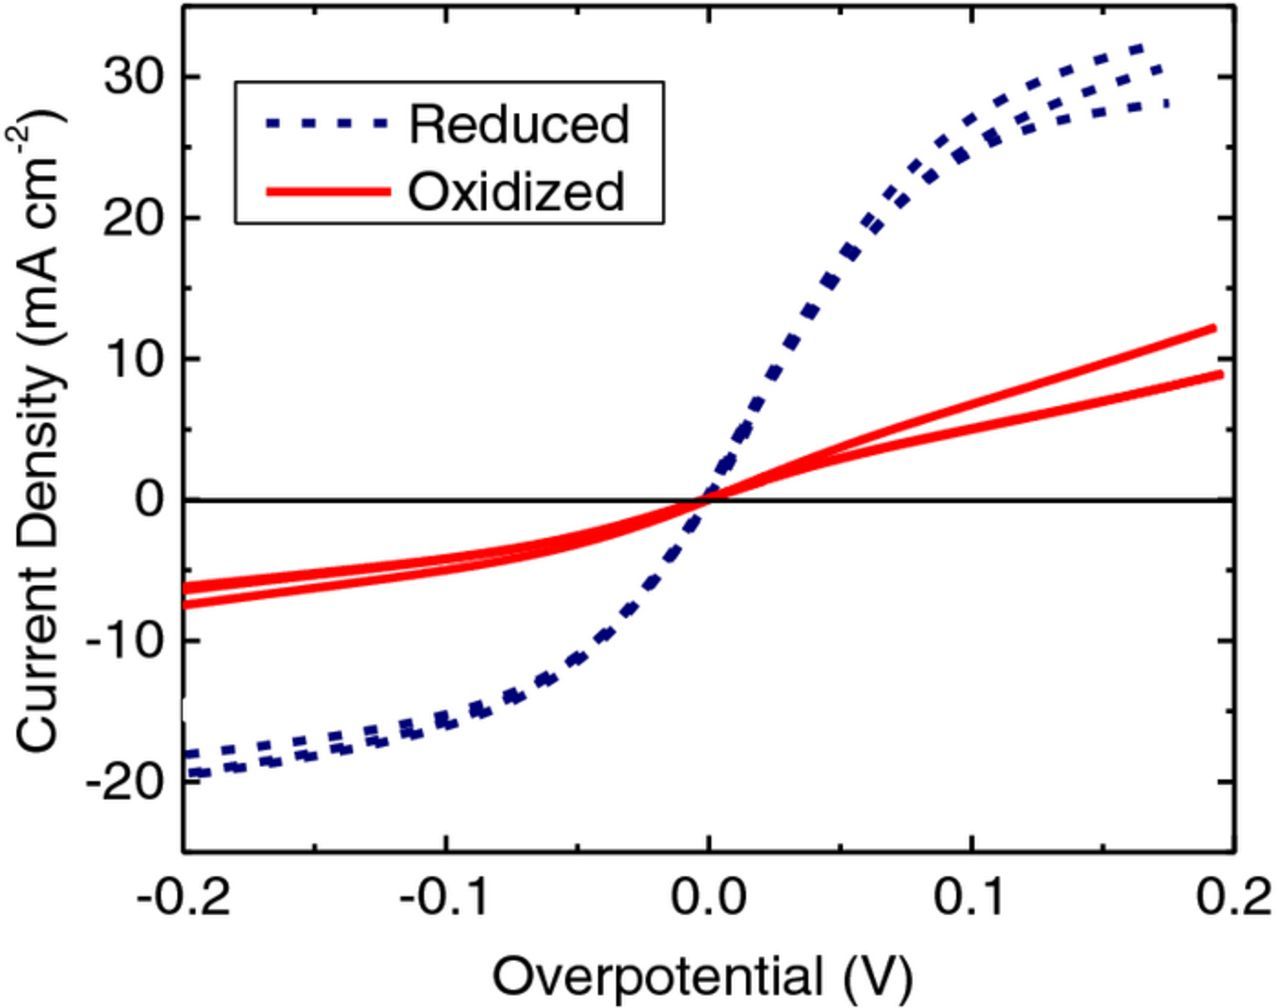
Figure 6. LSVs (5 mV s−1) at a CFME in VO2+/VO2+ electrolyte performed using the same electrode in the same electrolyte but after two different treatments; reduction at -2.0 V (MSE) or oxidation at +1.5 V (MSE). The LSVs from cycles 2, 4, and 6 are shown.
The kinetic rate constants estimated from LSV and EIS are summarized in Table II where each value reported is the average of four different CFMEs. The actual values calculated using the two different techniques vary slightly; however, the relative values are consistent. Rate constants obtained using both techniques indicate that the kinetics of V2+/V3+ are approximately an order of magnitude faster on an oxidized surface (the ratio of the kinetic rate constant for an oxidized surface to that of a reduced surface is 9.7:1 and 21:1 from LSV and EIS, respectively). Conversely, kinetics of VO2+/VO2+ are slower on an oxidized surface: treatment at +1.5 V (MSE) decreases the rate constant by a factor of four (the ratio of the kinetic rate constant for an oxidized surface to that of a reduced surface is 1:4.3 and 1:4.7 from LSV and EIS respectively). These results are consistent with previous findings from our group for various carbon electrode materials22,23 and further evidence of the strong effect of electrochemical treatments on kinetics at the felt electrodes used in typical flow batteries.
Table II. Comparison of kinetic rate constants, ko, after treatment at +1.5 V (MSE) to that after treatment at −2.0V (MSE) for both V2+/V3+ and VO2+/VO2+ reactions on CFMEs at 25°C; rate constants were estimated from both LSV and EIS and each value is the average of four different CFMEs.
| V2+/V3+ | VO2+/VO2+ | |||
|---|---|---|---|---|
| ko (10−6 cm s−1) | ko (10−6 cm s−1) | |||
| Electrode Treatment | LSV | EIS | LSV | EIS |
| +1.5 V | 5.8 ± 1.9 | 21 ± 1.3 | 17 ± 6.0 | 36 ± 7.0 |
| −2.0 V | 0.6 ± 0.3 | 1.0 ± 0.4 | 73 ± 29 | 170 ± 40 |
Effect of treatment potential
Similar effects to those described above in Figs. 5 and 6, were observed when the CFME was treated at other potentials; the reproducibility was excellent at all treatment potentials investigated.
To examine the effect of oxidation treatment potential on V2+/V3+, an electrode which had initially been reduced at −2.0 V (MSE) was then treated at selected positive potentials. Typical results are shown in Fig. 7a where the dashed line represents a typical Nyquist plot for the initial reduced (baseline) electrode surface and the solid lines represent the spectra for that same electrode after treatment at selected positive potentials. It can be seen that as the treatment potential is made progressively more positive, the charge transfer resistance becomes smaller, indicating increased activation of the electrode and faster kinetics for V2+/V3+.
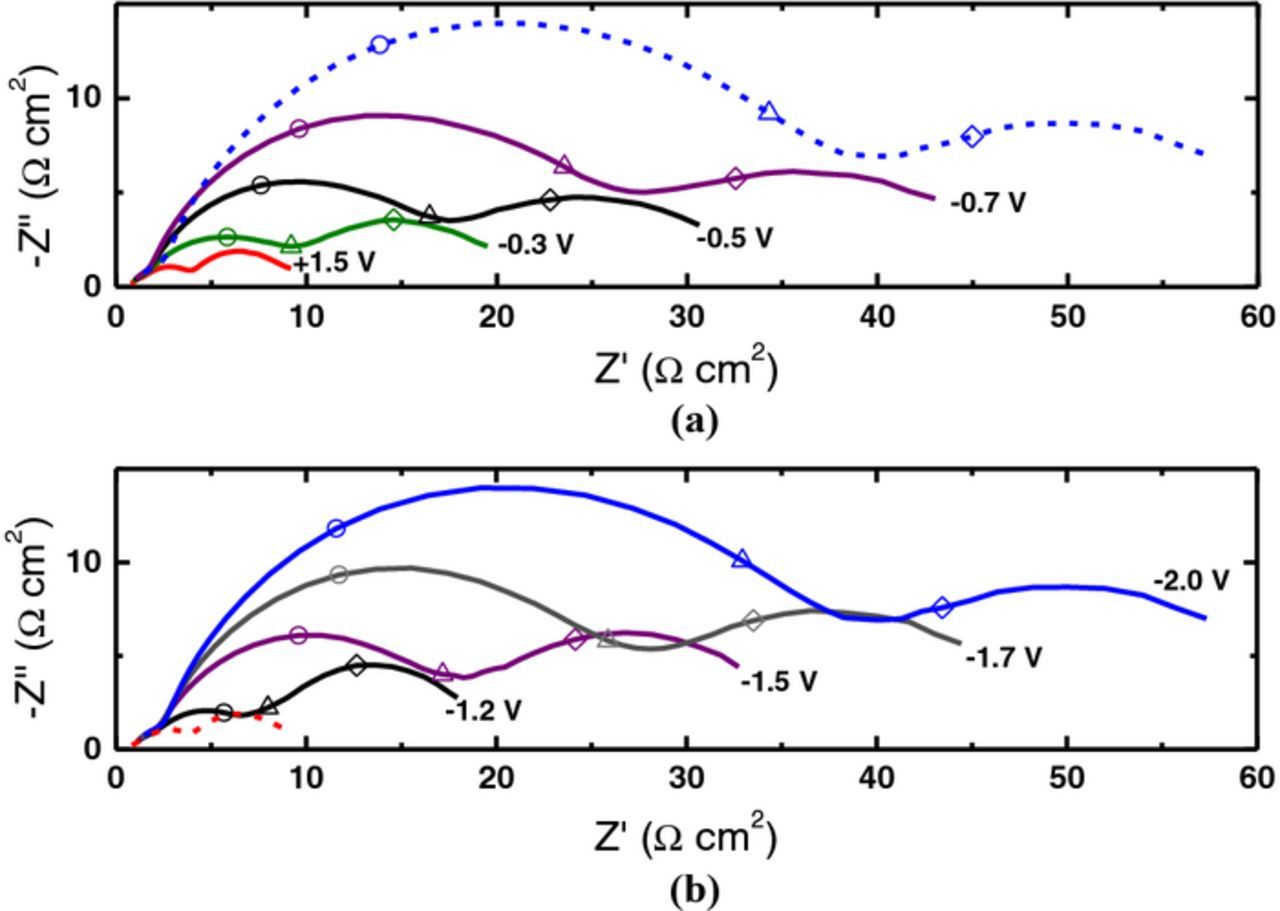
Figure 7. Nyquist plots for a CFME in V2+/V3+ electrolyte after (a) oxidation and (b) reduction treatments at the potentials indicated. The broken blue (a) and broken red (b) lines correspond to the initial (baseline) treatments at −2.0 V and +1.5 V (MSE), respectively. Each spectrum is represented by a continuous line. Selected frequencies are indicated: 100 Hz (○), 10 Hz (Δ), and 1 Hz (◊).
The effect of reduction treatment potentials on V2+/V3+ kinetics were investigated in a similar manner; the corresponding EIS results are shown in Fig. 7b, where the dashed line represents a typical Nyquist plot for the initial oxidized (baseline) electrode, and the solid lines represent curves after treatment at selected negative potentials. As the treatment potential is made progressively more negative, the charge-transfer resistance becomes larger indicating increased deactivation of the electrode.
The electrochemical rate constant ko was estimated from the charge transfer resistance for each of the Nyquist plots in Fig. 7. These rate constants, which are a measure of the activity of the electrode, are plotted against treatment potential as shown in Fig. 8. The changes in activity are significant; e.g., ko after oxidation treatment at +1.5 V (MSE) is an order of magnitude greater than that after treatment at −2.0 V (MSE). For oxidation treatment (O), at potentials more positive than −0.7 V the activity begins to increase; this trend continues as the potential is made more positive with a rapid increase in activity between −0.5 V and +0.5 V until the effect appears to approach saturation at around +1.0 V. For reduction treatment (R), at potentials more negative than −0.8 V the activity begins to decrease; this trend continues, as the potential is made more negative with a rapid decrease in activity between −0.8 V and −1.5 V.
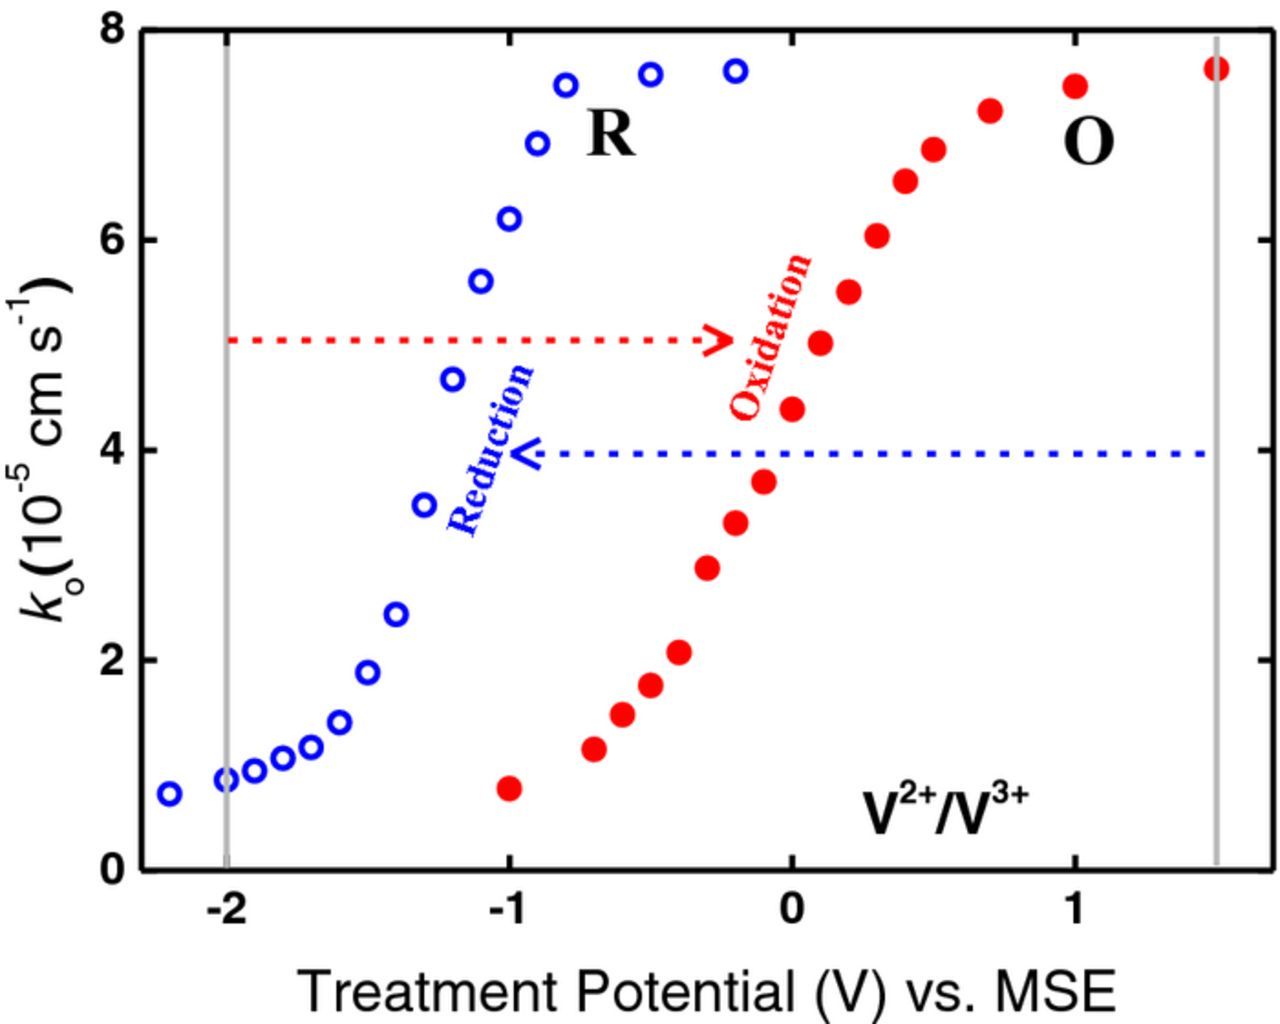
Figure 8. Rate constants, ko, for V2+/V3+ plotted against oxidation (O) and reduction (R) treatment potentials. The data in O and R are from Nyquist plots such as those in Fig. 7a and 7b, respectively. The arrows show the oxidation or reduction treatment potential relative to the initial baseline potential.
There is a considerable shift in potential between the activation (O) and deactivation (R) curves in Fig. 8. The average potential of the 50% point on the activation curve is 0 V (MSE) while the corresponding potential on the deactivation curve is −1.2 V (MSE), resulting in a hysteresis of +1.2 V.
The effect of treatment potential on VO2+/VO2+ kinetics was similarly investigated. Figure 9a shows typical EIS results for a series of experiments at oxidation treatment potentials. As the treatment potential is made progressively more positive, the charge-transfer resistances become progressively larger, indicating increased deactivation of the electrode. These results contrast sharply with those in Fig. 7 where the opposite trend is observed for V2+/V3+. Likewise Fig. 9b shows typical EIS results at reduction treatment potentials. In this case, as the treatment potential is made progressively more negative, the charge-transfer resistances become progressively smaller, indicating increased activation of the electrode, contrasting with Fig. 7 where the opposite trend is observed for V2+/V3+.
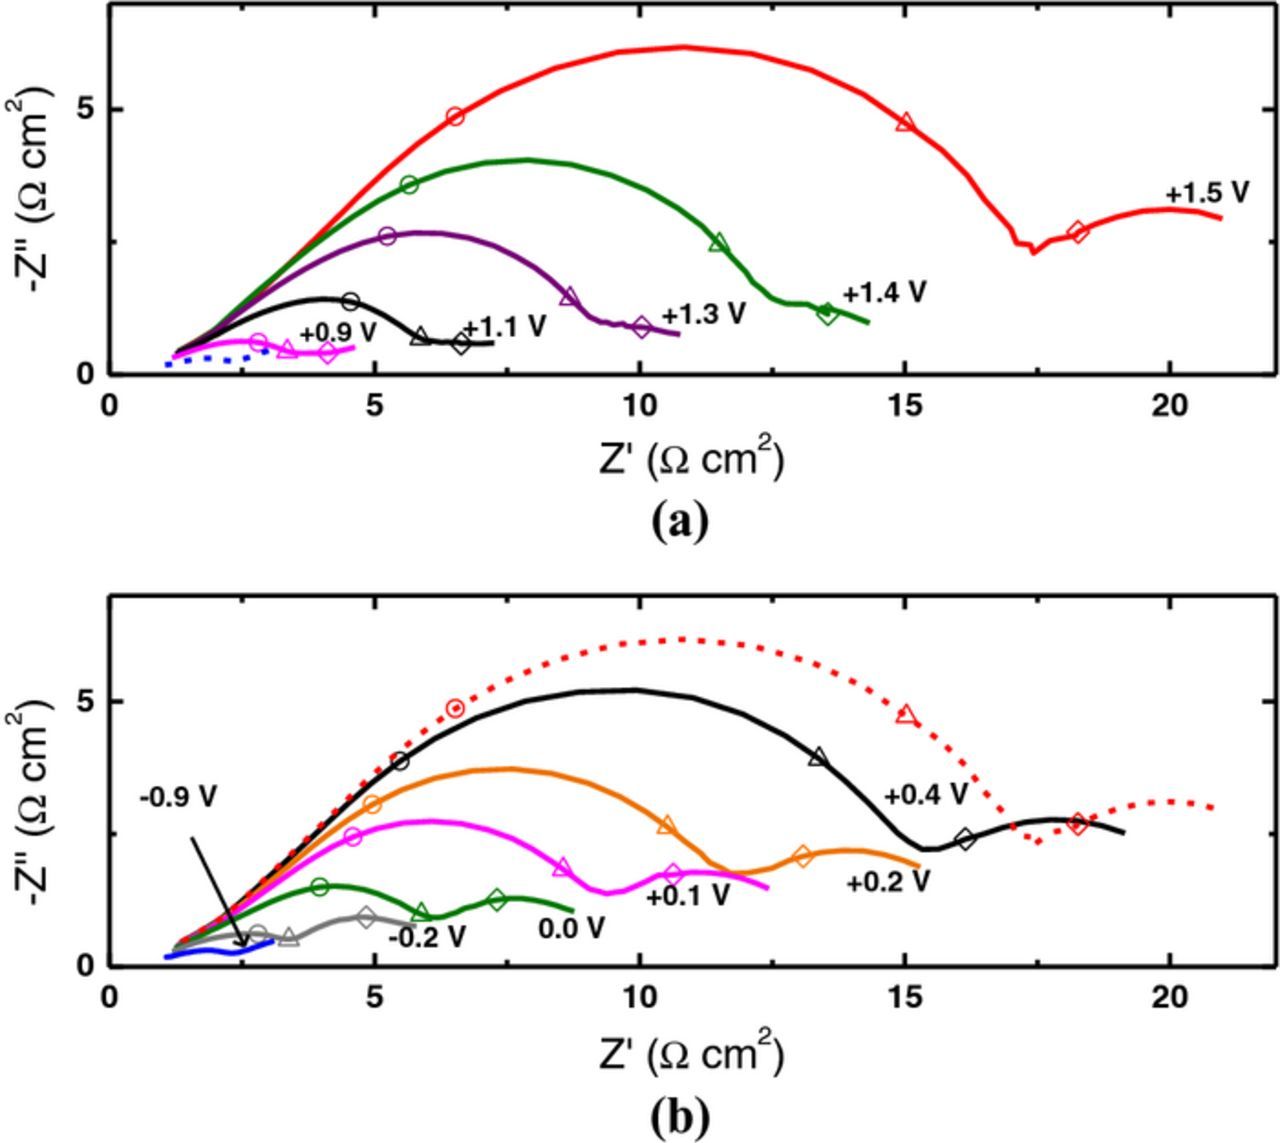
Figure 9. Nyquist plots for a CFME in VO2+/VO2+ electrolyte after (a) oxidation and (b) reduction treatments at the potentials indicated. The broken blue (a) and broken red (b) lines correspond to the initial (baseline) treatments at −2.0 V and +1.5 V (MSE), respectively. Each spectrum is represented by a continuous line. Selected frequencies are indicated: 100 Hz (○), 10 Hz (Δ), and 1 Hz (◊).
The electrochemical rate constants ko for VO2+/VO2+, estimated from the charge transfer resistances in Fig. 9, are plotted against treatment potential in Fig. 10. The changes in activity are significant; e.g., the value of ko after treatment at −2.0 V (MSE) is larger by a factor of 4 than that after treatment at +1.5 V (MSE). For oxidation treatment (O), as the potential is made progressively more positive than +0.7 V, the electrode activity decreases. However, for treatment at potentials more negative than +0.4 V (R), the activity begins to increase; this trend continues as the potential is made more negative with a rapid increase in activity between +0.1 V and −0.4 V until the effect appears to approach saturation near −0.6 V. These results are in direct contrast to those observed for the V2+/V3+ reaction (Fig. 8). However, a hysteresis of 1.1 V between the potential of the 50% point on the activation curve (R) at −0.1 V and the corresponding potential on the deactivation curve at +1.0 V is observed.
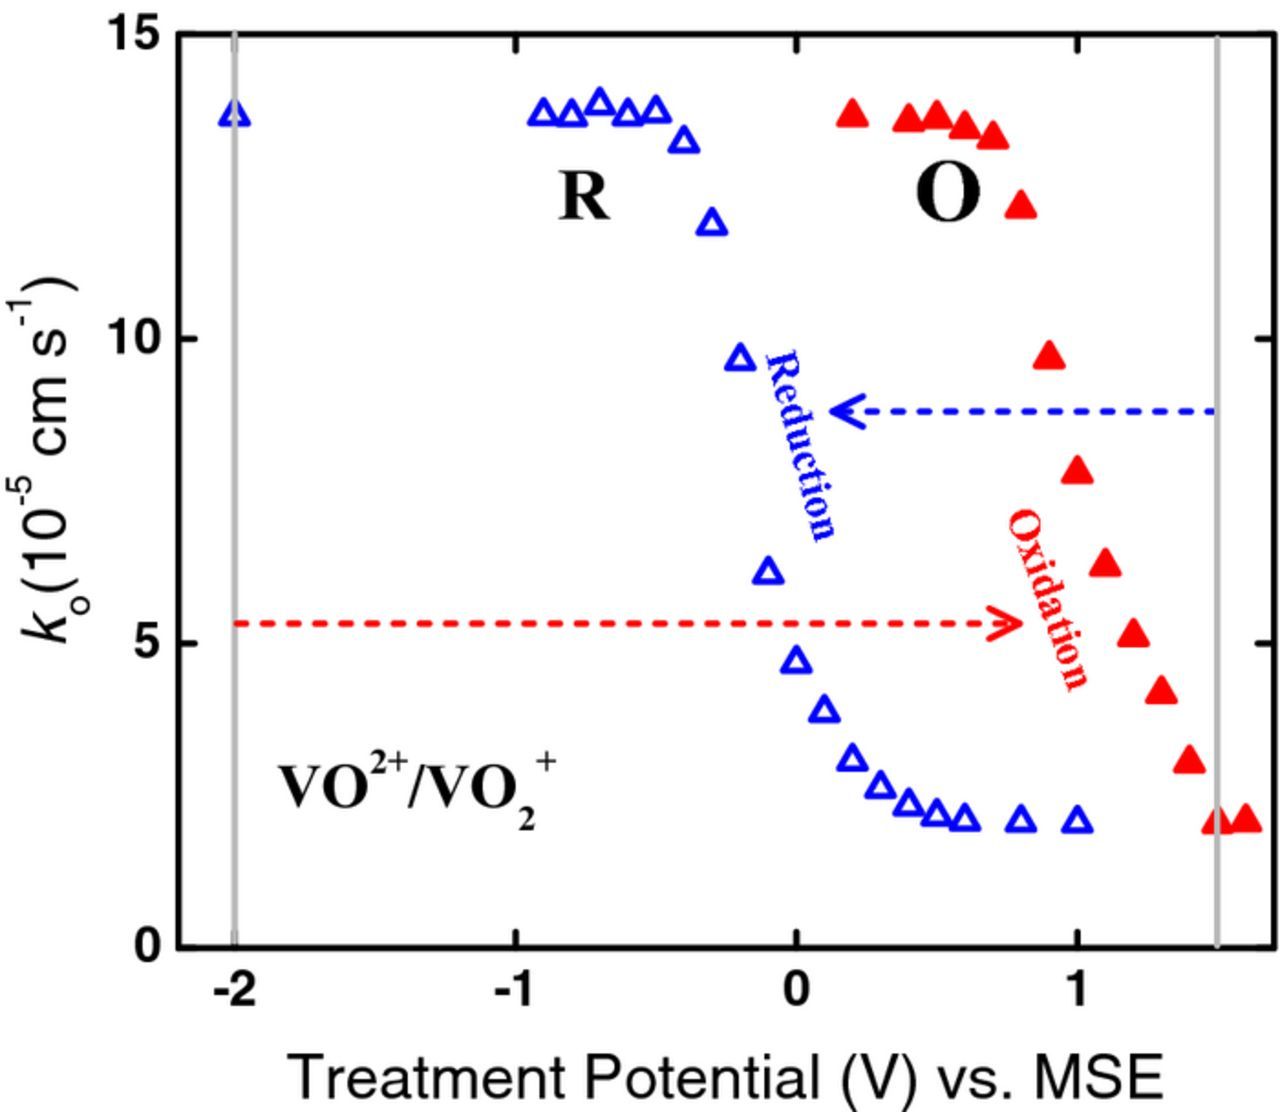
Figure 10. Rate constants, ko, for VO2+/VO2+ plotted against oxidation (O) and reduction (R) treatment potentials. The data in O and R are from Nyquist plots such as those in Fig. 9a and 9b, respectively. The arrows show the oxidation or reduction treatment potential relative to the initial baseline potential.
Flow cell experiments
The observed enhancement of V2+/V3+ kinetics by electrode pretreatment at positive potentials and of VO2+/VO2+ kinetics by pretreatment at negative potentials suggests that interchanging the positive and negative electrodes in a flow cell might improve the performance. Fig. 11 compares the pretreatment potential dependence of V2+/V3+ and VO2+/VO2+ kinetics with the ranges of potential experienced by a negative (blue band) and a positive (pink band) electrode in a flow cell during typical operating conditions. Comparing the blue band with the reduction treatment curve R2,3 for V2+/V3+, it is clear that the potential of the negative electrode corresponds to a region where it is being deactivated. In contrast, comparing the pink band with the oxidation pretreatment curve O4,5 for VO2+/VO2+, it is clear that the potential of the positive electrode corresponds to a region where it is fully activated. The data in Fig. 11 therefore suggests that the kinetics at the negative electrode of a flow cell will become slower with time (i.e. the overpotential will increase) while the kinetics at the positive electrode will not.
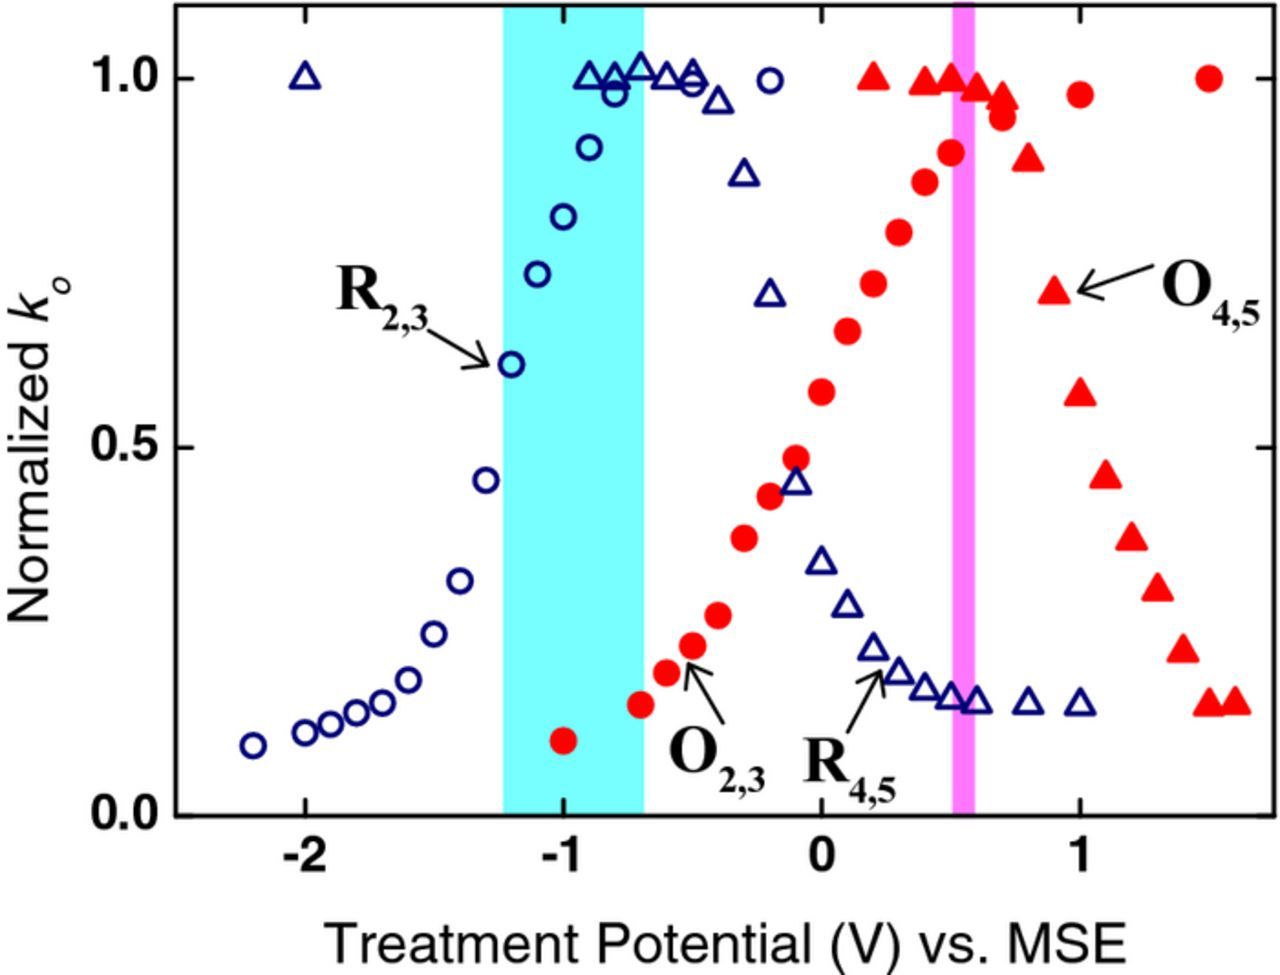
Figure 11. Normalized rate constants for both V2+/V3+ and VO2+/VO2+ plotted against oxidation (O) and reduction (R) treatment potentials. Rate constants from Figs. 8 and 10 are normalized to their maximum value kmax in each case (i.e. ko/kmax). The bands of operating potentials experienced by both the positive (pink) and negative (blue) half-cells during charging and discharging of the VFB are also shown.
To investigate this further, experiments were carried out in a laboratory-scale flow cell which was repeatedly charged and discharged. In addition to monitoring the cell potential, the potential of both the positive and negative electrodes against an Ag/AgCl reference electrode was monitored. Furthermore, the potential of a carbon probe in both the positive and negative electrolytes were examined: the overpotentials of the positive and negative electrodes were each taken as the potential difference from the corresponding carbon probe.
The overpotentials at the positive and negative electrodes are plotted in Fig. 12. As expected,22,23 the overpotentials are much greater at the negative than at the positive. It is clear from Fig. 12 that the overpotential at the negative electrode during later cycles (42–47) is considerably greater than during the initial cycles. This is consistent with the results in Fig. 11 discussed above, which show that the negative electrode experiences potentials where it is deactivated for the V2+/V3+ reaction. However, it is clear from Fig. 12 that there is no significant change in the overpotential at the positive electrode. Again, this is consistent with the results in Fig. 11 which show that the potentials experienced by the positive electrode are in a range where it is not deactivated for the VO2+/VO2+ reaction.
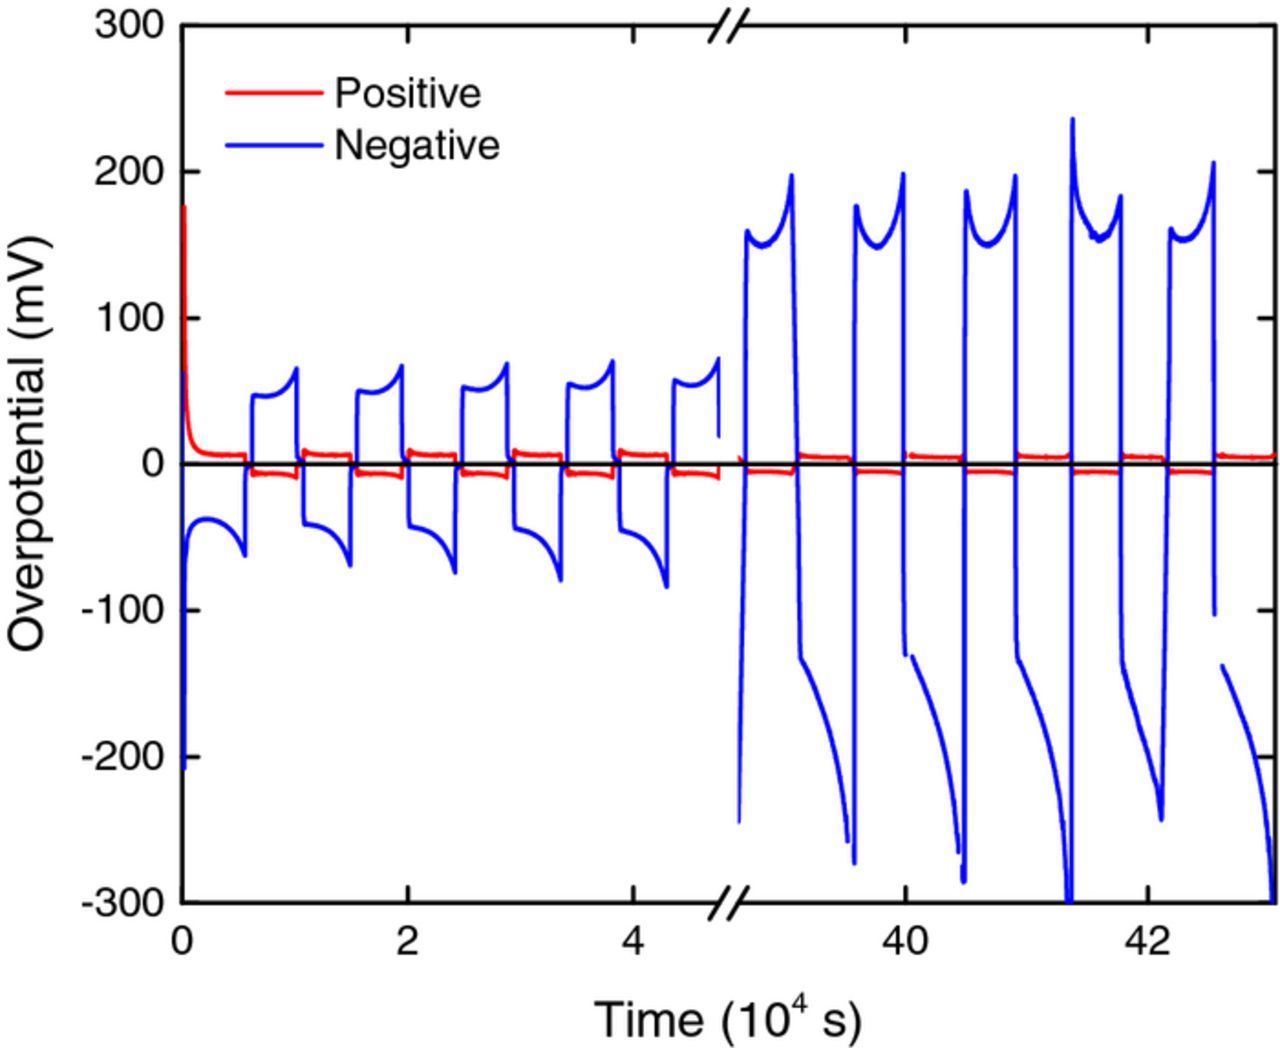
Figure 12. Plot of positive (red) and negative (blue) overpotentials during the first 5 and final 5 cycles (of 47 cycles) in a VFB.
After 47 charge-discharge cycles, the positive and negative electrolytes were interchanged so that what had previously been the positive electrode now became the negative and vice versa. After changing the polarity in this way, the cell was again cycled as before: the overpotentials are plotted in Fig. 13. Clearly, the overpotentials at the negative electrode in Fig. 13 are much smaller than the corresponding overpotentials in Fig. 12, indicating that the electrode has been activated by its "pretreatment", i.e. by being previously the positive electrode of the cell. This is consistent with the results in Fig. 11 because the potential range of the positive electrode (pink band) falls in a region of pretreatment potential where the electrode is activated for the V2+/V3+ reaction (curve O2,3).
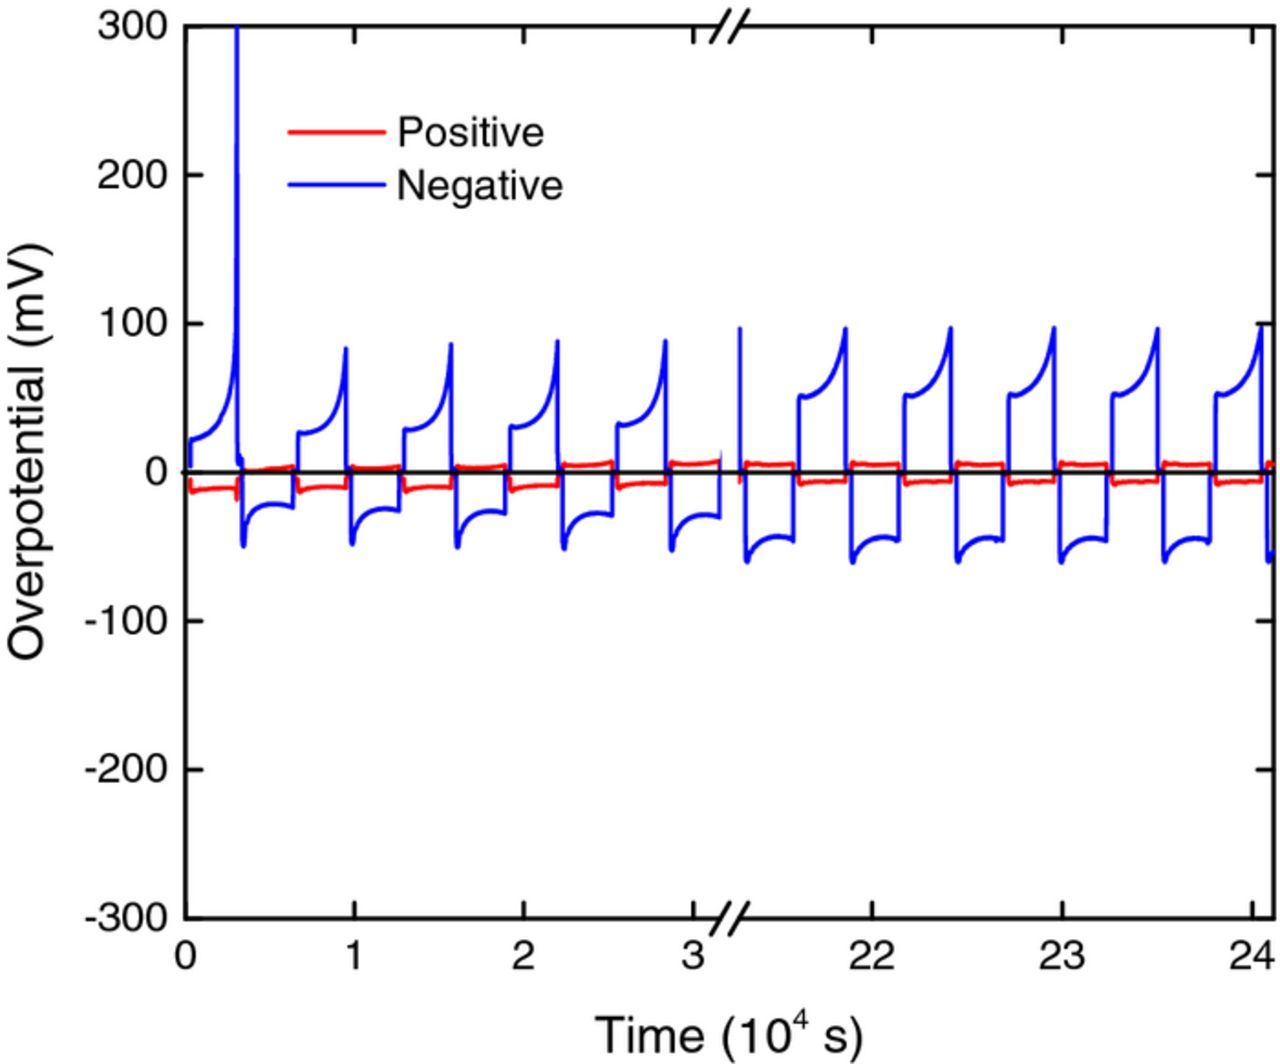
Figure 13. Plot of positive (red) and negative (blue) overpotentials during the first 5 and final 5 cycles (of 40 cycles) after electrolyte interchange following the cycles shown in Fig. 12.
The effect is examined in more detail in Fig. 14 where the overpotential at both electrodes is plotted against cycle number. It can be seen that the overpotential of the negative electrode increases from an initial value of ∼50 mV (for an untreated felt electrode) to ∼160 mV after 47 cycles. When the electrodes are interchanged after 47 cycles, the overpotential on the (new) negative decreases to ∼25 mV: it then increases slowly reaching ∼40 mV after 50 cycles, a value which is still less than the overpotential at the untreated electrode (cycle 1). Interchange of the electrodes has little effect on the overpotential at the positive electrode, which is much smaller than that at the negative.
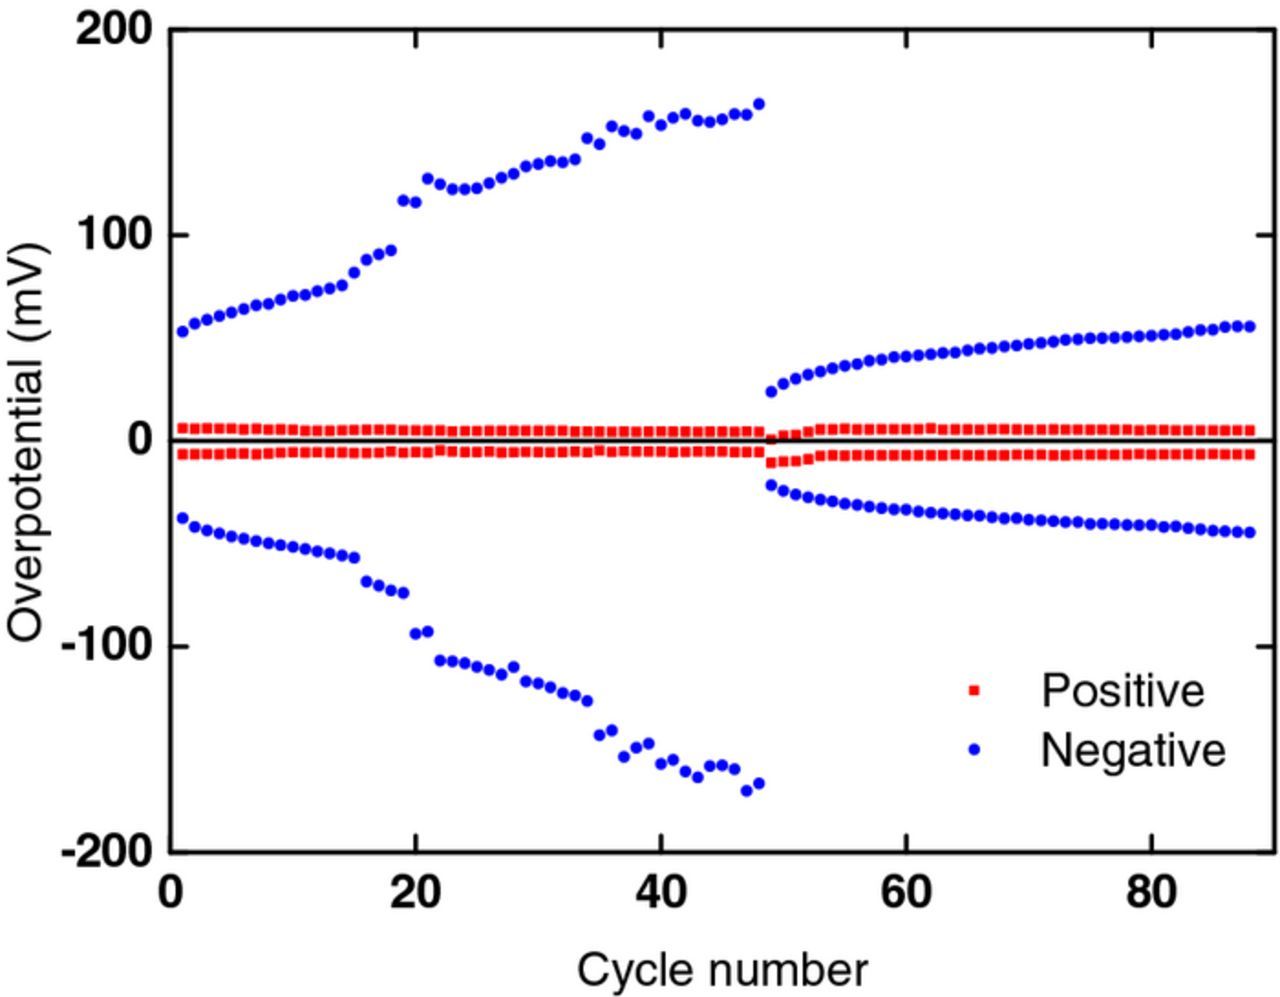
Figure 14. Plot of positive (red) and negative (blue) overpotential versus cycle number; the overpotential values are shown for a particular state of charge in each half-cell. The electrolytes were interchanged after cycle 47.
Thus, as predicted from the results in Fig. 11, interchange of the positive and negative electrolyte streams can considerably lower the overpotential at the negative electrode. The effect is not permanent but the subsequent drift to higher overpotential is slow. Thus, the method shows promise of being a practical means of improving the voltage efficiency of vanadium flow batteries. Furthermore, the resulting decrease in overpotential could improve coulombic efficiency by decreasing side reactions (e.g. H2 evolution) and could improve electrode operational lifespan by decreasing the O2, CO and CO2 evolution and the resulting disintegration of the positive electrode. For example, appropriate valving could be introduced that would enable periodical changing of the electrolyte streams in the stack so that electrodes alternate between being positive and being negative.
A number of other methods could result in improved efficiency for a single-stack system.38 For example, during discharge, the electrolyte could be "over discharged" (with the pumps switched off) so that the electrode potentials correspond to the activation potentials for the respective electrodes (see Fig. 11) causing both the negative and positive electrodes to be reactivated. In this manner, the treatment is performed quickly (since only a fraction of the electrolyte is used), a region of treatment potentials that cause activation can be easily accessed and, in addition, the electrolyte that is left in the reservoirs and tubes can be used to facilitate the re-establishment of state of charge back to normal operating levels without external charging of the electrolyte.
Alternatively this can be done by over discharging the battery while pumping of the electrolyte continues. This is beneficial in that the polarity of the system can be switched without redirecting the electrolyte. It should be noted, however, that if the charge passed during this process is too great, the benefits will be diminished or cancelled.
Conclusions
Carbon fiber microelectrodes provide a useful tool for analyzing flow battery electrode kinetics at fibers from carbon felt electrodes. Linear sweep voltammetry and electrochemical impedance spectroscopy experiments on CFMEs showed that electrode treatments at positive potentials enhance the kinetics of V2+/V3+ and inhibit the kinetics of VO2+/VO2+, while electrode treatments at negative potentials inhibit the kinetics of V2+/V3+ and enhance the kinetics of VO2+/VO2+. The excellent reproducibility of the results after repeated oxidation and reduction treatments indicates that these reversible effects are not due to a change in surface area but due to a change in surface states. XPS analysis showed changes in oxygen-containing species on electrode surfaces after treatment, supporting the suggestion that such species are responsible for the observed effects.
The changes in kinetic rates are significant. After oxidation treatment at +1.5 V (all potentials are vs. MSE), the rate constant ko for V2+/V3+ was an order of magnitude greater than after treatment at −2.0 V. Likewise, after treatment at −2.0 V the rate constant ko for VO2+/VO2+ was about four times greater than after treatment at +1.5 V. The kinetics of VO2+/VO2+ are significantly faster than that of V2+/V3+.
The effects of treatment potential were examined in detail and the reproducibility was excellent at all treatment potentials investigated. In the case of V2+/V3+ the necessary oxidation potential for electrode activation is in the region of about 0.1 V (50% activation after 60 s) while the corresponding reduction potential for deactivation is in the region of about −1.3 V. Likewise, but conversely, in the case of VO2+/VO2+ the necessary reduction potential for electrode activation is in the region of about −0.3 V while the corresponding oxidation potential for deactivation is in the region of about +0.9 V. Thus, for both V2+/V3+ and VO2+/VO2+, there is a considerable shift between the potential for activation and the corresponding potential for deactivation, giving a significant potential range where both an oxidized and a reduced electrode are stable.
These results are consistent with previous findings from our group for various carbon electrode materials22,23 and provide further evidence of the strong effect of electrochemical treatments on kinetics at the felt electrodes used in typical redox flow batteries.
Based on the CFME results, the range of potential experienced by a negative electrode in a flow cell corresponds to a region where it becomes deactivated, suggesting that the kinetics will become slower with time. This observation is supported by flow cell experiments which showed that the overpotential at the negative electrode increases significantly with charge-discharge cycling. Furthermore, the redox potential of the positive electrolyte of the flow cell falls in a region where the CFME results showed that the electrode becomes activated for the V2+/V3+ reaction. This suggests that interchanging the positive and negative electrodes in a flow cell would decrease the overpotential at the negative electrode and so improve the performance. This prediction is supported by flow cell experiments, which showed that the overpotential at the negative electrode (increased after cycling) decreased significantly when the positive and negative electrolytes were interchanged. Flow cell experiments also showed that the overpotential is much smaller at the positive electrode than at the negative, in agreement with the CFME results. Thus, periodic electrolytes interchange (or equivalent alternatives, such overdischarge) shows promise of being a practical means of improving the voltage efficiency of VFBs.
Acknowledgments
The authors acknowledge support from the U. S. National Science Foundation, Sustainable Energy Pathways Program (NSF-1230236) and the Irish Research Council (IRC).
: Appendix
Appendix. Contact angle measurements
Contact angles were measured for various felt samples as a means to quantify wettability of the electrodes. Table AI provides a summary of these results. Electrodes were treated in 3 mol dm−3 H2SO4. After treatment, each electrode was removed from the acid solution, rinsed in deionized water and let dry in air. The results are an average of three (1.0 μl) water droplets at different locations on the felt samples. A decrease in contact angle indicates an increase in felt wettability and "hydrophilic" indicates that the felt completely absorbed the liquid. An increase in hydrophilicity suggests a presence of polar groups on the surface.
Table AI. Contact angles for felt samples after the treatments indicated (all potentials are vs. MSE). Electrodes were treated in 3 mol dm−3 H2SO4, as described in the Experimental section.
| Electrode Treatment | Angle (degrees) |
|---|---|
| Untreated | 126 ± 1.8 |
| Preconditioned | Hydrophilic |
| +1.5 V | Hydrophilic |
| +1.0 V | 102 ± 1.5 |
| −0.9 V | 132 ± 3.1 |
| −2.0 V | 42 ± 5.4 |
As indicated by the results presented in Table AI, the untreated felts were found to be hydrophobic. After preconditioning or treatment at +1.5 V (MSE), the felt samples became hydrophilic. It is important to note that after treatment at −2.0 V, a contact angle of 42° is reported indicating a large increase in wettability; there no explanation for this observation at this time.
Appendix. X-ray photoelectron spectroscopy
X-ray photoelectron spectroscopy was used to investigate the effects of treatment potential on functionalization of the felt surfaces. Similar to contact angle experiments, electrodes were treated in 3 mol dm−3 H2SO4 then rinsed in deionized water and left dry in air. Figure A1 shows typical survey scans of the carbon felt samples; the C1s and O1s peaks at 284.8 eV and 532.8 eV are the major elements present on each sample. High resolution XPS was performed for the C1s and O1s peaks (typical spectra are shown in Fig. A2). The C1s peak located at 284.8 eV was used as the charge reference in determining the binding energies.