Abstract
Model Ni-Cr alloys containing 5, 10, 15, 20, 25 and 30 wt% Cr were oxidized in Ar-20 vol% CO2 gas mixtures at temperatures of 650, 700 and 800°C. In general, multi-layered oxide scales were observed on the surface after reaction. With increased alloy Cr content, the oxide structure changed from external NiO, plus intermediate inner oxides and an internal oxidation zone, to forming a thin chromia band at the base of the oxide scale and, at higher Cr levels, an exclusive chromia scale. Increasing temperature accelerated the oxidation kinetics of low chromium-containing alloys, but significantly reduced the oxidation rate of high chromium alloys by promoting formation of the chromia band/scale. The critical Cr concentration required for chromia scale formation and maintenance decreased with increasing temperature, in accord with diffusion theory. Intergranular carbides were formed in high Cr content alloys, indicating elevated carbon activities beneath the oxide scales.
Export citation and abstract BibTeX RIS

This is an open access article distributed under the terms of the Creative Commons Attribution 4.0 License (CC BY, http://creativecommons.org/licenses/by/4.0/), which permits unrestricted reuse of the work in any medium, provided the original work is properly cited.
In conventional power plants, fossil fuels are burnt in air to generate electricity. This process is of low cost, but can produce a large amount of CO2 gas, a principal contributor to global warming. To reduce CO2 emissions, a new technology called oxy-fuel combustion has been developed. In this process, coal is burnt in a mixture of oxygen and recirculated flue gas, so the finally released flue gas consists mainly of CO2 and water vapor. After condensation of water vapor, sequestering CO2 gas from the flue gas is relatively easy.
Unfortunately, this technology has the potential to exacerbate the corrosion problems encountered in power plants. The CO2 gas has been found to be very corrosive to the steels of the critical heat exchanging components in boilers, producing severe oxidation and carburization of ferritic-martensitic steels. Exposed to this atmosphere, the chromia-forming steels which are used successfully in air, undergo breakaway oxidation and carburization.1–4
In addition, increased operating temperatures to improve boiler heat efficiency are desirable to meet continuously increasing energy demand, e.g. in advanced ultra-supercritical power generation. As a result, the ferritic/martensitic and even austenitic steels currently used in traditional coal-fired power plants will not survive when the operating temperature increases to values higher than 650°C.5–7 Under these circumstances, nickel-based alloys are alternative candidate materials, owing to their superior creep strength and corrosion resistance at higher temperatures. However, little is known about the corrosion behavior of Ni-based alloys in CO2-rich gases at high temperatures.
The oxidation of various model Ni-Cr alloys in air and oxygen has been well investigated at temperatures between 800 and 1200°C,8–13 and the oxidation of these alloys in H2O-containing environments has also been reported.14–17 In air and oxygen environments, it has been generally accepted that binary Ni-Cr alloys with Cr contents lower than 10 wt% oxidize more rapidly than pure nickel does owing to the increased concentration of cation vacancies in the NiO scale.9,11,13 However, a Cr level of approximately 20 wt% in nickel leads to greatly reduced oxidation rates, because of the formation of a continuous layer of Cr2O3 at 900°C.10 Alloys containing 30 wt% or more of Cr are able to develop a protective chromia layer, and much lower oxidation rates result.10,11 Addition of water vapor to dry oxygen-based gases hinders the formation of protective chromia scale, resulting in increased oxidation rates for Ni-10Cr and Ni-20Cr alloys.14 The chromia scales on Ni-25Cr alloy after reaction in Ar-O2 and Ar-H2O gas mixtures exhibited different morphologies, coarse and equi-axed grains in the former environment but fine and columnar grains in the latter.15,16 It was proposed that this could be related to the differences in oxygen partial pressure ( ) in the atmosphere and the incorporation of hydrogen into the scale.17 In contrast, the oxidation behavior of binary Ni-Cr alloys in CO2-rich gases has received little attention. A preliminary investigation performed at 700°C has already revealed complex reaction morphologies which vary with alloy Cr content.18
In this paper, the oxidation behavior of model binary Ni-Cr alloys in Ar-CO2 gases within the temperature range 650–800°C has been investigated. The main purpose is to define the effect of temperature on the growth kinetics and microstructures of the oxide scales, and to understand the relationship between them. Because laboratory experiments are relatively short, alloy oxidation behavior can be dominated by the surface preparation employed. In order to simulate the conditions expected after long periods in service, the alloy surfaces were exposed in an electropolished state, to ensure that their reaction products reflected lattice diffusion rather than the accelerated diffusion resulting initially from cold working.
Experimental
Six model alloys, Ni-5, 10, 15, 20, 25 and 30 Cr (all in wt%) were prepared by arc melting pure metals Ni (99.99%) and Cr (99.995%) under a protective Ar-5%H2 gas atmosphere, using a non-consumable electrode. Cast alloy buttons were annealed at 1100°C for 50 h under flowing Ar-5%H2 gas for homogenization and then slowly cooled in the furnace. Alloy grains after annealing were coarse and irregular, with an average size of about 1.0∼1.5 mm for Ni-5Cr and Ni-10Cr, 0.5∼1.0 mm for Ni-15Cr and Ni-20Cr, 0.2∼0.5 mm for Ni-25Cr and Ni-30Cr alloys. Analysis by X-ray diffraction confirmed that all alloys were single-phase austenitic. Rectangular alloy specimens with the approximate size of (12–15) mm × (6–8) mm × (0.8–1.2) mm were ground to a 1200 grit finish, polished down to a 3 μm finish and then electropolished in 15% concentrated hydrochloric acid to remove the work hardened surface region. Finally, all the specimens were ultrasonically cleaned with ethanol prior to exposure.
Isothermal corrosion experiments were carried out in a vertical furnace at atmospheric pressure. Test specimens were exposed to a flowing Ar-20%CO2 (vol %) mixture with a linear gas flow rate of about 2 cm/s at 650°C, 700°C and 800°C for up to 500 h. Before reaction, the quartz reactor was purged with pure argon for 1 h to expel atmospheric oxygen, and then the furnace started to heat at a rate of 70°C/min and maintained at the required temperature. After that, the furnace was lifted to position the samples into the hot zone and the reaction gas was introduced subsequently. After uninterrupted isothermal exposure for the desired time, the furnace was lowered to leave the samples out of the furnace for rapid cooling to room temperature. Equilibrium oxygen and carbon potentials of the reaction gas were calculated using FactSage 7.0 software,19 and are shown in Table I.
Table I. Equilibrium oxygen and carbon potentials of the reaction gas at 1 atm.
| T (°C) |  (atm) (atm) |
ac |
|---|---|---|
| 650 | 5.0 × 10⁻⁹ | 1.6 × 10⁻¹⁵ |
| 700 | 1.8 × 10⁻⁸ | 6.4 × 10⁻¹⁵ |
| 800 | 1.5 × 10⁻⁷ | 6.8 × 10⁻¹⁴ |
Weight changes of oxidized samples were measured with an analytical balance (Mettler Toledo XP205) with an accuracy of 0.01 mg. Each point in the weight gain curves shown in this work represents a separate sample. Corrosion products after exposure were characterized using X-ray diffraction (XRD; PANanalytical Xpert MPD) with Cu-Kα radiation, optical microscopy (OM), and scanning electron microscopy (SEM; Hitachi S3400) equipped with energy dispersive X-ray spectroscopy (EDS; Bruker). Etchant solutions of hydrochloric acid and nitric acid at a volume ratio of 5:1 were used to reveal any carbides precipitated in the alloy matrix. For cross-section analysis, selected oxidized samples were mounted in epoxy resin before sectioning, and then metallographically ground and polished to 0.1 μm.
Results
Kinetics at different temperatures
Oxidation kinetics determined by weight gain measurements are shown in Figure 1. In general, these weight gains can be approximated by parabolic kinetics, expressed by the equation:
![Equation ([1])](https://content.cld.iop.org/journals/1945-7111/164/6/C285/revision1/d0001.gif)
where ΔW/A is the weight gain per unit surface area of the tested specimen, kw is the parabolic rate constant, and t is the oxidation time. Table II summarizes the parabolic rate constants for the various alloys at different temperatures, found by linear regression on Eq. 1. Kinetic data at 800°C for Ni-20Cr was too irregular to treat this way. The slow kinetics observed for the 25 and 30 wt% Cr alloys were approximated as parabolic, with rate constants found by regression.
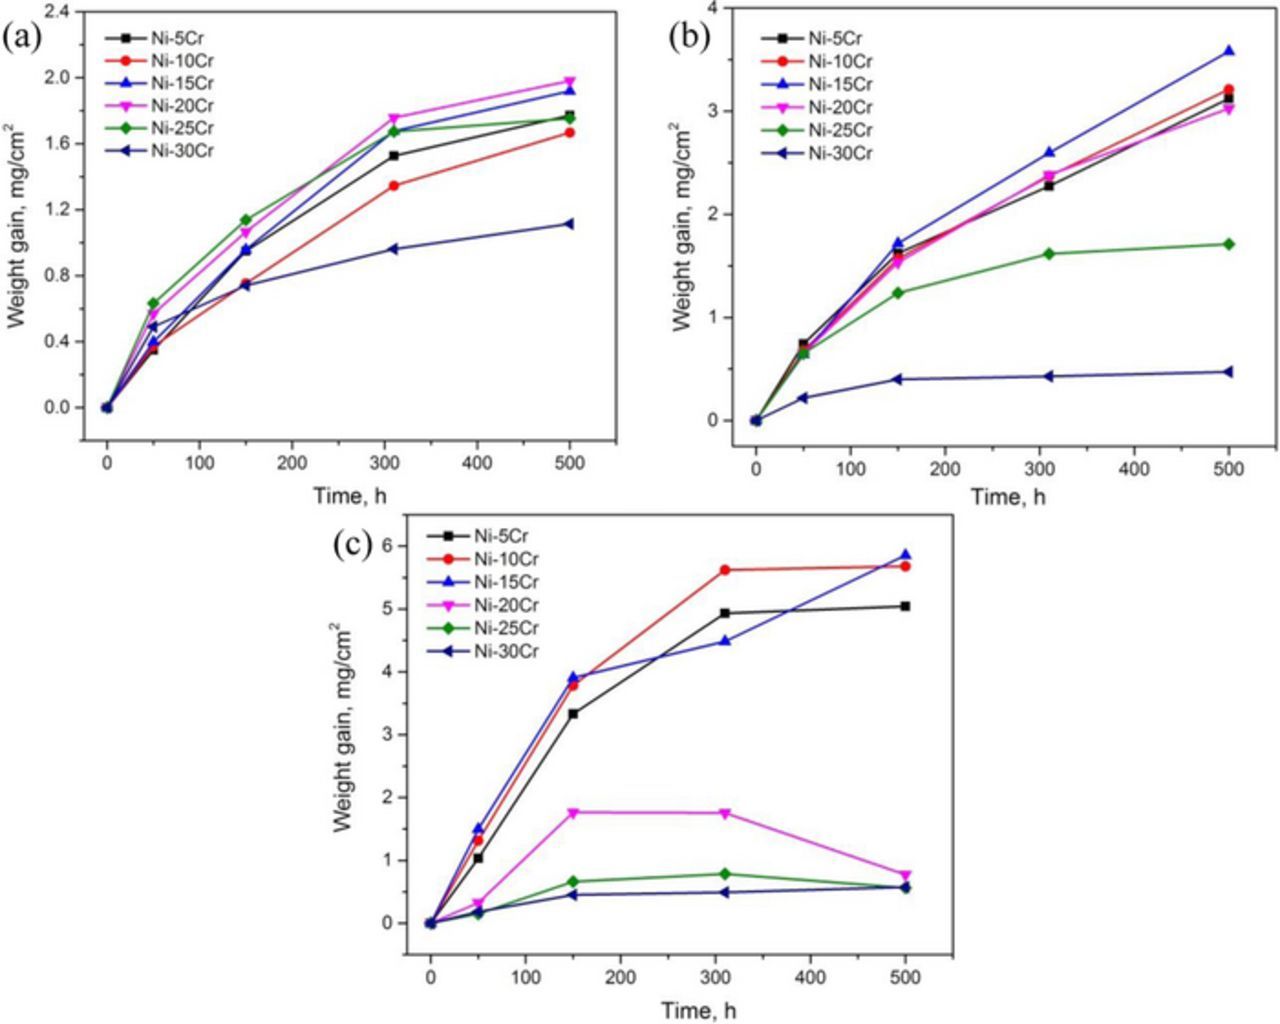
Figure 1. Alloy weight gain kinetics in Ar-20%CO2 at (a) 650°C, (b) 700°C, and (c) 800°C.
Table II. Parabolic rate constants (kw (10−13g2cm−4s−1)) of weight gain kinetics.
| T (°C) | Ni-5Cr | Ni-10Cr | Ni-15Cr | Ni-20Cr | Ni-25Cr | Ni-30Cr |
|---|---|---|---|---|---|---|
| 650 | 9.1 | 7.6 | 10.7 | 11.6 | 9.8 | 3.8 |
| 700 | 25.8 | 27.3 | 33.5 | 25.1 | 9.4 | 0.7 |
| 800 | 82.3 | 105.4 | 96.5 | * | 1.6 | 1.0 |
It is obvious that temperature exerted a significant effect on the oxidation kinetics of these alloys in Ar-CO2 gas mixtures. Generally, weight gain rates increased with increasing temperature for alloys with Cr concentrations ranging from 5 to 15 wt%. At 650°C, the weight gain rates showed no significant change when Cr concentrations increased from 5 to 25 wt% (Fig. 1 and Table II). Further increasing Cr to 30 wt% led to an apparent rate decrease. Similar effects are observed also at 700 and 800°C, but the critical chromium content for the occurrence of this significant rate decrease changed to lower values: 25 wt% at 700°C and 20 wt% at 800°C (Fig. 1 and Table II). Further increasing alloy chromium content above the critical chromium concentration led to a further rate decrease (Table II).
Oxide scales formed at 650°C
Figure 2 shows the surface XRD patterns obtained from samples exposed for 500 h at 650°C in Ar-20%CO2. The oxide formed on the surface of Ni-5Cr alloy was mainly NiO, and Cr2O3 peaks were not identified in this case. For the alloys containing 10 to 25 wt% chromium, Cr2O3 peaks were detectable but NiO was still the predominant phase, as shown by the peak intensities. As the chromium content of the alloys increased to 30 wt%, the Cr2O3 peak intensities increased, although NiO was still present. It is also noteworthy that the alloy substrate was clearly detected for Ni-30Cr, indicating the formation of a much thinner oxide scale. This decrease in the thickness of the oxide scale corresponds with the slowest oxidation rate observed for this alloy at 650°C, as reflected in Fig. 1 and Table II.
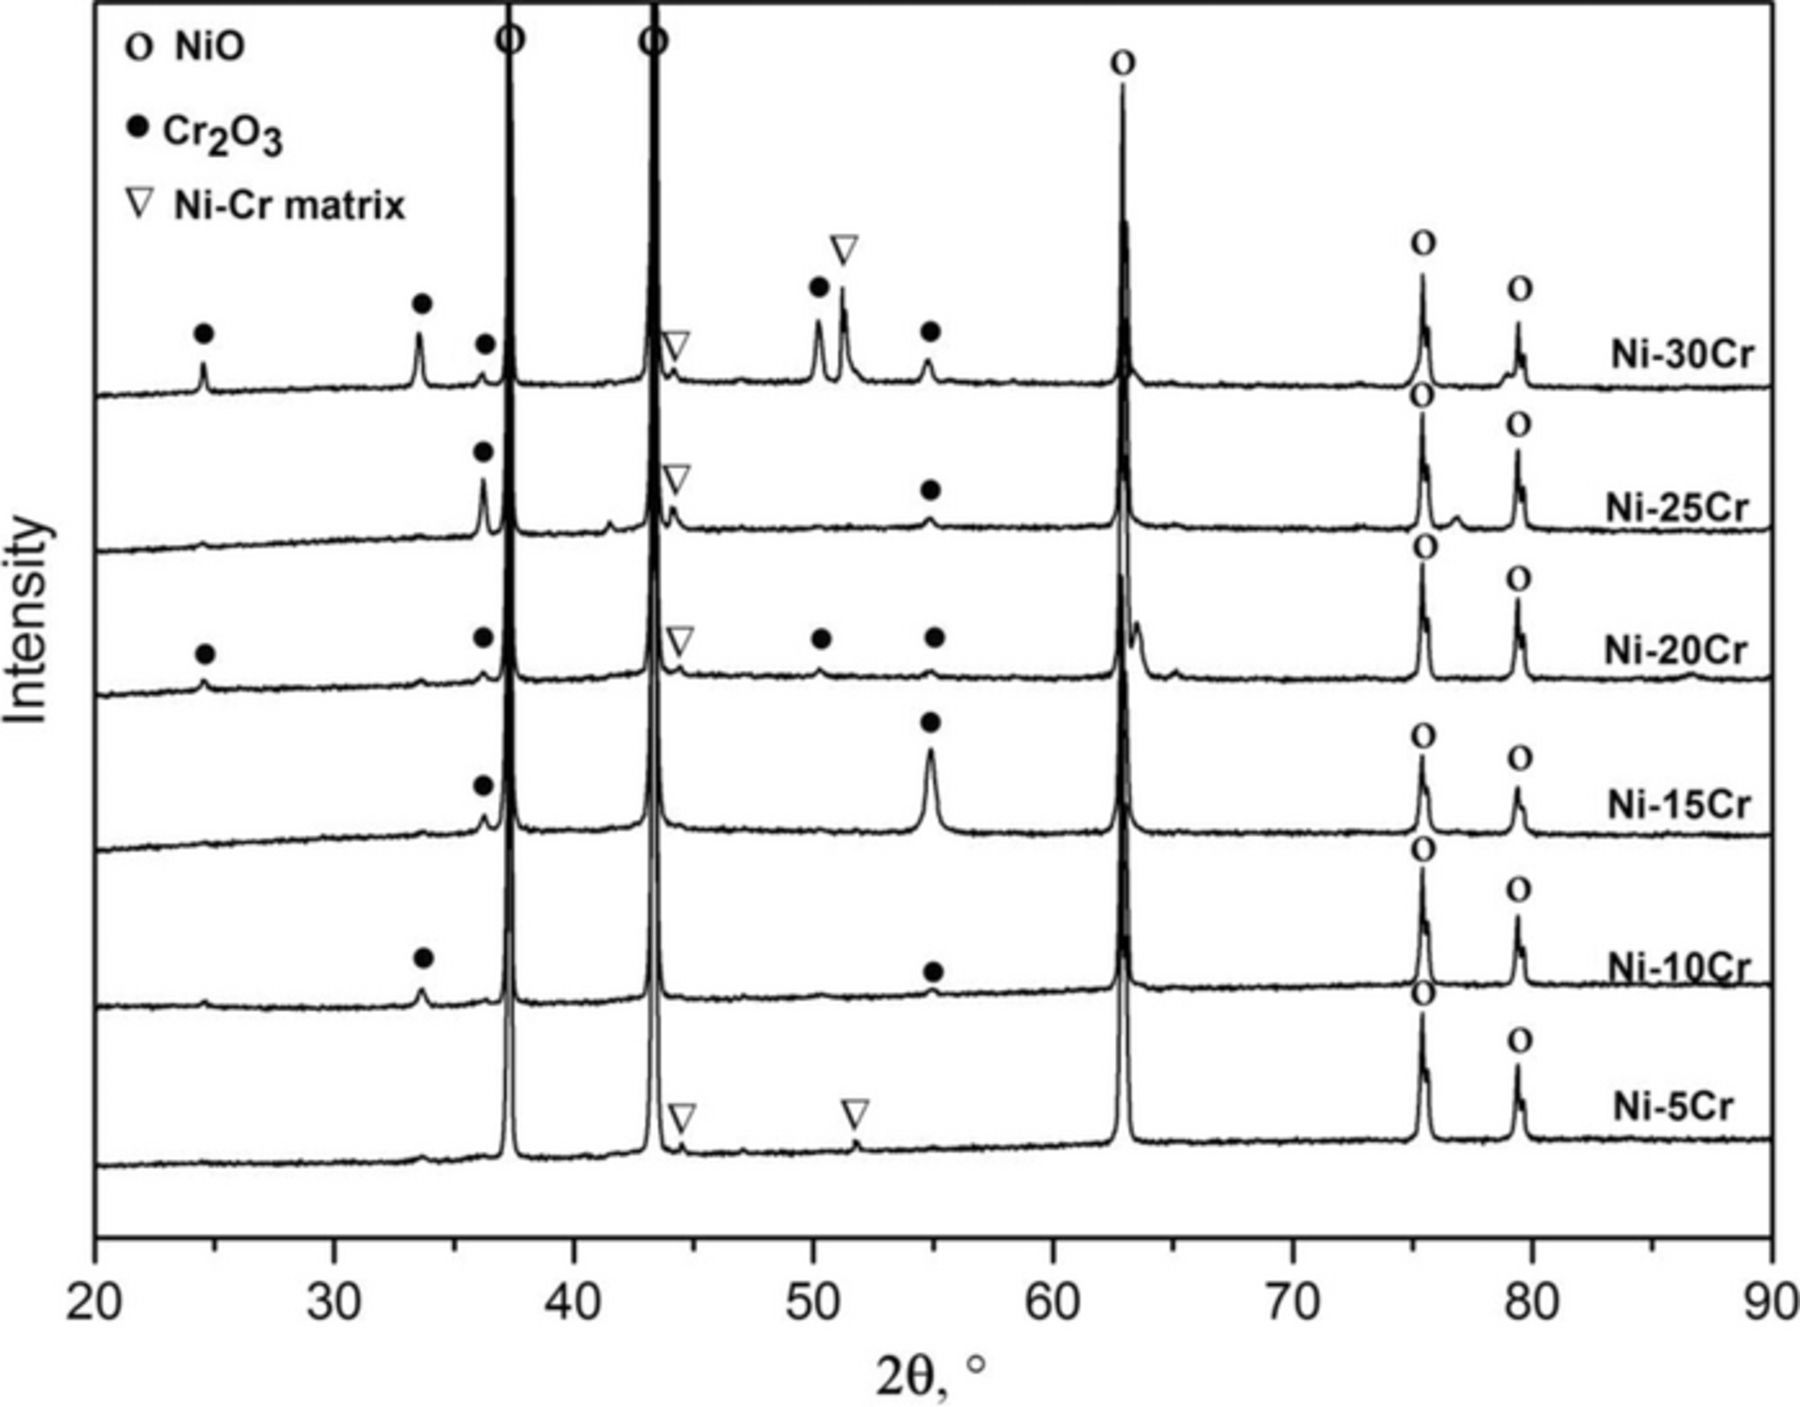
Figure 2. XRD patterns of the alloys after exposure to Ar-20%CO2 at 650°C for 500 h.
BSE-SEM cross-section images of the tested alloys after reaction for 500 h in Ar-20%CO2 at 650°C are shown in Figs. 3a–3f. It can be seen that all the alloys developed multi-layered structures on their surfaces during oxidation. For alloys containing 15 wt% Cr or less, an inner oxide layer was observed between an external NiO layer and an internal oxidation zone (IOZ). The inner oxide layer on Ni-5Cr was relatively thin, and developed a nonplanar interface with the IOZ. Its IOZ was characterized by many dendritic shaped Cr-rich precipitates penetrating into the alloy matrix to a certain depth. This morphology has been reported previously for Ni-Cr alloys reacted in air and oxygen.20,21 In contrast, the IOZ of Ni-10Cr and Ni-15Cr alloys contained very fine oxide precipitates. The inner layer formed on Ni-10Cr was continuous and comparable to the outer layer in thickness, but that on Ni-15Cr was discontinuous and disrupted by IOZ regions. Quantitative EDS analysis results for the scales formed on Ni-15Cr are shown in Table III. It is apparent that the outer layer contained essentially Ni and O, the inner layer a high O concentration, and the IOZ a high Ni concentration.
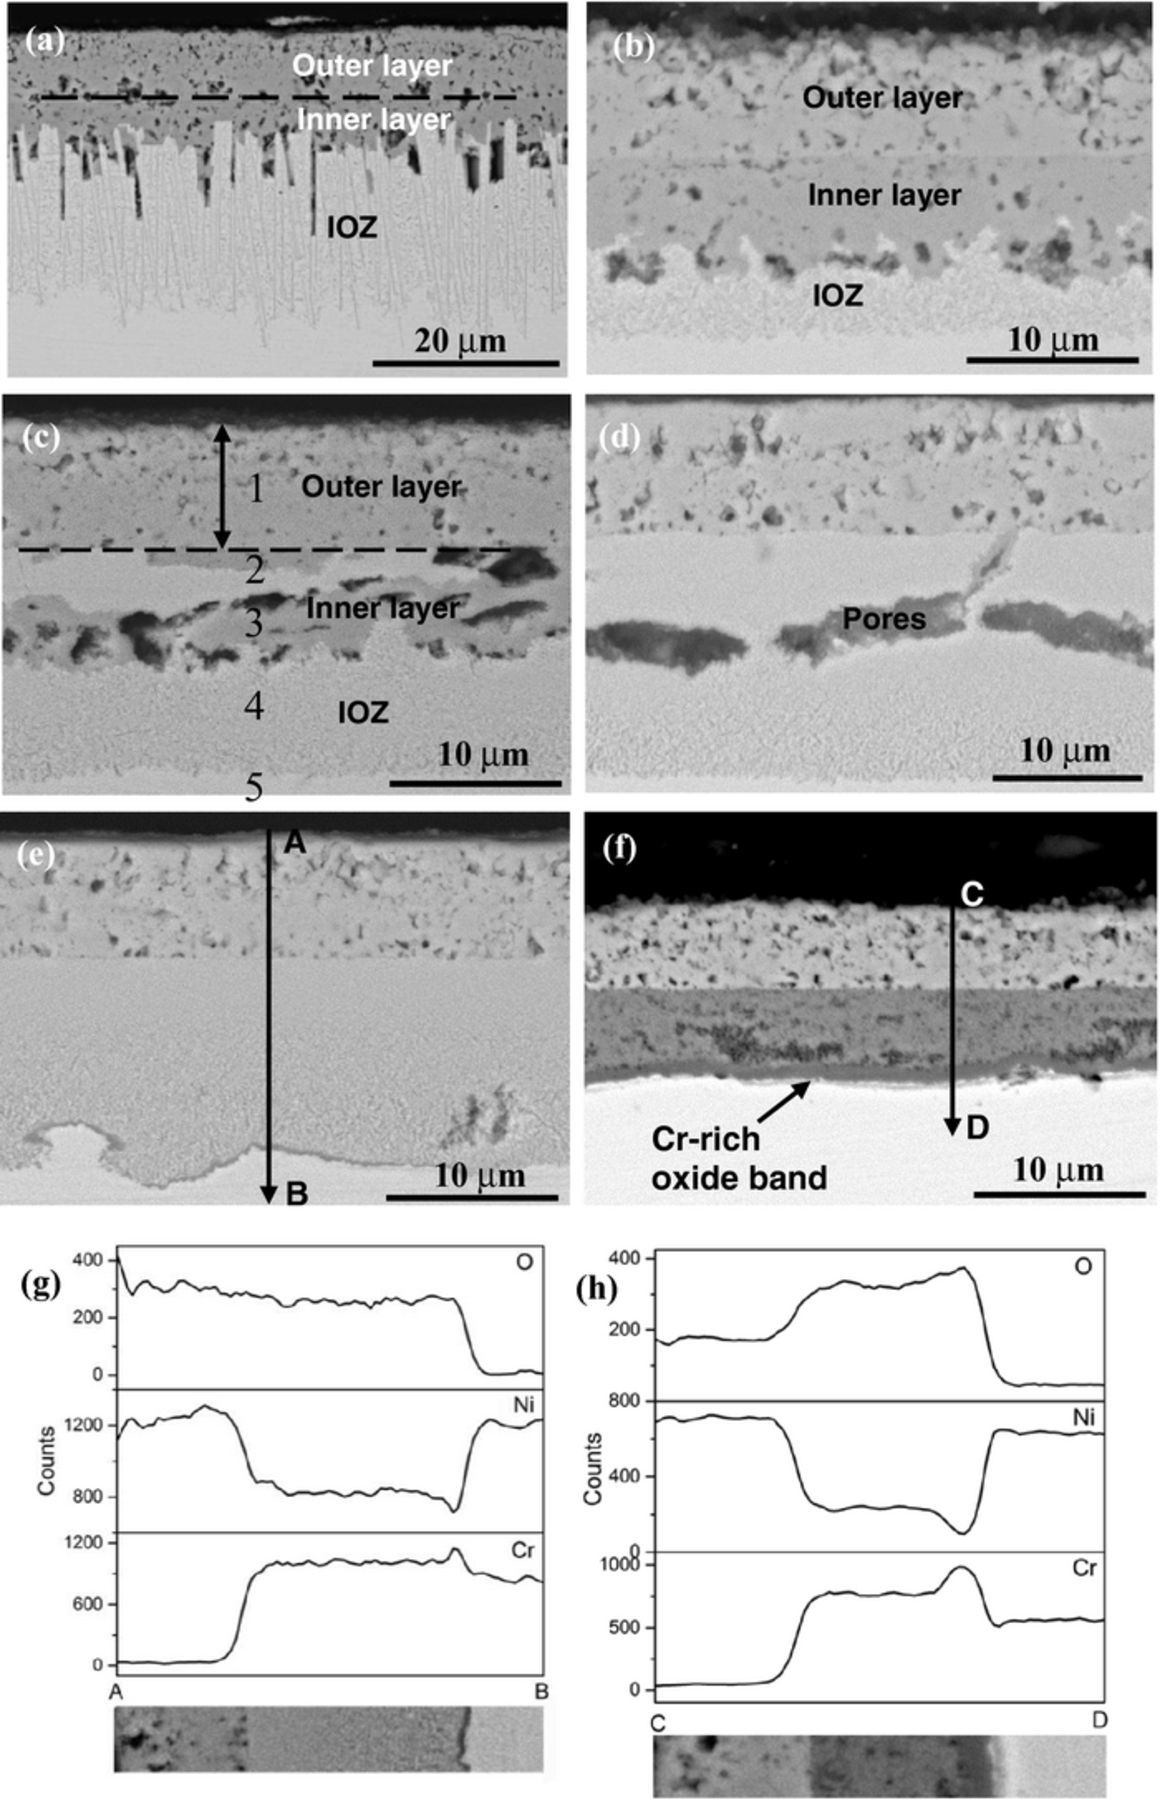
Figure 3. BSE-SEM images of alloy cross-sections after 500 h exposure in Ar-20%CO2 at 650°C: (a) Ni-5Cr, (b) Ni-10Cr, (c) Ni-15Cr with points 1–5 related to the EDS results shown in Table III, (d) Ni-20Cr, (e) Ni-25Cr, and (f) Ni-30Cr; (g) and (h) EDS line scan profiles in (e) and (f), respectively.
Table III. EDS composition analysis results of scales in Fig. 3c (at %).
| Locations | Ni | Cr | O |
|---|---|---|---|
| Outer layer | 54.71 | 0.50 | 44.79 |
| Inner layer | 32.63 | 16.38 | 50.99 |
| IOZ | 60.39 | 16.97 | 22.64 |
In order to identify the phases present in the respective layers, the sample surface was subjected to successive grinding and XRD analysis until the alloy substrate was reached. The XRD patterns presented in Fig. 4 were collected during this process, and their corresponding locations in the scale are marked approximately in Fig. 3c. Clearly the scale consisted of an outer NiO layer, an inner NiO and Cr2O3 mixed layer, and an internally oxidized zone containing Cr2O3 precipitates located below the scale. No NiCr2O4 spinel was found at this temperature. Because the alloys of Ni-5Cr and Ni-10Cr developed Cr-rich inner layers similar to that of Ni-15Cr, it is supposed that their inner layers were of the same phase constitution.

Figure 4. XRD patters obtained from the serial grinding of the scale formed on Ni-15Cr alloy at 650°C.
Unlike the cases of the alloys described above, the inner oxide layer nearly disappeared when the Cr content of the alloy was increased to 20 wt%, and only very small scattered islands are occasionally seen to connect with pores close to the original alloy surface (Fig. 3d). When the Cr concentration was further increased to 25 wt%, the inner oxide layer disappeared completely, and a thin, semi-continuous band was formed at the IOZ precipitation front. Figure 3g reveals a higher Cr concentration in this band, implying that it consisted of Cr-rich oxides. The IOZ depth was less at some locations where the band had formed than at other places where it was absent (Fig. 3e). This Cr-rich oxide band became continuous, uniform and of an appreciable thickness when the alloy contained 30 wt% Cr. The EDS line profiles shown in Fig. 3h confirmed this band to be Cr enriched, and the corresponding EDS quantitative analysis results indicated that this band had an atomic ratio of Cr to O of 1:1.42. Therefore, it is reasonably inferred that the oxide band formed at the reaction zone base was Cr2O3.
To study the detailed process of chromia band formation and development, BSE-SEM cross-sections of Ni-25Cr and Ni-30Cr alloys were produced after different exposure times (Figs. 5 and 6, respectively). After 50 h reaction, two layers were formed on the surface of Ni-25Cr, with a thin external NiO layer surmounting an internal oxidation zone (Fig. 5a). With increased reaction time, this two-layered structure remained unchanged, but the thickness of both layers increased. In addition, small regions of oxide band had formed locally at the IOZ-alloy interface after 150 h reaction (Fig. 5b). The coverage of these bands increased with the reaction time and reached about 57% of the whole interface after 500 h reaction, as shown in Fig. 5d and Table IV. The thickness of the two major layers as a function of the square root of time is shown in Fig. 5e. The thickening kinetics of both layers approximately obeyed the parabolic law:
![Equation ([2])](https://content.cld.iop.org/journals/1945-7111/164/6/C285/revision1/d0002.gif)
where X represents layer thickness.

Figure 5. BSE-SEM images of Ni-25Cr alloy after reaction at 650°C for different times: (a) 50 h, (b) 150 h, (c) 310 h, and (d) 500 h; (e) corresponding scale thickening kinetics.
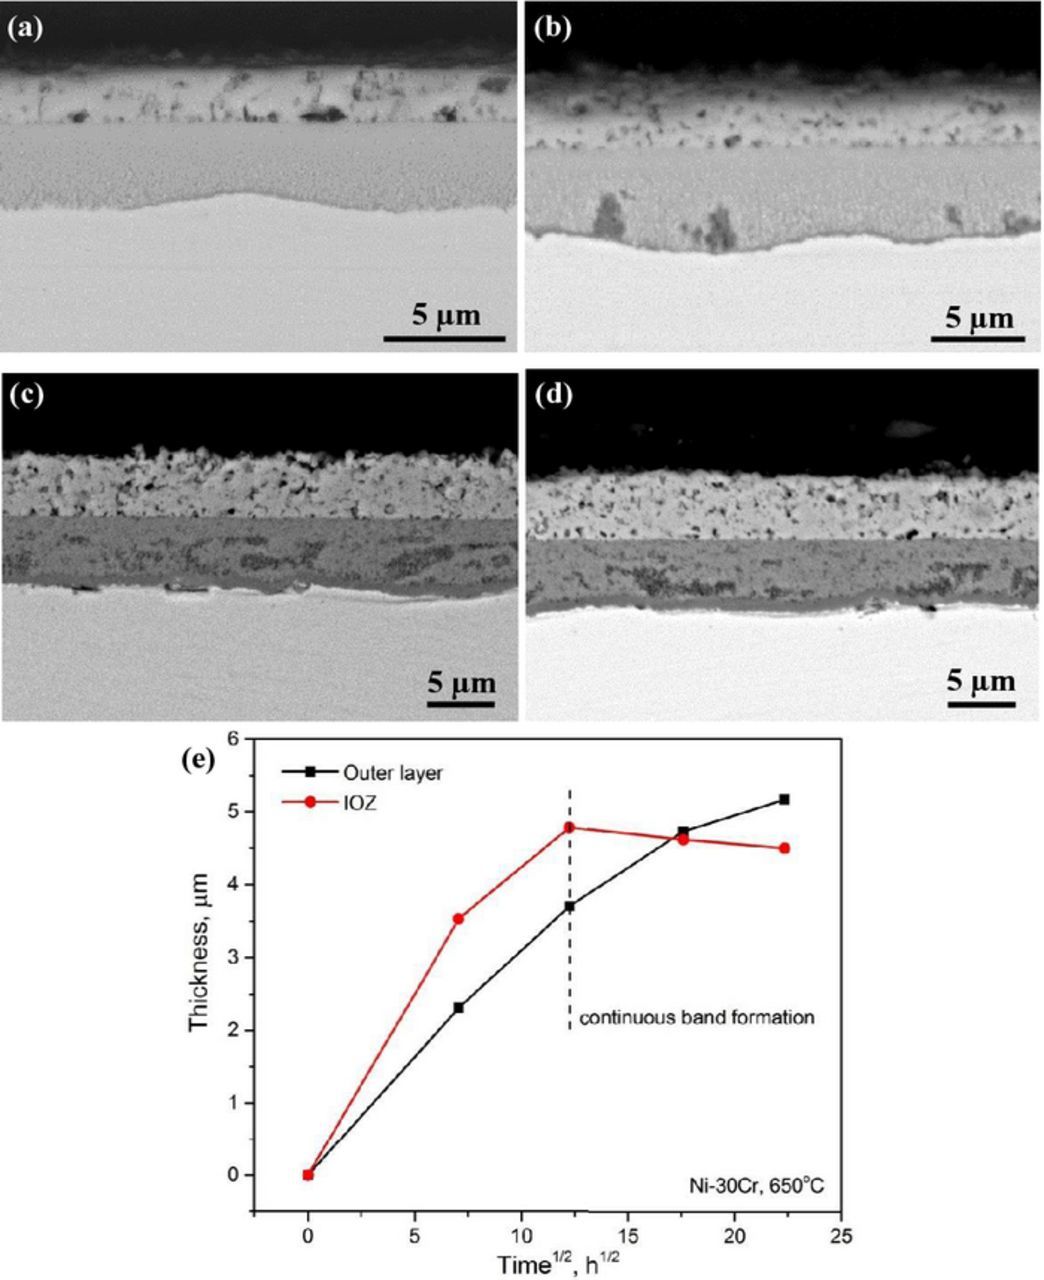
Figure 6. BSE-SEM images of Ni-30Cr alloy after reaction at 650°C for different times: (a) 50 h, (b) 150 h, (c) 310 h, and (d) 500 h; (e) corresponding scale thickening kinetics.
Table IV. Coverage of chromia band at the reaction zone/alloy interface (%) for Ni-25Cr alloy.
| Reaction time (h) | ||||
|---|---|---|---|---|
| T (°C) | 50 | 150 | 310 | 500 |
| 650 | 0 | 21.5 | 36.5 | 56.6 |
| 700 | 21.1 | 91.4 | 100 | 100 |
For Ni-30Cr alloy, chromia band regions of appreciable length were formed at the reaction zone base, even when the oxidation time was as short as 50 h (Fig. 6a). The band became essentially continuous and covered the whole IOZ-alloy interface when the exposure time increased to 150 h (Fig. 6b), and the average IOZ thickness increased during this period. With further increases in experimental time, the continuous chromia band thickened (Figs. 6c and 6d). With the development of this continuous band at the reaction front, the IOZ on Ni-30Cr ceased to grow (Fig. 6e). It is noted that the IOZ shown in Figs. 6c and 6d appears darker than those shown in Figs. 6a and 6b, indicating a lower average atomic number under BSE image mode. Corresponding EDS analysis did reveal that the oxygen concentration of IOZ increased from about 15 to 25 wt% as the reaction time increased from 150 to 310 h. Although the measurement is only semi-quantitative, the large increase in oxygen uptake is attributed to the reaction of Ni in the former IOZ to NiO. The higher oxygen potential required for this reaction comes about because the underlying continuous chromia band acts as a barrier to inward oxygen diffusion.
Oxide scales formed at 700°C
The surface XRD patterns obtained at 700°C (not shown here) confirmed that the oxide phases on different alloys were similar to their counterparts at 650°C. BSE-SEM cross-sections of the alloys reacted for 500 h in Ar-20%CO2 at 700°C are shown in Fig. 7. Compared with those formed at 650°C, the morphologies and microstructures of scales grown on alloys of Ni-5Cr and Ni-10Cr at 700°C were essentially the same, except that the density of acicular precipitates in the IOZ of Ni-5Cr increased and many globular and short rod-shaped precipitates appeared at the precipitation front. The inner oxide layer on Ni-15Cr became more continuous at 700°C, and also the corresponding layer on Ni-20Cr accounted for a larger volume fraction near the outer-inner layer interface than that at 650°C. At 700°C, the innermost Cr-rich oxide band formed by Ni-25Cr, which was discontinuous at 650°C, became continuous and uniform. In the case of Ni-30Cr, an obvious chromia subscale was developed underneath the outer NiO layer. These observations are consistent with earlier results obtained at 700°C.18
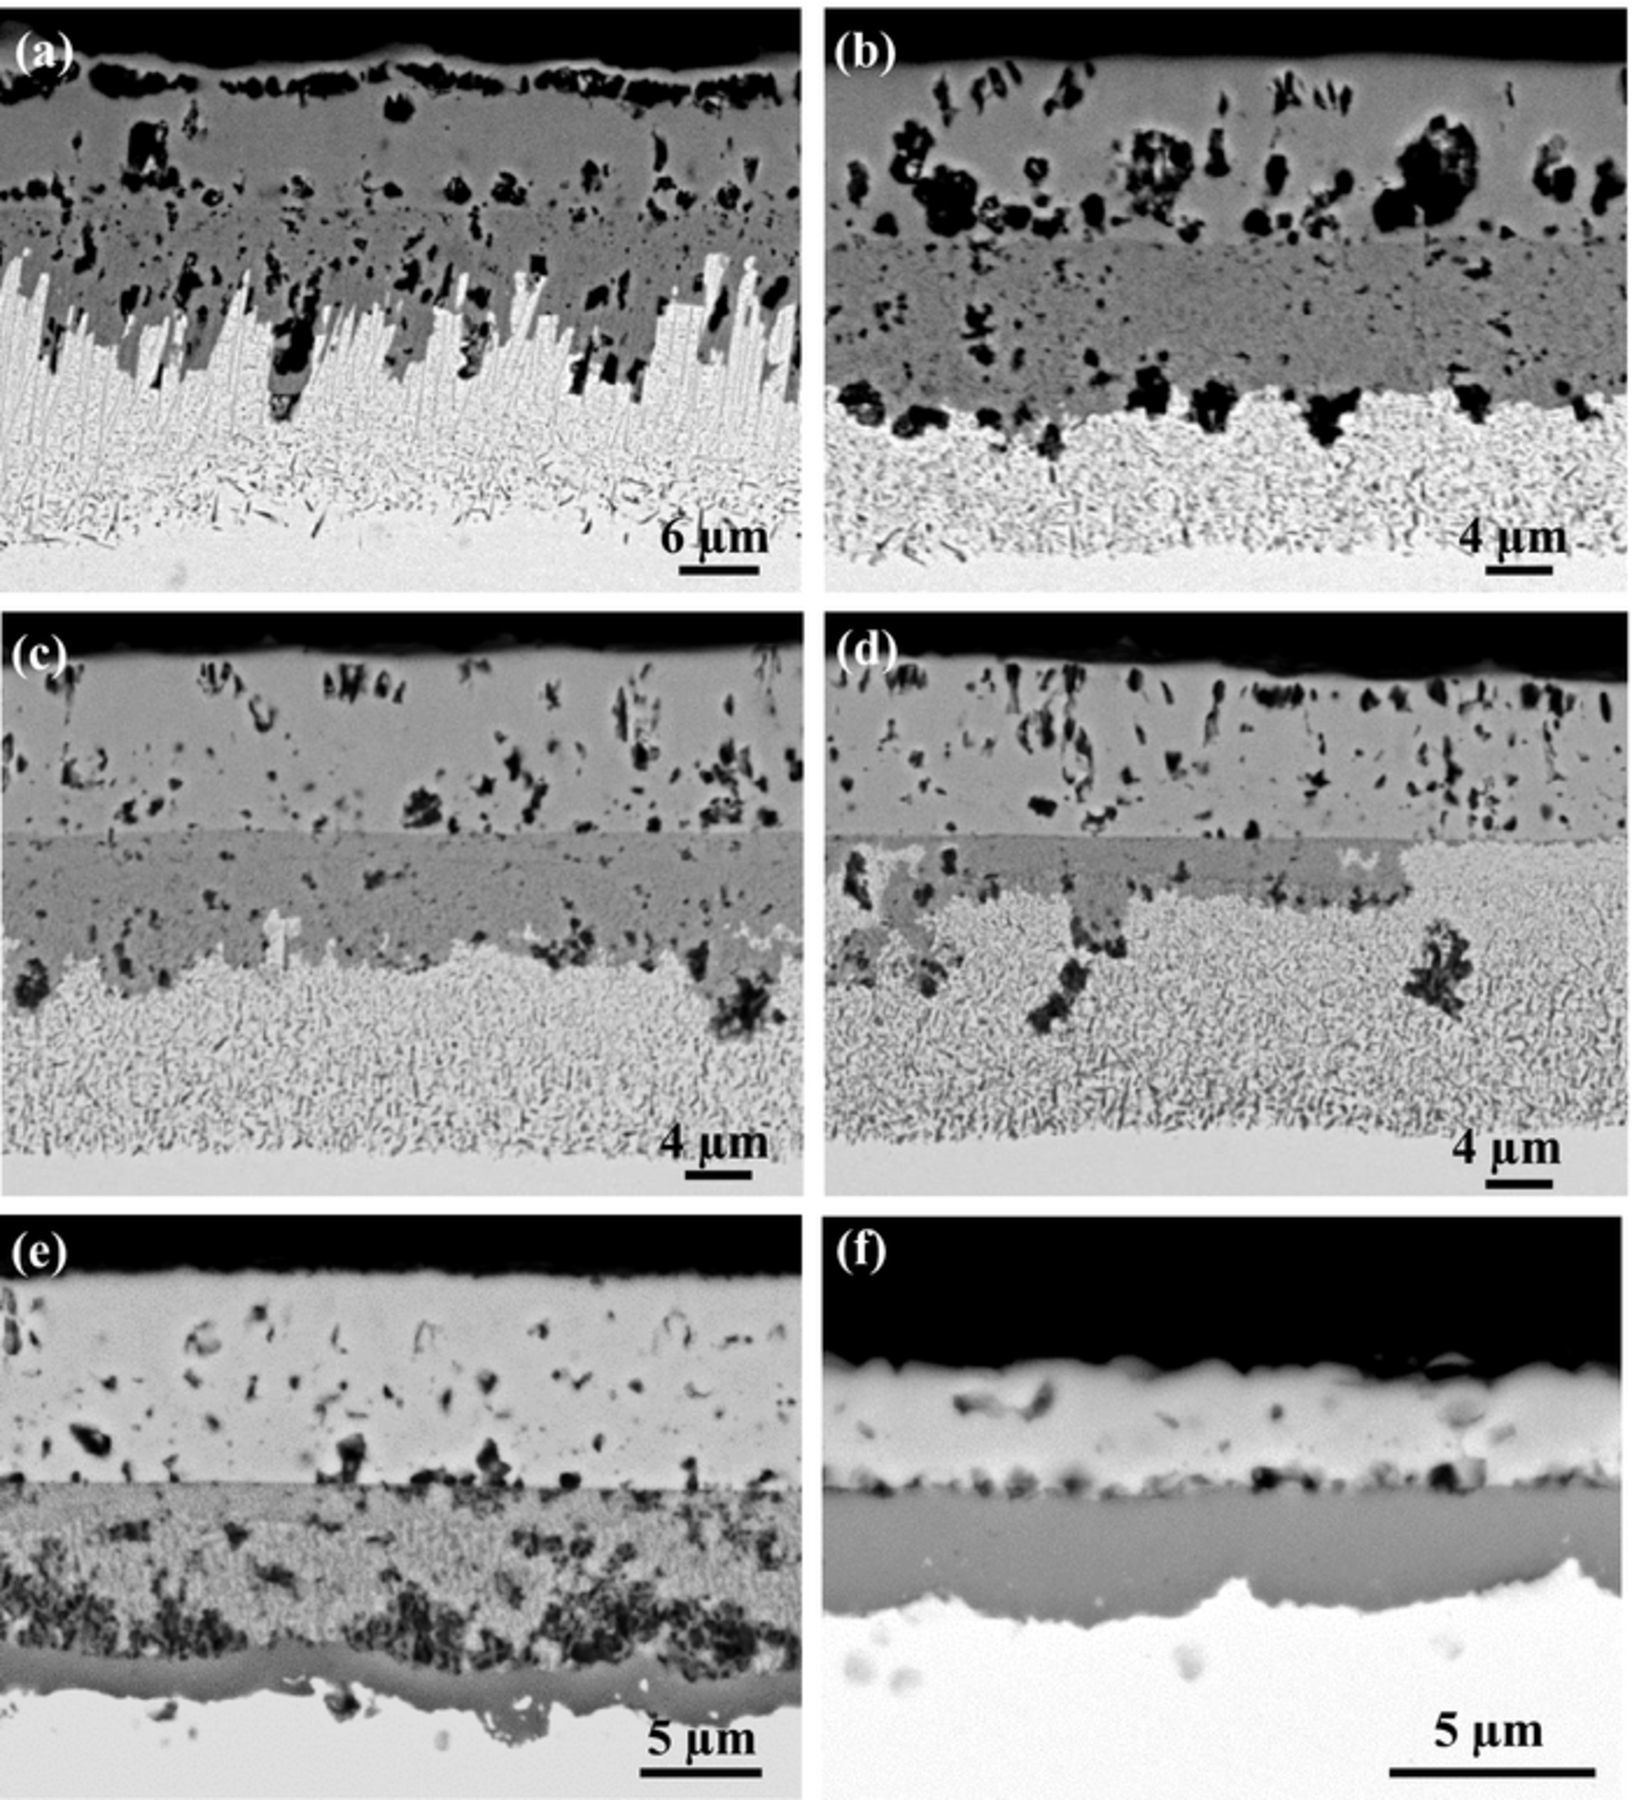
Figure 7. BSE-SEM images of alloys after 500 h exposure in Ar-20%CO2 at 700°C: (a) Ni-5Cr, (b) Ni-10Cr, (c) Ni-15Cr, (d) Ni-20Cr, (e) Ni-25Cr, and (f) Ni-30Cr.
The evolution of oxidation products grown on Ni-25Cr and Ni-30Cr alloys is shown in Figs. 8 and 9, respectively. The same process of chromia band growth on Ni-25Cr observed at 650°C (Fig. 5) was found to take place at an accelerated rate at 700°C. Discrete chromia patches were formed at the base of the IOZ after 50 h exposure (Fig. 8a), then thin, presumably continuous and uniform, completely continuous chromia bands were developed after 150 and 310 h, respectively (Figs. 8b and 8c). The process of forming a continuous chromia band was much faster at 700°C, as shown by the area fraction measurements in Table IV. As with the IOZ of Ni-30Cr formed at 650°C, the IOZ developed by Ni-25Cr after exposure for 500 h (Fig. 8d) was darker than that after 150 h exposure (Fig. 8b), with a roughly 10 wt% increase in oxygen concentration detected. The growth kinetics of the NiO layer and IOZ are shown in Fig. 8e. Their thickening kinetics were approximately parabolic up to 310 h, but slowed greatly afterwards.
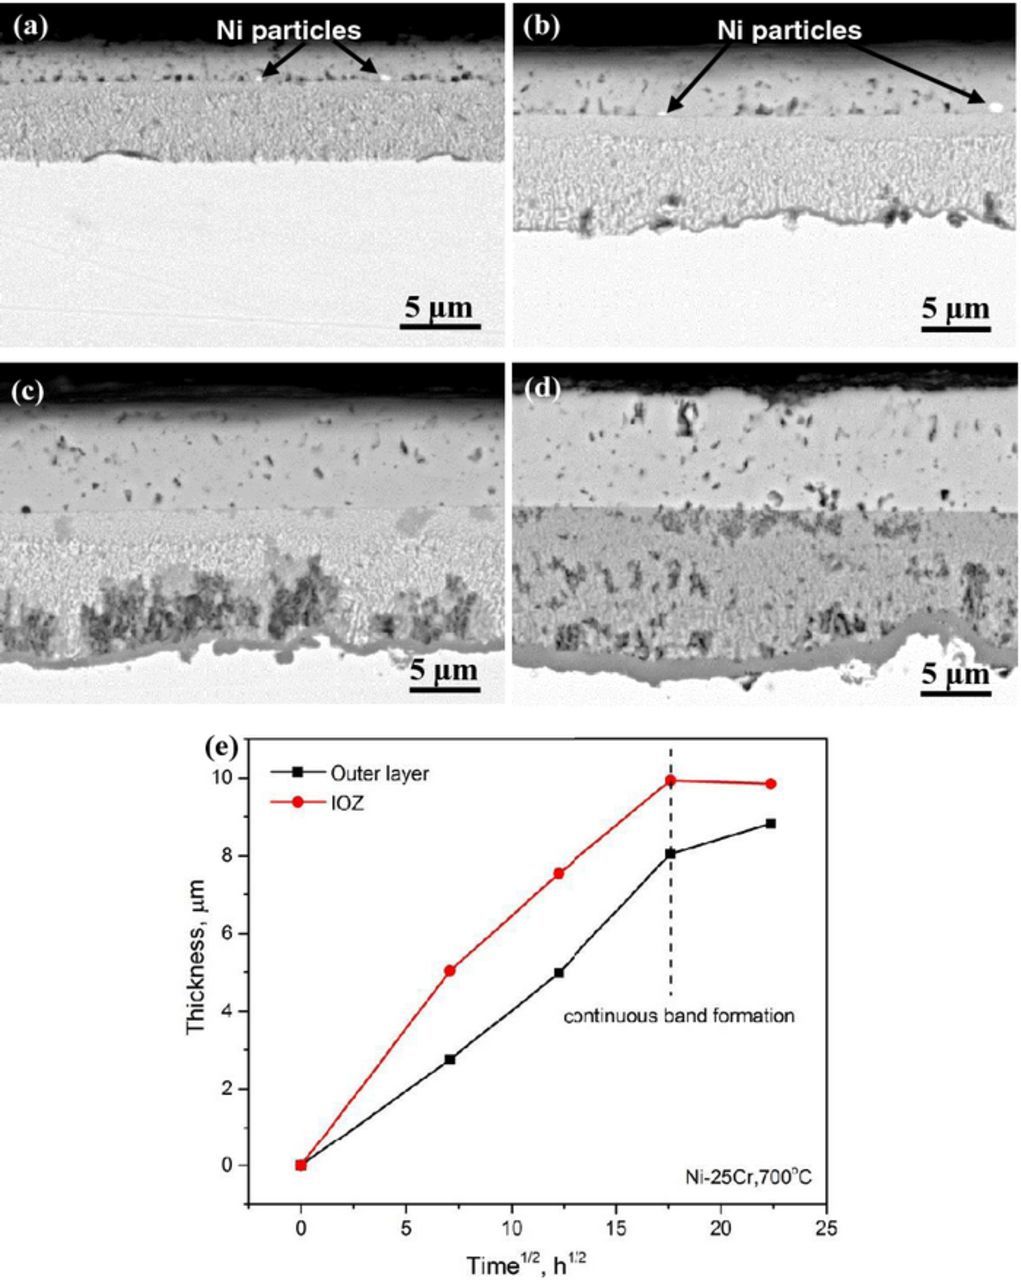
Figure 8. BSE-SEM images of Ni-25Cr alloy after reaction at 700°C for different times: (a) 50 h, (b) 150 h, (c) 310 h, and (d) 500 h; (e) corresponding scale thickening kinetics.
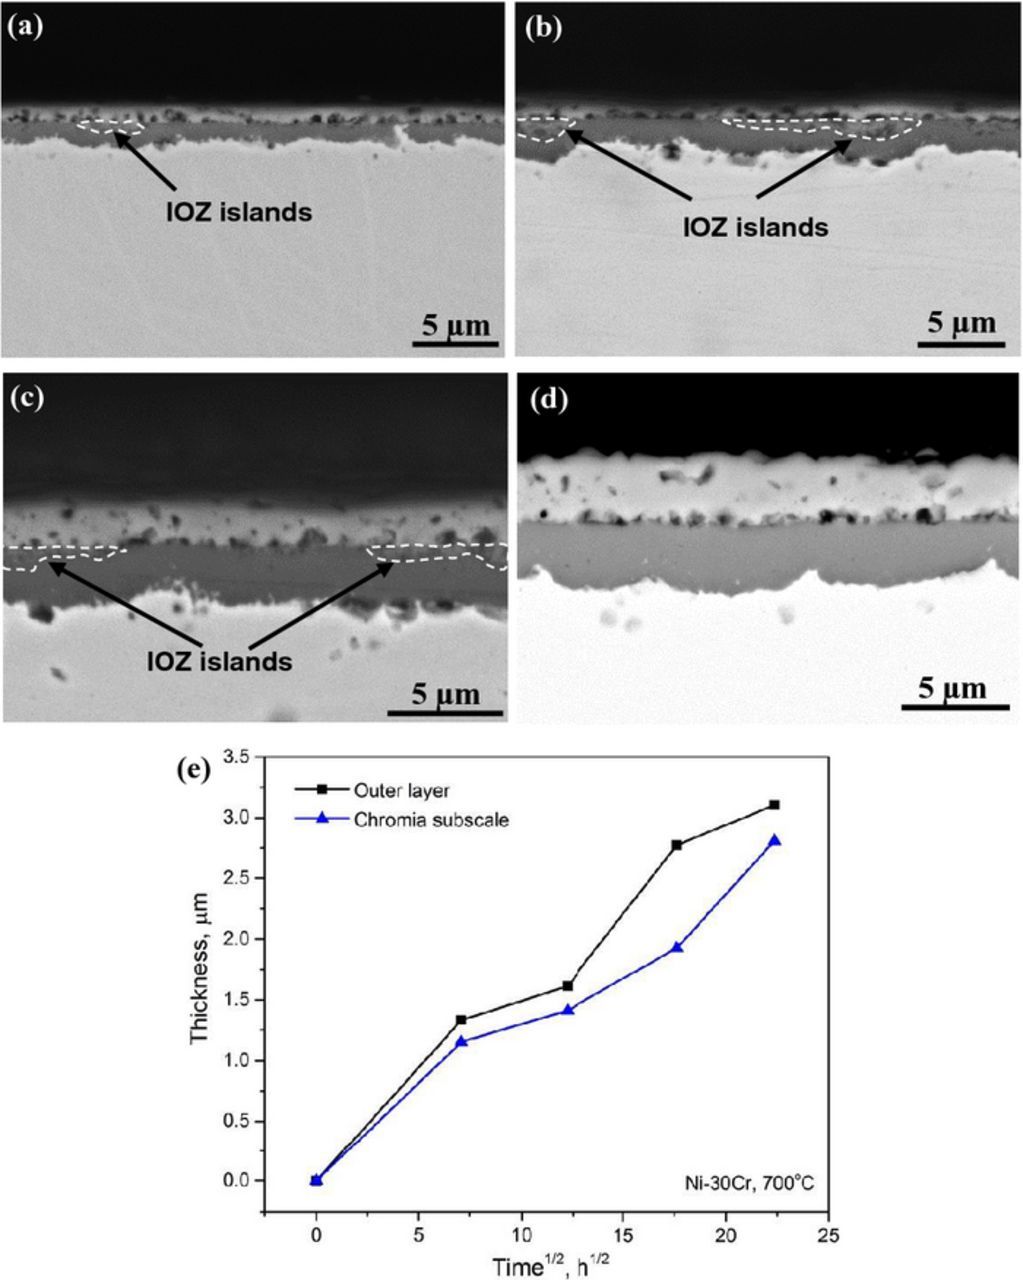
Figure 9. BSE-SEM images of Ni-30Cr alloy after reaction at 700°C for different times: (a) 50 h, (b) 150 h, (c) 310 h, and (d) 500 h; (e) corresponding scale thickening kinetics.
In the case of Ni-30Cr, a continuous chromia subscale had formed by the earliest stage observed at 700°C (Fig. 9a) and no extensive IOZ developed. This subscale thickened gradually with increasing reaction time. It should be noted that some isolated internal oxidation regions were found enclosed by the chromia subscale (Figs. 9a–9c). The growth kinetics of the NiO layer and chromia subscale are shown in Fig. 9e, both roughly following the parabolic law, but much slower than those shown in Figs. 5e, 6e and 8e.
Oxide scales formed at 800°C
BSE-SEM cross-sections of the model alloys after reaction for 500 h in Ar-20%CO2 at 800°C are shown in Fig. 10. Scale morphologies developed by alloys containing 5 to 15 wt% Cr were somewhat different from those formed at 700°C. For Ni-5Cr, the interface between inner oxide layer and IOZ became more flat. The precipitates in its IOZ failed to develop the initial dendritic shape seen at lower temperatures, instead forming short rods. In the case of both Ni-10Cr and Ni-15Cr alloys, the oxide particles precipitated in the IOZ were larger in size than those formed at 650 and 700°C. A similar trend of increasing precipitate size with increasing depth beneath the inner oxide layer-IOZ interface was observed for these two alloys. In contrast, the microstructure of the oxide scales on Ni-20Cr changed substantially. No apparent IOZ was visible, but a continuous chromia scale formed instead, with some discontinuous NiO regions above and small scattered Cr2O3 particles underneath. Owing to the non-uniformity of the scale, the weight gain curve for Ni-20Cr in Fig. 1c was irregular, deviating from the parabolic law to some extent.

Figure 10. BSE-SEM images of alloys after 500 h exposure in Ar-20%CO2 at 800°C: (a) Ni-5Cr, (b) Ni-10Cr, (c) Ni-15Cr, (d) Ni-20Cr, (e) Ni-25Cr, and (f) Ni-30Cr.
The evolution with time of scale morphologies developed by the Ni-20Cr alloy at 800°C is shown in Fig. 11. As shown in Figs. 11a–11c, Ni-20Cr grew a thin chromia scale over most of its surface. This was occasionally interrupted by the growth of localized nodules consisting of outer NiO and underlying internal oxidation islands, surrounded by the chromia scale.
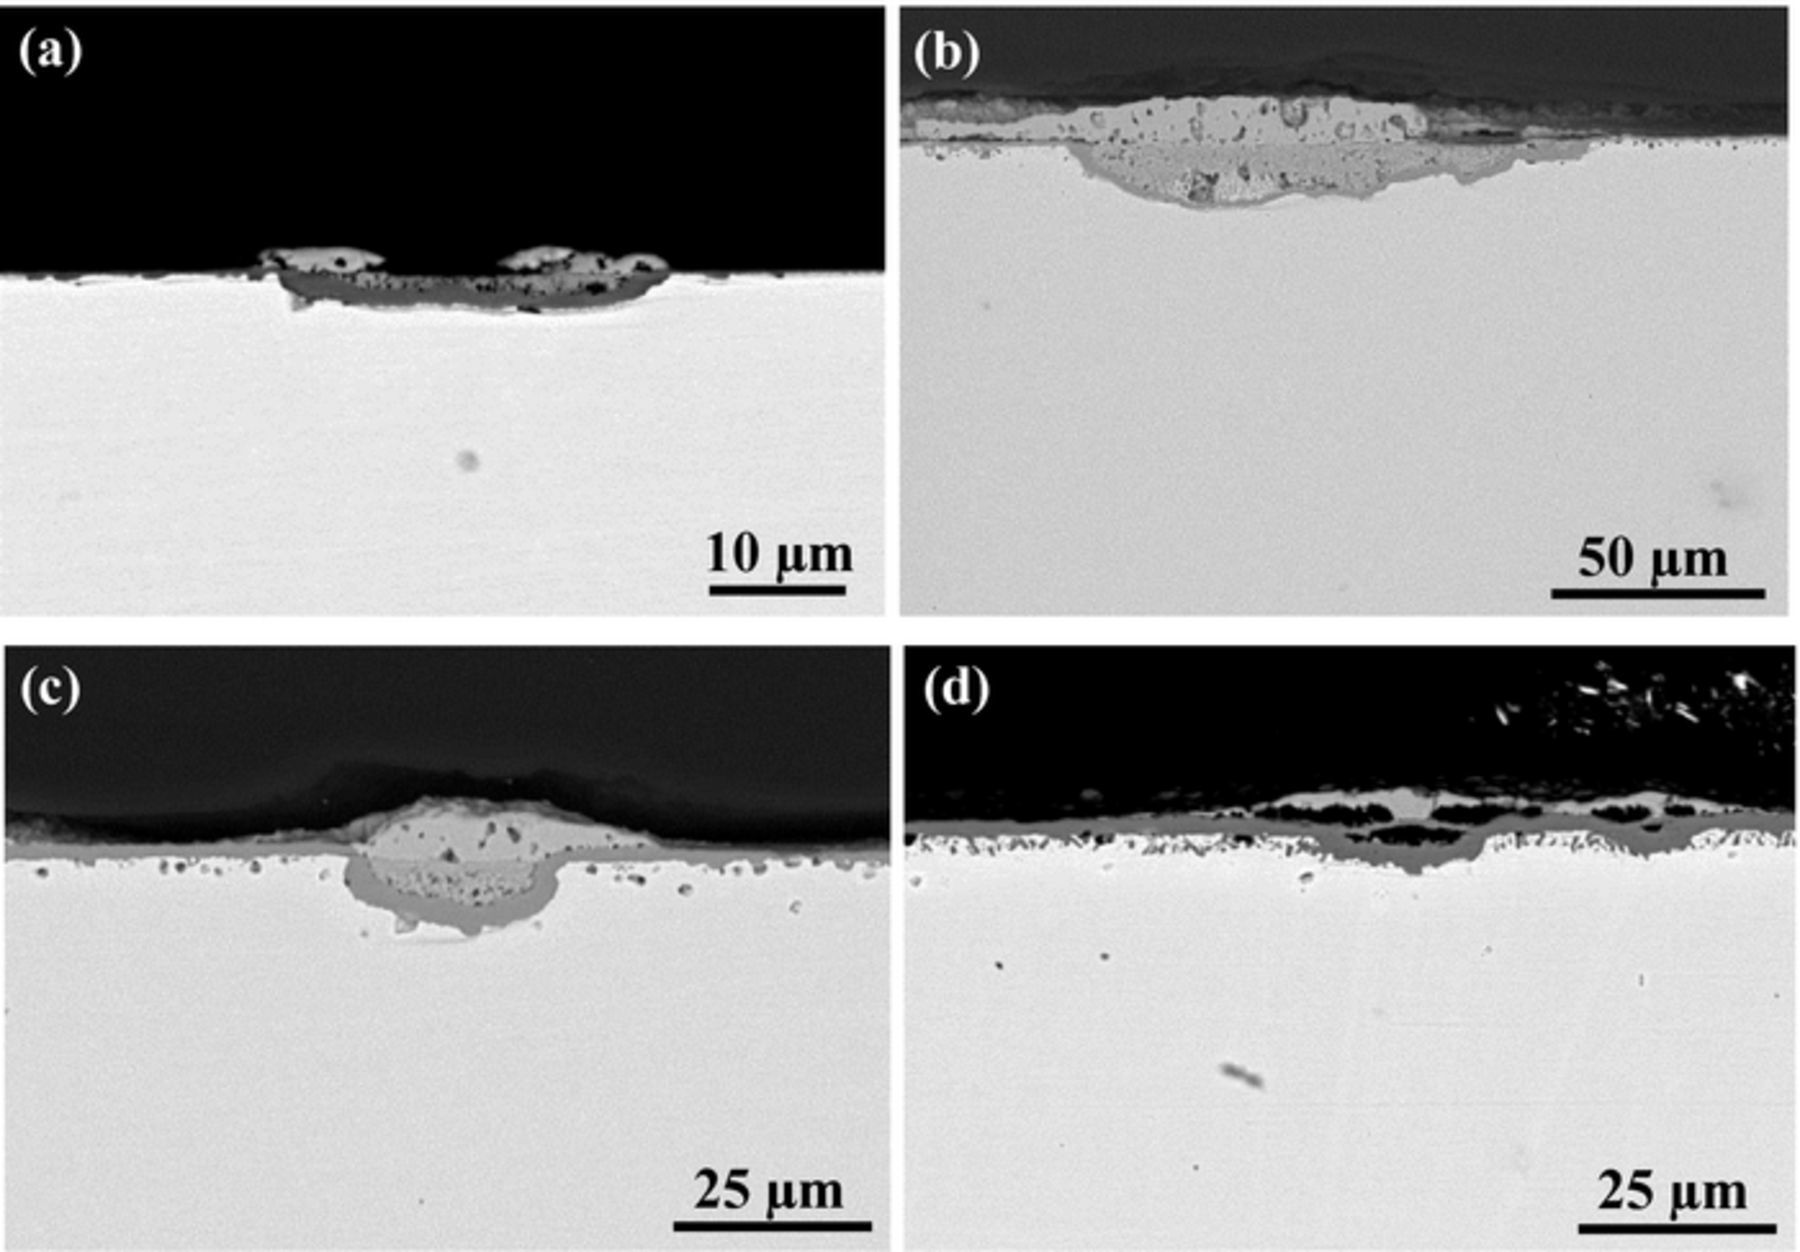
Figure 11. BSE-SEM images of Ni-20Cr alloy after reaction at 800°C for different times: (a) 50 h, (b) 150 h, (c) 310 h, and (d) 500 h.
At higher Cr levels, uniform Cr2O3 layers, identified by EDS analysis and XRD results (not shown here), were formed on both Ni-25Cr and Ni-30Cr after all the reaction times observed. The thickness of their chromia scales increased very slowly with reaction time.
Carburization
Intergranular carbides were revealed by etching of high chromium content alloys, Ni-25Cr and Ni-30Cr reacted in CO2 gas for 500 h at all test temperatures. Typical microstructures in Fig. 12 show the carbides to be scattered along alloy grain boundaries. Increasing the Cr content seems to increase the size and amount of carbides (Fig. 12). Analysis by SEM-EDS confirmed these precipitates to be rich in chromium and carbon. Carbides were also detected for Ni-20Cr after reaction at 800°C for 500 h but at a much lower volume fraction and in a shallow subsurface zone. No apparent carbides were observed in the lower Cr concentration alloys reacted under the same condition.

Figure 12. SEM cross-section of etched samples, showing carbides precipitated along the grain boundaries (a) Ni-25Cr and (b) Ni-30Cr after 500 h reaction in CO2 gas at 700°C.
Discussion
As is clear from the present results, the oxidation products depend on alloy composition and reaction temperature. For low Cr content alloys, 5–15 wt% Cr, generally multi-layered structures developed: an outer NiO layer, an inner layer, and an IOZ (Figs. 3a–3c, 7a–7c and 10a–10c). From the equilibrium oxygen partial pressure of the reaction gas shown in Table I, it is obvious that NiO and Cr2O3 are both stable under the reaction conditions studied. External NiO growth has been well understood and its formation is controlled by Ni cation outward diffusion.22,23 Increasing the chromium concentration of the alloys leads to the formation of a chromia band at the reaction front and eventually to a chromia layer (Figs. 7f and 10d). The discussion will focus first on the prediction of critical Cr concentration required for protective chromia formation. The thermodynamics of carburization under these reaction conditions are then considered, and finally the chromia band formation mechanism is discussed along with its effect on metal and oxygen diffusion.
Prediction of temperature effect on chromia layer formation
As shown in Fig. 3, all alloys studied failed to form an exclusive chromia scale on their surfaces at 650°C. However, alloys of Ni-25Cr and Ni-30Cr did form protective scales, exclusively of Cr2O3, after exposure in the same atmosphere at 800°C, showing that the critical chromium concentration for external chromia scale formation was influenced by temperature. According to Wagner's theory, this critical concentration of chromium, N(1)Cr, required to form external rather than internal oxide can be estimated from the equation:24
![Equation ([3])](https://content.cld.iop.org/journals/1945-7111/164/6/C285/revision1/d0003.gif)
where g is a critical volume fraction of oxide precipitates, generally approximated as about 0.3,25 v the stoichiometric coefficient of CrOv (1.5), Vm the molar volume of alloy (6.8 cm3/mol),  the molar volume of the oxide (14.6 cm3/mol), DO the diffusion coefficient of oxygen in the alloy, and
  the alloy inter-diffusion coefficient. Sample surface treatment by electropolishing, as employed in this work, allows the evaluation of Eq. 3, using well characterized bulk alloy diffusion coefficients. Without this treatment, which removes the cold worked surface region, subsurface diffusion is predominantly due to the high dislocation density in the deformed metal and grain boundary diffusion in any subsequently recrystallized zone. In addition to being difficult to quantify, this enhanced diffusion is not characteristic of an alloy after long term service at high temperature, as the damage is by then annealed out.
Eq. 3 was derived on the assumption that no external scale of, in this case NiO, forms. This is dealt with here by calculating N(S)O for the Ni/NiO equilibrium (see below). Further inaccuracy may result from neglect of the volume change induced by internal oxidation, any contribution to diffusion by precipitate-matrix interfaces, and any interaction with dissolved carbon. The volume change effect is relatively small, and the dissolved carbon effect has been shown to be negligible at high temperatures.26 The contribution of interfacial diffusion cannot be assessed without high resolution characterization of precipitate morphology. As this information is to date unavailable, it is noted that the predictions of Eq. 3 are imprecise, but nonetheless of semi-quantitative use.
The quantityN(S)O in Eq. 3 is the dissolved oxygen concentration at the alloy surface, determined by the partial pressure of oxygen at the scale-alloy interface, as calculated from Sievert's equation:
![Equation ([4])](https://content.cld.iop.org/journals/1945-7111/164/6/C285/revision1/d0004.gif)
where K5 is the equilibrium constant for the dissolution of oxygen in the alloy:
![Equation ([5])](https://content.cld.iop.org/journals/1945-7111/164/6/C285/revision1/d0005.gif)
The value of K5 can be calculated from data provided in the literature.27 Using a value for determined by the equilibrium:
![Equation ([6])](https://content.cld.iop.org/journals/1945-7111/164/6/C285/revision1/d0006.gif)
the value of N(S)O can be obtained. Diffusivity data of oxygen and chromium are unavailable at such low temperatures, so values are extrapolated from high temperature data in literature.27,28
Once a chromia scale is formed, the flux of Cr diffusing from the bulk alloy to the scale-alloy interface must be sufficient to maintain its growth. The critical concentration of chromium, N(2)Cr, associated with this criterion can be expressed as:29
![Equation ([7])](https://content.cld.iop.org/journals/1945-7111/164/6/C285/revision1/d0007.gif)
where kp is the parabolic rate constant for chromia layer thickening, which can be derived from Eq. 2. Unfortunately, no value of kp at 650°C can be deduced from the scale thickening kinetic data, as no exclusive chromia scales ever formed on any alloys throughout the oxidation times in the present study. As a result, N(2)Cr values were not calculated at 650°C. At 700°C, in addition to the predominant scale morphology shown in Fig. 7f, some localized areas of exclusive chromia scale, of about 1.5 μm thickness were also observed on the Ni-30Cr alloy surface after oxidation for 500 h. This corresponds to kp≈ 6.3 × 10⁻¹⁵ cm2/s. Similarly, for kpcalculation at 800°C, the roughly 2.5 μm thick chromia scale shown in Fig. 10f leads to the estimate kp≈ 1.7 × 10⁻¹⁴ cm2/s.
Calculated values of N(1)Cr and N(2)Cr are summarized in Table V, along with the underlying data. It is seen that both N(1)Cr and N(2)Cr are predicted to vary inversely with oxidation temperature. According to the predictions, at 650°C all alloys except Ni-30Cr in the present study should be unable to form an external chromia scale. The chromium content (32.6 at % Cr) of Ni-30Cr alloy is slightly higher than N(1)Cr, so marginal behavior could be expected. This was in fact evidenced by a continuous Cr2O3 band formed at the oxide scale base (Fig. 3f). Similarly, at 700°C, the chromium concentration of Ni-25Cr (27.3 at % Cr) is marginal for chromia formation but not sufficient to maintain it. As a result, only a thin but continuous Cr2O3 band is formed at the base of the reaction zone (Fig. 7e). At this temperature, Ni-30Cr alloy is predicted to develop a chromia layer on the surface, and not internally, but still fail to form an exclusive layer. This is in agreement with the experimental observation (Fig. 7f). Since Ni-25Cr and Ni-30Cr alloys are able to form continuous chromia layers, lower mass uptake rates as manifested by the parabolic rate constants shown in Table II are explained.
Table V. Critical concentrations of N(1)Cr and N(2)Cr.
| T (°C) | N(S)O | DO (cm2/s) |  (cm2/s) (cm2/s) |
kp (cm2/s) | N(1)Cr | N(2)Cr |
|---|---|---|---|---|---|---|
| 650 | 6.6E-05 | 2.6E-11 | 2.6E-15 | – | 0.311 | – |
| 700 | 9.4E-05 | 7.7E-11 | 1.4E-14 | 6.3E-15 | 0.275 | 0.392 |
| 800 | 1.7E-04 | 5.1E-10 | 2.3E-13 | 1.7E-14 | 0.235 | 0.159 |
At 800°C, the chromium content (22 at % Cr) of Ni-20Cr alloy is close to N(1)Cr and higher than N(2)Cr. As a result, this alloy should exhibit marginal behavior in terms of chromia formation but succeed in maintaining the chromia layer once it emerges. These inferences are supported by the finding of predominant chromia layer formation, accompanied with localized NiO islands (Fig. 10d). The significantly reduced weight gain rates shown in Fig. 1c also reflected this success. For alloys of Ni-25Cr and Ni-30Cr, the observed exclusive chromia layers are in good agreement with the predicted results (Figs. 10e and 10f). It is concluded that predictions based on Wagner's diffusion theory agree rather well with the experimental observations.
It is to be noted that this agreement is found only for electropolished alloy specimens, with no deformed subsurface regions. In the more common case of alloys with cold worked surfaces, accelerated alloy diffusion in the deformed subsurface region leads via Eq. 3 and Eq. 7 to lower critical chromium concentrations, and the more ready formation of protective chromia scales.
Carburization of Ni-Cr alloys in CO2 gas
Careful etching experiments revealed carbide formation for high Cr content alloys. A preliminary investigation30 failed to detect the carbides, and is in that respect incorrect. For carbide precipitation in Ni-Cr alloys, the reaction is written:
![Equation ([8])](https://content.cld.iop.org/journals/1945-7111/164/6/C285/revision1/d0008.gif)
the free energy change can be obtained from the reactions:
![Equation ([9])](https://content.cld.iop.org/journals/1945-7111/164/6/C285/revision1/d0009.gif)
![Equation ([10])](https://content.cld.iop.org/journals/1945-7111/164/6/C285/revision1/d0010.gif)
![Equation ([11])](https://content.cld.iop.org/journals/1945-7111/164/6/C285/revision1/d0011.gif)
where underlining indicates a solute species. Thus, the equilibrium condition for carbide precipitation is written as:
![Equation ([12])](https://content.cld.iop.org/journals/1945-7111/164/6/C285/revision1/d0012.gif)
in which the activity of carbide, aCrCv, is assumed to be unity, and ΔG°,  and
and  the standard free energy changes for the formation of CrCv and the partial molar free energies of dissolution of Cr and C in nickel, respectively.31,32 The minimum carbon activity for Cr23C6 precipitation is calculated for Ni-30Cr, with aCr = 0.46 extrapolated from higher temperature data,33 to be aC = 1.2 × 10⁻⁴ at 800°C. Therefore, to form this carbide, aC should be higher than this value.
As can be seen from Table I, carbon activities of the equilibrium gas phase are very low, far lower than the carbon activities required for carbide formation. However, as reported for iron-based chromium-containing alloys,1,2 the CO2 gas can produce much higher carbon activity at the interface between iron oxide and metal matrix, because of the significantly lower oxygen partial pressure at this location which raises the carbon activity. The correlation between the oxygen partial pressure and carbon activity is seen in the reaction equilibria:
![Equation ([13])](https://content.cld.iop.org/journals/1945-7111/164/6/C285/revision1/d0013.gif)
![Equation ([14])](https://content.cld.iop.org/journals/1945-7111/164/6/C285/revision1/d0014.gif)
![Equation ([15])](https://content.cld.iop.org/journals/1945-7111/164/6/C285/revision1/d0015.gif)
![Equation ([16])](https://content.cld.iop.org/journals/1945-7111/164/6/C285/revision1/d0016.gif)
Combination of Eqs. 16 and 14 yields:
![Equation ([17])](https://content.cld.iop.org/journals/1945-7111/164/6/C285/revision1/d0017.gif)
The value of  is unknown, but has a maximum equal to that of the gas phase.
At the scale/metal interface, the equilibrium  is much lower than that in the gas, and as a result, a high carbon activity can be achieved, according to Eq. 17. In the case of an external chromia scale formed on the Ni-30Cr alloy oxidized at 800°C, the
  at the scale-alloy interface is equal to 1.2 × 10⁻²⁷ atm. For
  = 0.2 atm, aC underneath the chromia scale is calculated to be about 9.7 × 10⁶ which is more than enough for carbide formation. Even at much reduced
  values, carbon activities will be higher than the calculated threshold aC value for Cr23C6 formation in Ni-30Cr. The observation of carbide formation only at grain boundaries indicates that aC does not in fact reach any such value within grains. The reason is the external oxide scale which greatly reduces inward carbon diffusion, resulting in a much lower
  and aC values in the underlying alloy. As a result, no intragranular carbide is formed inside the matrix. Only at grain boundaries, where carbon diffusion is fast and carbide nucleation is facilitated, does carbide precipitation occur.
If an internal oxidation zone beneath an external NiO scale prevails, e.g. the oxidation products grown on Ni-25Cr alloy oxidized at 650 and 700°C, the  at the scale-alloy interface should be governed by the dissociation pressure of NiO which is calculated to be 4.5 × 10⁻¹⁷ atm at 700°C. Correspondingly, the maximum value of interfacial aC = 2.8 × 10⁻⁶ is found from Eq. 17. On the other hand, the critical aC value required for Cr23C6 precipitation is 1.1 × 10⁻³ at 700°C according to Eq. 12, and carbide formation is not predicted for Ni-25Cr on this basis. However, the above
  calculation is based on the assumption that the NiO scale is pure. Actually, it has been reported34 that there is an appreciable solubility of Cr in NiO, about 1 wt% at 950°C. This stabilizes the oxide scale, lowering the equilibrium
  value. It follows from Eq. 17 that the corresponding aC should be much higher than 2.8 × 10⁻⁶. On this basis it is inferred that carbon activity beneath the scale is enhanced by the dissolution of Cr into NiO, leading to carbide formation.
Mechanism of chromia band formation
As discussed above, a protective chromia scale can be formed when the alloy Cr content is higher than both N(1)CrandN(2)Cr. When the concentration is far below these critical values, multi-layered oxide scales are formed, typically in the form of external NiO, inner oxide layer, and IOZ (Figs. 3, 7 and 10). As the alloy Cr concentration is increased to these critical values, a transition in reaction product morphology from a multi-layered structure to an exclusive chromia scale is expected. This is confirmed by the observation of chromia band formation at the reaction front (Figs. 5, 6 and 8). The evolution of this chromia band is shown schematically in Fig. 13. In a short reaction time, an external NiO layer together with an IOZ is expected to be formed (Fig. 13a), since the Cr concentration is slightly lower than the critical value for avoiding internal oxidation. With the gradual thickening of IOZ and external NiO layer, the chromium concentration at the reaction front reaches the critical value in some regions and as a result Cr2O3 band nucleation occurs (Fig. 13b). The local variations in microstructure leading to chromia band nucleation in some places but not in others are not revealed by the present results.
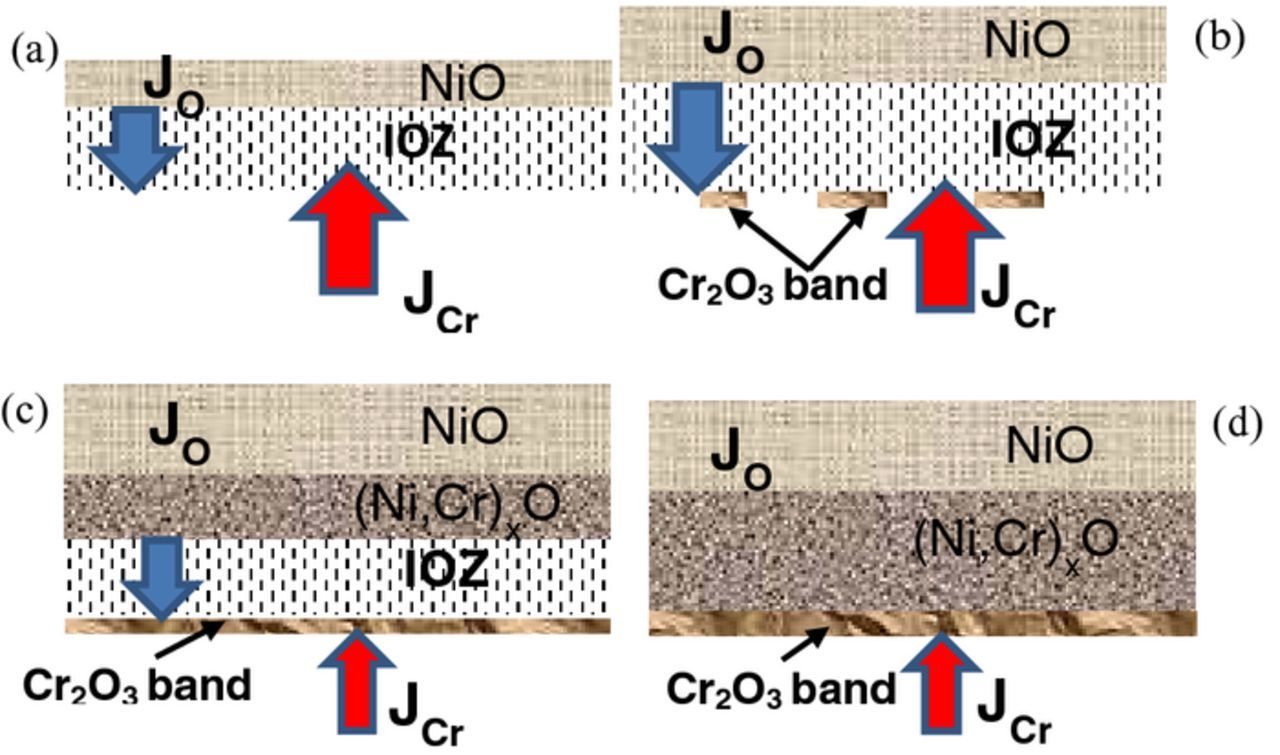
Figure 13. Schematic illustration showing the evolution of chromia band formation
As soon as a continuous Cr2O3 band is formed, both outward diffusion of Cr into the IOZ and inward oxygen diffusion through the Cr2O3 band are strongly retarded. As a result, oxygen potentials in the IOZ increase and become high enough to further oxidize Ni in the IOZ, converting it to an inner mixed oxide layer (Fig. 13c). This transformation is completed when the Ni oxidation front reaches the chromia band (Fig. 13d). The phenomenon of Cr2O3 band formation is apparent at temperatures of 650°C and 700°C, but not at 800°C where, in accord with Wagner's prediction, a protective Cr2O3 is the sole reaction product.
The formation of a continuous chromia band coincides with the reduction in weight gain rate shown in Figs. 1a and 1b, indicating the transition from non-protective to protective oxidation. This change is associated with a reduction in thickening rates of the external NiO layer and IOZ, as seen by comparing Figs. 5e, 6e and 8e. When the chromia band formed at the IOZ-alloy interface was discontinuous, it had an insignificant effect on the scale thickening kinetics (Fig. 5). However, when a continuous chromia band was formed (Figs. 6 and 8), the growth rates of both outer NiO layer and IOZ were reduced, but not fully stopped, with the extent of reduction more pronounced for the IOZ (Figs. 6e and 8e). This observation implies that the Cr2O3 is permeable to nickel, which is somewhat surprising as the diffusion coefficient of nickel in the Cr2O3 is very small, 3.3 × 10⁻¹⁸ cm2/s at 700°C,35 unable to maintain the growth rate shown in Fig. 8e. Other possible sources of nickel for external NiO layer thickening are the sparsely distributed Ni particles at the NiO layer-IOZ interface (Fig. 8), and diffusion of Ni from the matrix of the IOZ as it is oxidized.
Conclusions
The effect of temperature on the oxidation behavior of binary Ni-Cr alloys in CO2 gas atmosphere has been determined, and the relationship between the oxidation kinetics and corresponding oxide scale morphologies at different temperatures identified.
At 650°C, oxidation rates were not significantly decreased until the alloy Cr content reached 30 wt%, and a continuous Cr2O3 band was formed at the scale-alloy interface. The oxidation rates of alloys with 5–20 wt% Cr increased as temperature was elevated to 700°C. In contrast, Ni-25Cr and Ni-30Cr alloys showed reduced oxidation rates owing to the development of a continuous internal Cr2O3 band in the former and a chromia subscale on the latter.
With a further increase in temperature to 800°C, the oxidation rates of Ni-5Cr, Ni-10Cr and Ni-15Cr alloys continued to increase, while those of alloys with 20 wt% Cr and above reduced, due to protective external chromia scale formation. It was shown that the continuous chromia band at the IOZ-alloy interface played a similar role to an external chromia scale in suppressing further oxygen penetration, reducing internal oxidation and producing smaller weight gain rates.
Wagner's diffusion theory was successfully used to determine the critical chromium concentration required for protective chromia formation. The calculated results were in good agreement with the experimental observations. The critical Cr contents required for forming and maintaining a protective chromia layer decreased with increasing oxidation temperature, due to the high temperature sensitivity of alloy Cr diffusion.
Carbide formation in high Cr content Ni-Cr alloys is due to elevated carbon activity at local equilibrium beneath the oxide reaction products. However, the very high activity values possible at high  levels are not achieved, because the passage of CO2 through the chromia scales is slow. Consequently, the extent of carburization is limited.
Acknowledgments
Financial support from the Australian Research Council's Discovery program is gratefully acknowledged. A preliminary version of this paper was published in ECS Transactions.