Abstract
The present study intends to elucidate the effect of treatment solution composition on the formation and structure of Trivalent Chromium-based Conversion (TCC) coatings containing cobalt on zinc substrates. Model solutions with two different complexing agents, viz. fluoride and oxalate, with and without cobalt were applied to zinc plated steel. The scanning electron microscopy and atomic force microscopy images revealed a morphology with microstructural defects that can be improved to a more uniform and adherent structure by adding cobalt to the passivating bath. The elemental composition of the layer was investigated by auger electron spectroscopy (AES). Furthermore, the amounts of Cr and Co in the coatings were also measured with the aid of inductively coupled plasma optical emission spectroscopy (ICP-OES). In good agreement with AES, cobalt was also detected in the layers via ICP-OES measurement. The results of accelerated corrosion tests suggested that the formation of a densely packed layer is crucial for a good corrosion resistance of the coating.
Export citation and abstract BibTeX RIS

This is an open access article distributed under the terms of the Creative Commons Attribution 4.0 License (CC BY, http://creativecommons.org/licenses/by/4.0/), which permits unrestricted reuse of the work in any medium, provided the original work is properly cited.
Hexavalent chromium conversion coatings have long been used to enhance the corrosion protection of zinc plated steel parts.1 By immersing the zinc plated piece into a chromic acid bath at ambient temperature, a thin film consisting of a complex mixture of Cr(III) and Cr(VI) compounds is formed.2 Based on the process parameters and composition of the treatment solution, a variety of colors for the corrosion protection layer can be achieved.2,3 Due to the fact that hexavalent chromium compounds were recognized as toxic and carcinogenic,4,5 the End-of-Life-Vehicle directive allowed a maximum of 2 g Cr(VI) per vehicle after July 2003.6,7 Cr(III)-based conversion coatings were first introduced in 1951;8 however, their industrial usage has been put into practice by European directives9–11 since restricting hexavalent chromium from being used in surface finishing industries.12 Trivalent Chromium-based Conversion (TCC) coatings resist high temperature up to 150°C. In contrast, Cr(VI) conversion coatings fail to maintain corrosion protection after annealing above 60°C.13 Although the Cr(III)-based conversion layer also acts as a barrier,6 without heat-treatment, the corrosion protection of Cr(VI) coatings is generally better. Studies14,15 showed that transition metal ions such as Co(II), Ni(II), and Fe(II) incorporated into Cr(III)-based treating solutions induce a better corrosion protection. Not only is the corrosion resistance of the coating improved in the presence of cobalt ions,16–19 but also, the layer formed in cobalt-containing treatment solutions has the advantage of desired surface appearance.20 According to some studies,17,21 cobalt was not detected in the layer formed in cobalt-containing Cr(III)-based passivation solutions. Furthermore, it is reported that adding a cobalt salt to the Cr(III)-based treatment solution did not affect the microstructure of the formed layer significantly.16 Nonetheless, the role of cobalt in the TCC treatment solution has not been understood yet.
Cr(III) octahedral complexes are generally inert to the exchange of water molecules with other ligands.22 The kinetic inertness results from the type of orbital charge distribution, with the electron configuration of 3d3 4s0. Cr(III) has a large range of stability, and a very slow ligand displacement and substitution reactions, which allow separation, persistence, and/or isolation of thermodynamically unstable Cr(III) species.23
To prepare Cr(III)-based passivation solutions, apart from a Cr(III) salt and additional transition metal ions to increase the corrosion resistance, another component to form a complex with Cr(III), which is kinetically less inert than [Cr(H2O)6]3+, is needed.16 In a hexavalent chromium conversion process, the Cr(VI) ion acts as an oxidizing agent, while in the TCC coating process the role of the oxidation agent is mainly carried out by nitrate.16 A very limited number of papers dealt with complexants in Cr(III)-based treatment solutions. Overall, fundamental studies of the TCC formation mechanism plus the physical and chemical structure of the coating and its correlation with corrosion protection behavior of the layer are rarely carried out. Besides, the composition of the substrate was shown to influence the mechanism of the film growth.24–26 Most studies27–36 investigated proprietary products as the treatment solution on an aluminum substrate, whereas, zinc substrates have been rarely studied and yet are very important for the automotive industry. Therefore, to elucidate the role of the chemical composition of Cr(III)-based treatment solutions on passivating zinc electroplated steel, this work aims: (a) To study the physical structure and the chemical composition of TCC layers formed by model solutions with two different complexing agents, viz. fluoride and oxalate (one inorganic, one organic). (b) To better understand the role of cobalt in the coating structure prepared by cobalt-containing Cr(III)-based passivation solutions.
Experimental
Treatment solutions and specimens
Pre-galvanized low carbon steel polished Hull cell panels (10 × 7.5 cm2) were supplied by Kiesow Dr. Brinkmann GmbH & Co. KG. The pre-galvanized film that was used to protect the steel panels was stripped off by immersing the piece in 10% HCl (specific gravity 1.18 g/ml). Subsequently, the parts were immediately rinsed with deionized water. To plate a zinc layer with 6–8 μm thickness, a commercial alkaline zinc electrolyte (Protolux 3000 Atotech Deutschland GmbH) was used with a cathodic current density of 2 A dm−2. The panels were then rinsed and dipped in 0.3% HNO3 to activate the surface prior to applying the Cr(III)-based treatment solution. The zinc plated steel sheets were passivated in different treatment solutions at 40°C. A matrix of six different model solutions with two complexing agents including and excluding cobalt was prepared (Table I). The same amount of chromium nitrate was used for all solutions. The cobalt-containing passivation solutions were prepared with two different concentrations of cobalt salt. All chemicals were reagent grade and were obtained from Carl Roth GmbH + Co KG. The immersion time applied for the morphology studies, compositional analysis, and corrosion tests was 60 s. To study the kinetics of the process, other immersion times, 40 s and 80 s, as well as more passivation bath temperatures, 3°C, and 18°C, were also applied. Agitation was performed by manual shaking during immersion time. Afterward, the samples were rinsed with deionized water and dried in an oven for 15 minutes at 80°C. The samples were then left to stabilize at room temperature for a minimum of 24 hours in accordance with ASTM B201.37 To study the annealing effect on the coatings, some specimens were heated in a forced convection oven for 6 hours at 210°C.
Table I. The composition and processing parameters of the treatment solutions.
| Samples' name | Cr + Ox | |
| Cr + Ox + ½ Co | ||
| Cr + Ox + Co | ||
| Cr + F | ||
| Cr + F + ½ Co | ||
| Cr + F + Co | ||
| Parameters | Concentration(M) | |
| Cr(III) | 0.08 | |
| Co(II) (lower concentration is shown as ½ Co) | 0.002, 0.004 | |
| Complexing agent | Oxalic acid | 0.1 |
| Ammonium bifluoride | 0.15 | |
| Processing parameters pH | 1.8 | |
| Immersion time | 40, 60, 80 s | |
| Working temperature | 40°C, 3°C, 18°C |
Experimental techniques
Morphology characterization
Focused ion beam scanning electron microscope (FIB-SEM)
The cross-sectional structures of the formed trivalent chromium conversion layer were observed via cryo- sample preparation in conjunction with FIB-SEM. The thickness of the films was also measured using the cross-sectional micrographs. Specimens were initially immersed in liquid nitrogen (−200°C) for 1 minute and immediately bent. This process caused the conversion coating to crack and facilitated the observation of film thickness. Since the coatings were not conductive, the samples were then transferred to a Gatan 682 Precision Etching and Coating System (PECS), where the surface of the specimens was sputtered with a∼40 nm thick tungsten film to improve their surface conductivity. Following that, the sample was transferred to the SEM for imaging. A Zeiss Auriga 60 (Carl Zeiss, Germany) Dual Beam FIB-scanning electron microscope (SEM) system with a Ga ion beam at 30 kV and 50 pA current were used to analyze the cross-sectional FIB-SEM of the specimens. Prior to ion milling, to protect the coating from any damage caused by the ion beam, a 500 nm thick platinum layer was deposited onto the area of interest. The cross-section milling was performed at a tilt angle of 54° for all the samples.
Atomic force microscopy (AFM)
The non-conducting surface of the formed trivalent chromium conversion layer was observed using AFM. Surface roughness values were also extrapolated from the topographical data obtained from AFM using a Dimension Icon AFM from Bruker Corporation. Mapping was performed in PeakForce tapping mode using Bruker ScanAsyst-Air HPI probes, with a tip radii ∼2 nm, silicon nitride cantilever, and 0.25 N/m spring constant. All images were obtained with a scan rate of 1.0 Hz. AFM images and average roughness (Ra) values were analyzed quantitatively by means of NanoScope Analysis software (Bruker). Prior to AFM analysis, the zinc plated steel sheets were passivated in different treatment solutions for an immersion time of 60 s at 40°C.
X-ray fluorescence (XRF)
The amount of deposited chromium in the formed TCC layer was measured by X-ray fluorescence (XRF) using a FISCHERSCOPE X-RAY XDV-SDD. The X-ray detector was equipped with a large silicon drift detector with an effective detector area of 50 mm². The micro-focus X-ray tube featured a 50 kV power supply, a tungsten target, a beryllium window, a collimator with 1 mm diameter, and an Al 100 μm filter. The measurements were done at different points of each sample with the aid of a programmable XY-stage and for a measurement time of the 30 s.
Inductively coupled plasma optical emission spectroscopy (ICP-OES)
The amount of dissolved chromium and cobalt obtained from the leached conversion coatings in 10% HCl was evaluated employing a Spectroblue ICP-OES model FMX 36 using SPECTRO SMART ANALYZER software. The device is equipped with a SPECTRO UV-PLUS gas purification system. The optical chamber was filled with argon and hermetically sealed. To ensure the availability and stability of the gas flow, the argon atmosphere was circulated continuously by means of a membrane pump. The status of the optical system was monitored using SPECTRO's Intelligent Calibration Logic (ICAL). An air-cooled ICP-generator was operated at 27.12 MHz ensuring the stability of the forward power. All experimental ICP operating parameters (Table II) were controlled via software. The analytical curves were prepared separately for chromium and cobalt with five different concentrations of standard solutions (0.02, 0.05, 0.1, 0.5, 1, 5 mg/l). The pH of the solutions was adjusted (pH 4–7) with analytical grade 1 % (v/v) HNO3. SRM NIST 1643e (Standard reference material National Institute of Standards and Technology) was utilized to perform the quality control of the method by using 100 μg/l Cr(VI) intermediate solution. A volume of 100 μg/l yttrium solution was added to all standards, samples and blank tests as an internal standard. For ICP-OES analysis, the zinc plated steel sheets were passivated in different treatment solutions for an immersion time of 60 s at 40°C.
Table II. Instrumental and operating parameters for ICP-OES.
| ICP-OES parameter | Type or value |
|---|---|
| Spray chamber | Cyclonic |
| Nebulizer | Sea Spray |
| RF generator | |
| RF power | 1450 W |
| Coolant gas flow rate (Ar) | 13 L/min |
| Auxiliary gas flow rate (Ar) | 0.8 L/min |
| Nebulization flow rate (Ar) | 0.8 L/min |
| Wavelength for chromium | 276.716 nm |
| Wavelength for cobalt | 228.616 nm |
| Plasma torch | Quartz, demountable, 2.0 mm Injector tube |
| Sample aspiration rate | 2 mL/min |
| Replicate read time | 49 s per replicate |
Auger electron spectroscopy (AES)
AES depth profiling was performed to investigate the elemental composition profiles of the passivation layers using a Thermo VG Scientific Microlab 350 instrument. The spectra were acquired at an accelerating voltage of 10 keV and a primary electron beam current of 14.1 nA and a beam diameter of approximately 30 nm with an incident angle of 60° with respect to the surface normal. The surface was scanned during the measurement over an area of some square microns. The measurement was carried out by a concentric hemispherical analyzer (CHA) and a detection angle of 0°. The energy resolution of the detector was 0.25%. The Auger spectra were detected with a step width of 0.7 eV and a dwell time of 200 ms. Sputtering was carried out using a 1 keV Ar ion beam of approximately 700 nA over an area of 1 × 1 mm2 and an incident angle of 43.4°. The base pressure in the analysis chamber was 1 × 10⁻⁹ mbar. The depth profiling was discontinued at the point in which the Zn signal reached a constant value (∼100% zinc atomic concentration). For AES measurements, the zinc plated steel sheets were passivated in treatment solutions with different complexing agents, with and without cobalt, for an immersion time of 60 s at 40°C.
Potentiodynamic polarization curves
The potentiodynamic polarization curves were determined with a BioLogic SP–150 potentiostat, using the commercial software package EC-LAB (version 10.32). The tests were carried out in a three-electrode corrosion flat cell kit from Biologic with a contact surface area of 1 cm2. The potential of the working electrode was measured against a Saturated Calomel Electrode (SCE, +241 mV vs. SHE), and a platinum mesh was used as the auxiliary electrode. The reference electrode was fixed near to the working electrode to minimize the IR drop. The experiments were performed in a naturally aerated 5 wt% NaCl aqueous solution at ambient temperature (∼18 °C) and pH around 6. To enable the working electrode to reach a steady state, the open circuit potential (OCP) was monitored for 20 minutes (until stable) after immersion of the working electrode in the corrosion cell and prior to the beginning of each test. The potentiodynamic polarization with a scan rate of 0.167 mV/s was performed from a cathodic potential of – 250 mV to 250 mV with respect to the OCP. The zinc plated steel sheets were passivated in different treatment solutions for an immersion time of 60 s at 40°C, 48 hours prior to electrochemical measurements. All tests were repeated three to four times for each sample to test reproducibility.
Results
Morphology and physical characteristics of the coating
Figs. 1a–1d depicts the FIB-assisted cross-sectional SEM micrographs corresponding to the layers formed by different treatment solutions with the immersion time of 60 s. The TCC coating shows a two-layered structure comprised of an outer thin barrier layer plus an inner thicker layer with a porous structure. Previous work also showed a two-28,30,38 or three-39 layered structure of the TCC coatings. The as-deposited TCC coating on zinc plated steel was reported39 as being composed of three layers; an inner layer contacting the substrate, an intermediate layer, and a thin outer layer with a thickness of ca. 20–40 nm. The middle layer, which contributed to approximately two-thirds of the total coating thickness, was also observed as more porous than the other two layers. As can be seen in Figs. 1a and 1b the inner film formed by oxalate-containing passivating bath covered the zinc substrate with a relatively uniform and less porous morphology. However, the images in Figs. 1c and 1d, represent a non-uniform structure with cavities for the conversion coatings produced by fluoride-containing treatment solutions. After heat-treatment, the coating was still composed of two layers (Fig. 1e), however, both inner and outer layers became denser as compared to the as-prepared counterpart. Another study39 also showed that the size and the number of cavities in the TCC coatings were reduced after heat-treatment. The thickness of the coatings was measured from the cross-sectional micrographs, and the average of the summation of the inner and outer thickness of each coating is listed in Table III. The results indicate that the films formed in the fluoride-containing solution have a higher thickness than the layers formed in oxalate-containing treating agents (430 nm for Cr + F, 230 nm for Cr + Ox). Additionally, layer thickness measurements reveal that adding cobalt to the passivating solution did not increase the coating thickness (220 and 240 nm for the films with Co). Furthermore, comparing Fig. 1c with 1d, or 1a with 1b, it is noticeable that the number of micropores was decreased by adding cobalt to the treatment solution. The cross-sectional analysis (Table III) reveals that the layers were dehydrated by the heat-treatment and their thickness decreased (e.g. the thickness of the sample Cr + Ox + ½ Co was reduced from 220 nm to 185 nm as the sample was heated). Moreover, the layer formed in cobalt-containing solution had undergone less thickness reduction during annealing, compared to the film produced by the cobalt-free solution (e.g. from 430 nm to 280 nm for the sample Cr + F in comparison with 340 to 300 nm for the sample Cr + F + Co). This can be attributed to the high density of pores in cobalt-free samples that shrank during heat-treatment.

Table III. Average thickness of the TCC layers (a) as prepared samples, (b) heated samples.
| Average thickness (nm) | ||
|---|---|---|
| As prepared | Heated | |
| Cr + Ox | 230 ± 11 | 160 ± 7 |
| Cr + Ox + 1/2Co | 220 ± 10 | 185 ± 8 |
| Cr + Ox + Co | 240 ± 12 | 200 ± 5 |
| Cr + F | 430 ± 22 | 280 ± 10 |
| Cr + F + 1/2Co | 330 ± 13 | 290 ± 9 |
| Cr + F + Co | 340 ± 17 | 300 ± 6 |
The corrosion resistance of the coatings was evaluated by neutral salt spray (NSS) testing.40 The NSS tests were discontinued when white rust covered 80% of the surface. The coating resistance duration to white rust propagation by exposing the samples in a salt spray chamber is listed in Table IV. The results indicate that, generally, the corrosion resistance of the coatings formed by the treatment solution containing cobalt is better (e.g. ∼120 hours for Cr + Ox + Co sample in comparison with ∼72 hours for Cr + Ox). This can be attributed to the smaller number of micropores in the film. The microstructural defects might act as favorable paths for Cl− ions to penetrate the film and cause corrosion in the layer. Also, the reduction of the layer thickness following annealing might be the reason for the degradation of the protective layer after heating. However, it is worth mentioning that a higher thickness of the layer does not necessarily result in a better corrosion protection.
Table IV. The corrosion resistance duration, up to 80% white rust coverage for the TCC coatings in NSS chamber.
| Corrosion test resistance hours | ||
|---|---|---|
| As prepared | Heated | |
| Cr + Ox | ∼72 | ∼48 |
| Cr + Ox + 1/2Co | ∼90 | ∼60 |
| Cr + Ox + Co | ∼120 | ∼80 |
| Cr + F | ∼60 | ∼48 |
| Cr + F + 1/2Co | ∼72 | ∼60 |
| Cr + F + Co | ∼96 | ∼72 |
Since the surface of the formed Cr(III) layers was non-conductive, AFM had the advantage of providing topographical images of the coating surface without applying a conductive coating (e.g. tungsten sputtering for SEM images). Top view AFM images (Figs. 2a–2d) are shown over a 10 × 10 μm2 area. The images reveal smoother morphologies with less microstructural defects for the coatings formed in cobalt-containing treatment solutions (Figs. 2b and 2d).
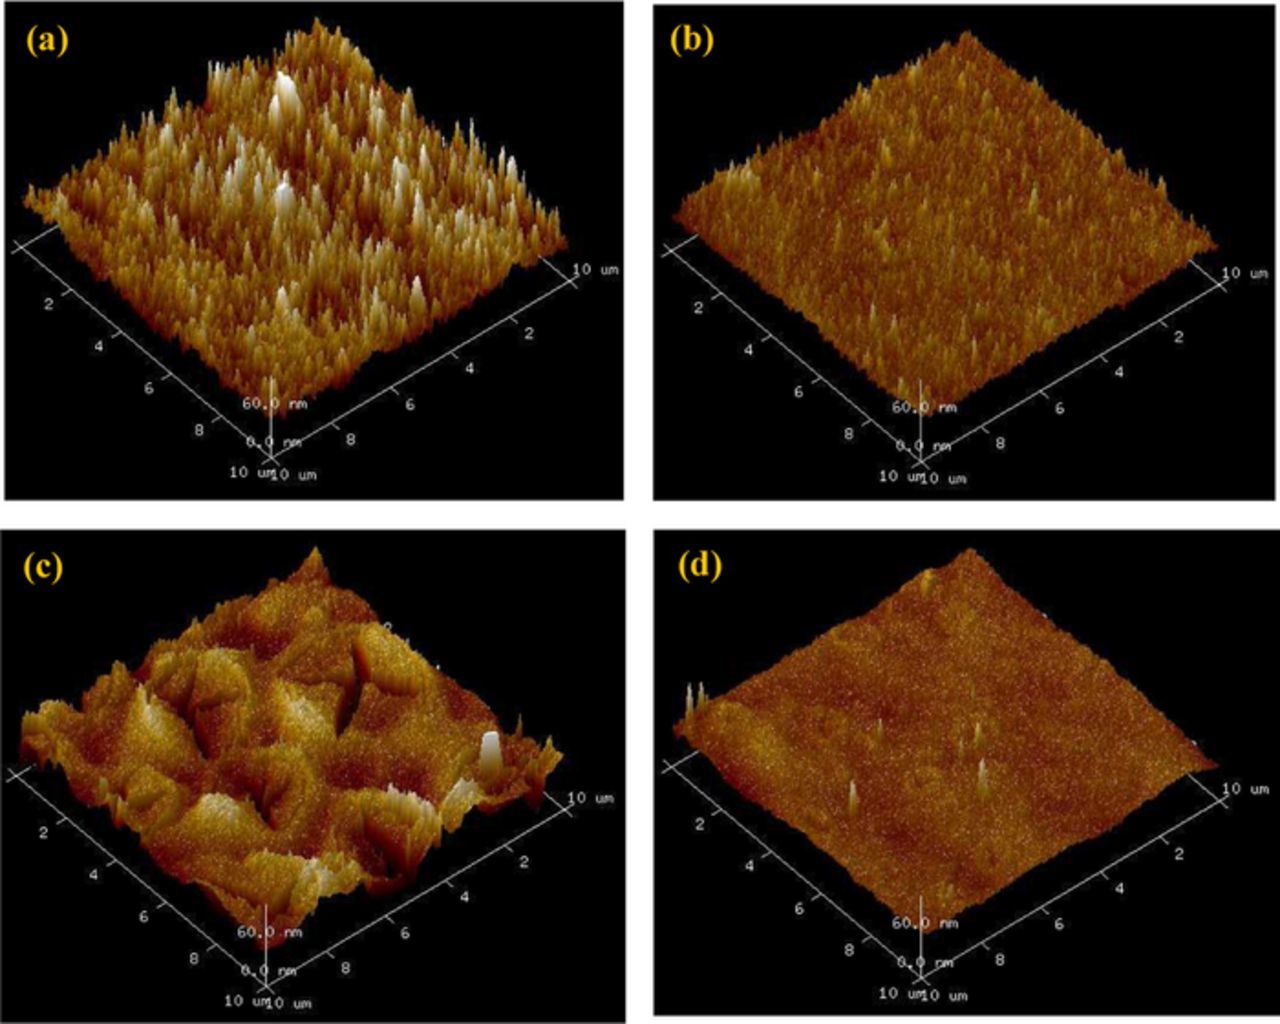
Figure 2. AFM top view images of the TCC coatings with surface area of 10 × 10 μm² (a) Cr + Ox, (b) Cr + Cr + Ox + Co (c) Cr + F, (d) Cr + F + Co.
Considering Fig. 2c, at first glance, the observed shape might be mistaken with an artefact of the AFM cantilever. Fig. 3a and Fig. 3b present the SEM top view images of the same sample with low and high magnification, respectively. Fig. 3a indicates that the surface was formed of a sun-cross like structures with different sizes, approximately in the range of 1–2 μm (Fig. 3b). These structures conform to the surface topography seen in Fig. 2c. Therefore, SEM and AFM top view images show similar structural patterns for the film formed by the fluoride-containing solution.
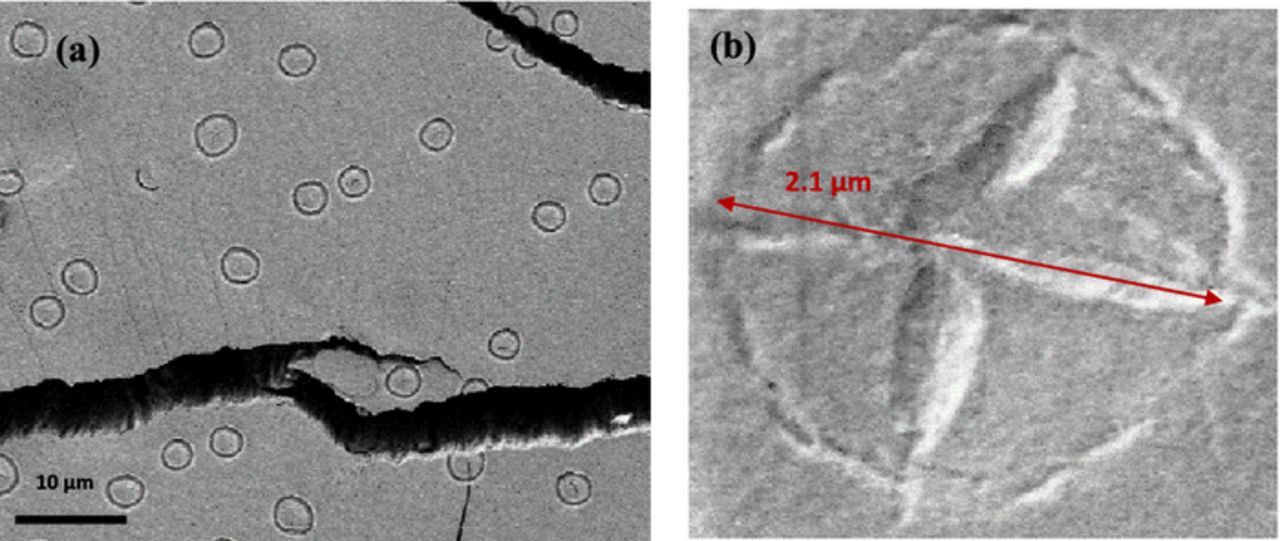
Figure 3. Top-view SEM images of Cr + F surface without being sputtered (a) with low magnification, (b) with high magnification.
Surface roughness measurements were also extrapolated from the topographical data obtained from AFM (Table V). The non-passivated zinc surface showed a relatively low roughness (10.6 nm). Regarding the passivated samples, the results imply that cobalt addition to the treatment solutions reduced the Ra value of the layer (e.g. from 15.3 nm for the film produced by fluoride-containing treatment solution to 7.6 nm for the film made by the same solution plus addition of cobalt).
Table V. Roughness of the TCC coatings measured over an area of 10 × 10 μm².
| Ra (Average roughness) (nm) | |
|---|---|
| Zinc Substrate | 10.6 ± 0.4 |
| Cr + Ox | 13.0 ± 0.6 |
| Cr + Ox + 1/2Co | 12.1 ± 0.3 |
| Cr + Ox + Co | 10.3 ± 0.2 |
| Cr + F | 15.3 ± 0.8 |
| Cr + F + 1/2Co | 9.8 ± 0.2 |
| Cr + F + Co | 7.6 ± 0.4 |
To shed light on the growth kinetics of the TCC coatings, the effects of immersion period and bath temperature on the layer thickness and the amount of deposited chromium were investigated. Firstly, the zinc layer was subjected to the passivating bath for three different immersion times of 40, 60 and 80 s at 40°C. The thickness of the formed layers was evaluated by means of FIB-SEM and the amount of deposited chromium was measured by XRF. Fig. 4 indicates that for all cases, the increment of immersion time from 40 s to 60 s, led to higher values of thickness and precipitated chromium. However, the immersion time of 80 s did not necessarily produce a thicker film. This implies that a part of the passivated film might have been dissolved between 60 s to 80 s. Despite a correlation between thickness and Cr content, adding cobalt to the fluoride-containing solution did not increase the thickness of the layers formed during any immersion time, although it increased the amount of deposited Cr in the layer.
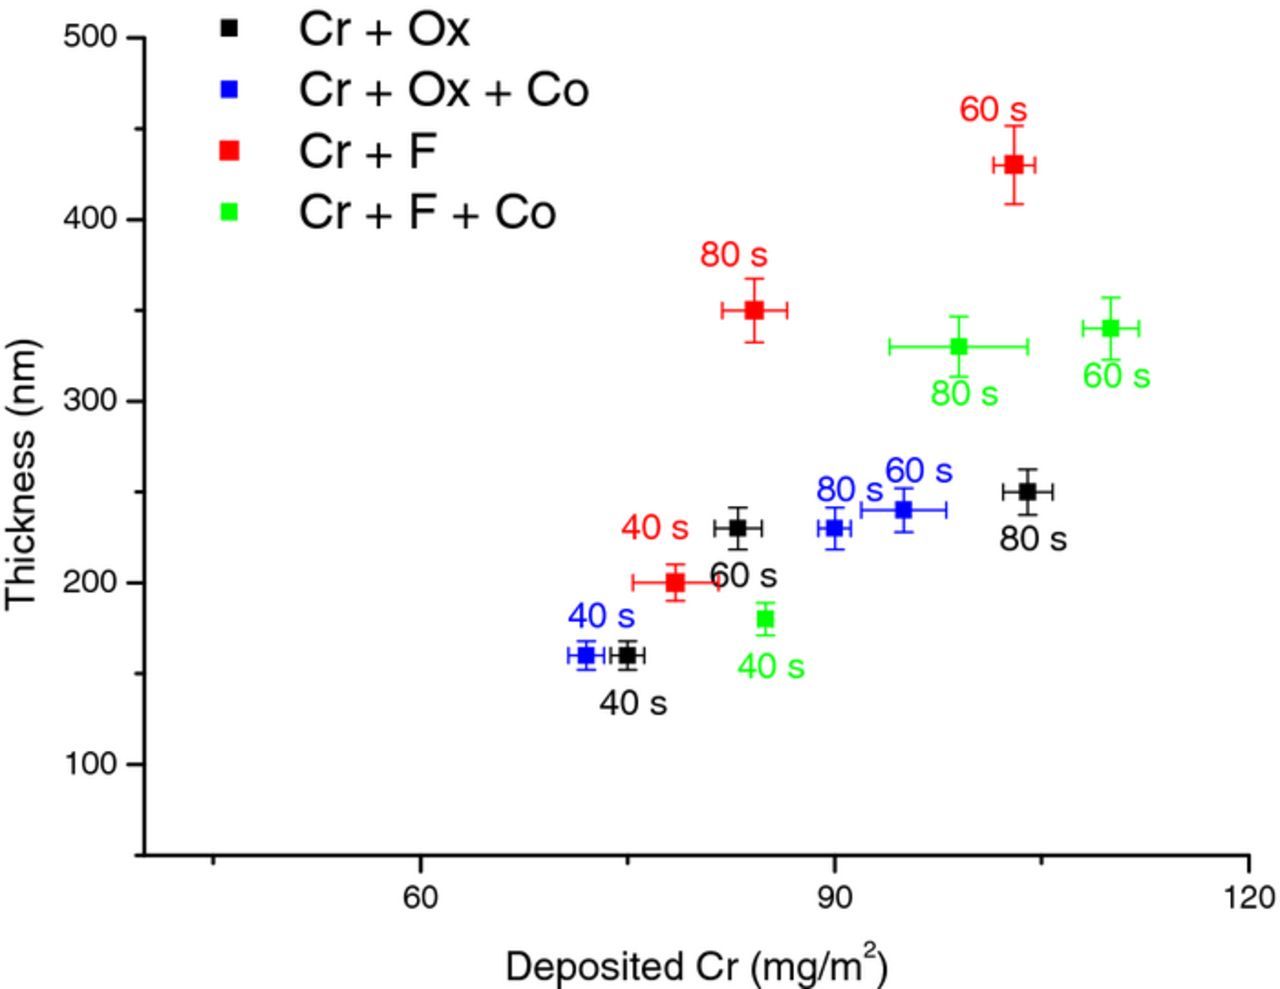
Figure 4. Effect of passivating immersion time on TCC coating. Thickness(nm) from cross-section FIB-SEM and Cr(mg/m2) from XRF coatings (a) Cr + Ox, (b) Cr + Ox + Co (c) Cr + F (d) Cr + F + Co.
Additionally, the influence of passivating bath temperatures was studied by applying solution treatment for the 60 s of immersion time at three different temperature of 3°C, 18°C, and 40°C. Fig. 5 indicates that the layers formed in treatment solutions at 3°C with the same complexing agent, had almost the same amount of deposited Cr and layer thickness. Afterward, with increasing temperature from 3°C to 40°C, significant changes appear. For example, adding cobalt to the oxalate-containing treatment solution showed higher Cr content as well as a higher thickness of the formed layers with increasing bath temperature. The same is valid for the layers formed in the fluoride-containing solutions, except for the fact that for this case the thickness did not increase with increasing the Cr deposition. In summary, the rate of film formation was enhanced at a higher temperature. The fact that cobalt effect was observed by increasing temperature might suggest that this element influenced the kinetics of coating deposition.
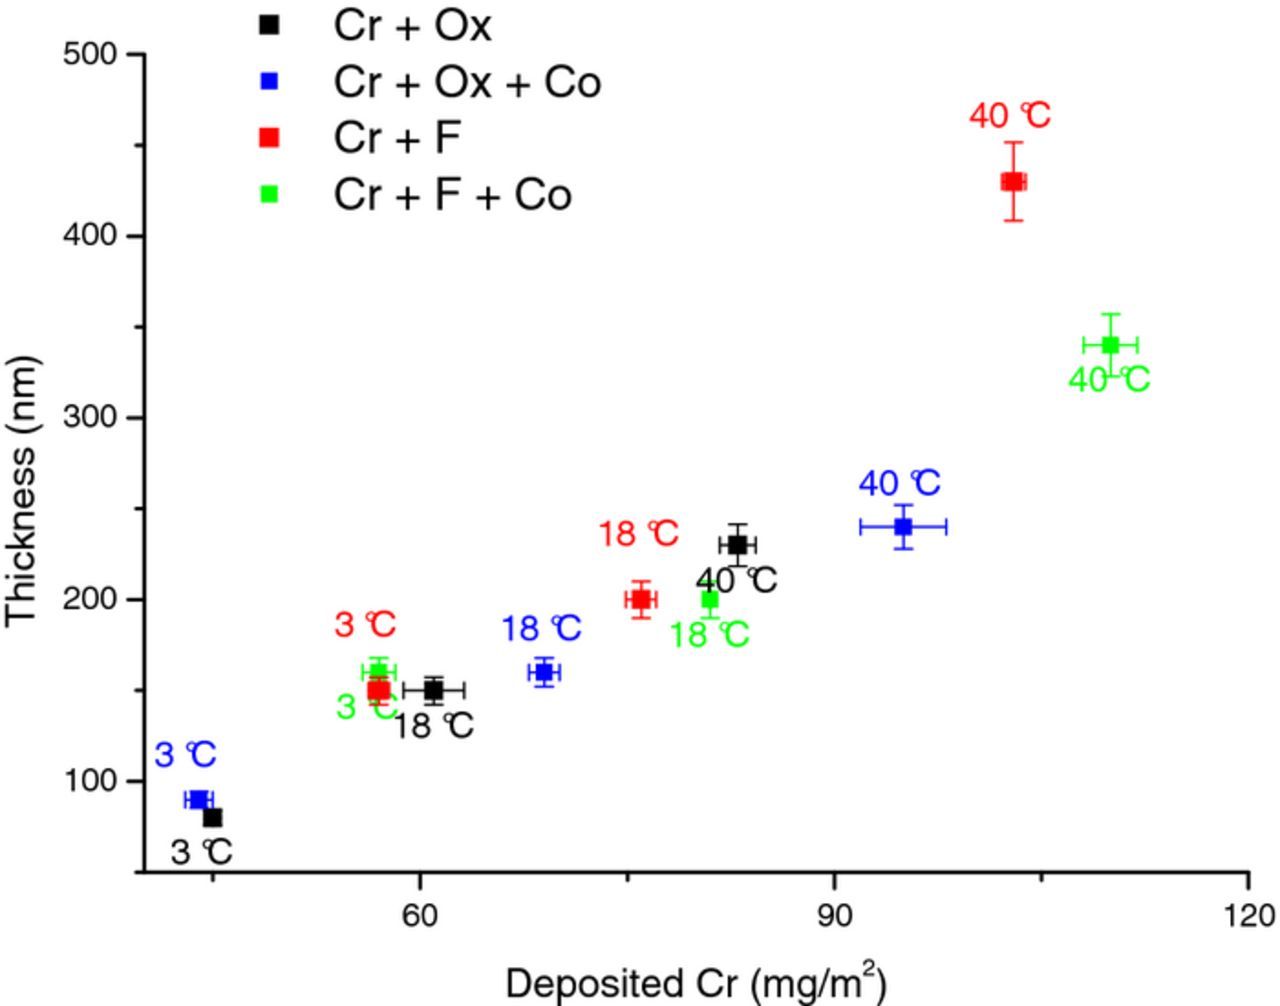
Figure 5. Effect of Passivating bath temperature on TCC coating. Thickness(nm) from cross-section FIB-SEM and Cr(mg/m2) from XRF coatings (a) Cr + Ox, (b) Cr + Ox + Co (c) Cr + F (d) Cr + F + Co.
Layer composition analysis
The solution from leaching the coating in 10% HCl was analyzed by ICP-OES and the results are listed in Table VI. The data in Table VI indicate that the amount of chromium observed in the extracted solution of the films formed in the fluoride-containing treatment solution (e.g. 106.6, 109.4, and 110.4 mg/l) was more than in the case of the oxalate-containing solution (e.g. 60.8, 64.9, and 68.2 mg/l). However, more cobalt was incorporated into the layers formed in the oxalate-containing treatment solution (e.g. 12.1 mg/l for Cr +Ox + Co sample, while 6.3 mg/l for Cr + F + Co sample). For the treatment solutions with either complexant, the Cr content of the layer was higher when cobalt was also present in the passivating bath (e.g. 60.8 mg/l for Cr + Ox and 68.2 mg/l for Cr + Ox + Co).
Table VI. Total dissolved cobalt and chromium of leached TCC coatings, analyzed by ICP-OES.
| Measured amount of cobalt and chromium | ||
|---|---|---|
| Passivation | Cr (mg/m2) | Co (mg/m2) |
| Cr + Ox | 60.8 ± 0.4 | <LOD* |
| Cr + Ox + 1/2Co | 64.9 ± 0.2 | 5.9 ± 0.3 |
| Cr + Ox + Co | 68.2 ± 0.3 | 12.1 ± 0.2 |
| Cr + F | 106.6 ± 0.3 | < LOD* |
| Cr + F + 1/2Co | 109.4 ± 0.2 | 2.9 ± 0.2 |
| Cr + F + Co | 110.4 ± 0.4 | 6.3 ± 0.4 |
Surface analysis and depth profiling
Depth profiling was carried out by evaluating the Auger intensities of the major constituent elements in the layer. The Auger parameters for the measured elements are listed in Table VII. There are two peaks allocated to cobalt, at Co1 ∼ 705 eV and Co2 ∼ 772 eV. There is another peak, F-Co at 660 eV, which is a superposition of two Auger peaks of the F KLL Auger peak and the Co L2M23M23 Auger peak. In the case of fluoride-containing samples, the peak reflects the F concentration, because the part of Co which contributes to this peak is negligible. AES depth profile of the passivated samples presented Zn, O, C, and Cr as the primary coating elements. For all coatings, the signal of zinc reached a constant value as the oxygen signals decayed to zero at the same depth. The Auger depth profiles were quantified by using the elemental sensitivity factors of the spectrometer software (Table VII). The quantitative depth profiles were once evaluated using the Co1 peak and another time using the Co2 peak. The depth scale was calculated by converting the sputter time scale into the depth with the known thickness of each sample from FIB-SEM. The sputter time at which Zn atomic concentration reached 80% was specified as the conversion coating thickness. The quantitative Auger profiles of the four samples are depicted in Fig. 6.
Table VII. Auger parameters for the measured elements.
| Auger | Auger peak | Sensitivity | ||
|---|---|---|---|---|
| Element | transition | position | Measured range | factor |
| C | KLL | ∼262eV | 230 eV ... 287 eV | 0.6 |
| O | KLL | ∼514eV | 440 eV ... 800 eV | 0.96 |
| Cr | L3M45M45 | ∼575eV | 440 eV ... 800 eV | 0.09 |
| F | KLL | ∼660eV | 440 eV ... 800 eV | 0.38 |
| Co | L3M23M45 (Co1) | ∼705eV | 440 eV ... 800 eV | 0.41 |
| Co | L3M45M45 (Co2) | ∼772eV | 440 eV ... 800 eV | 0.52 |
| Zn | L3M45M45 | ∼993eV | 930 eV ... 1040 eV | 0.58 |
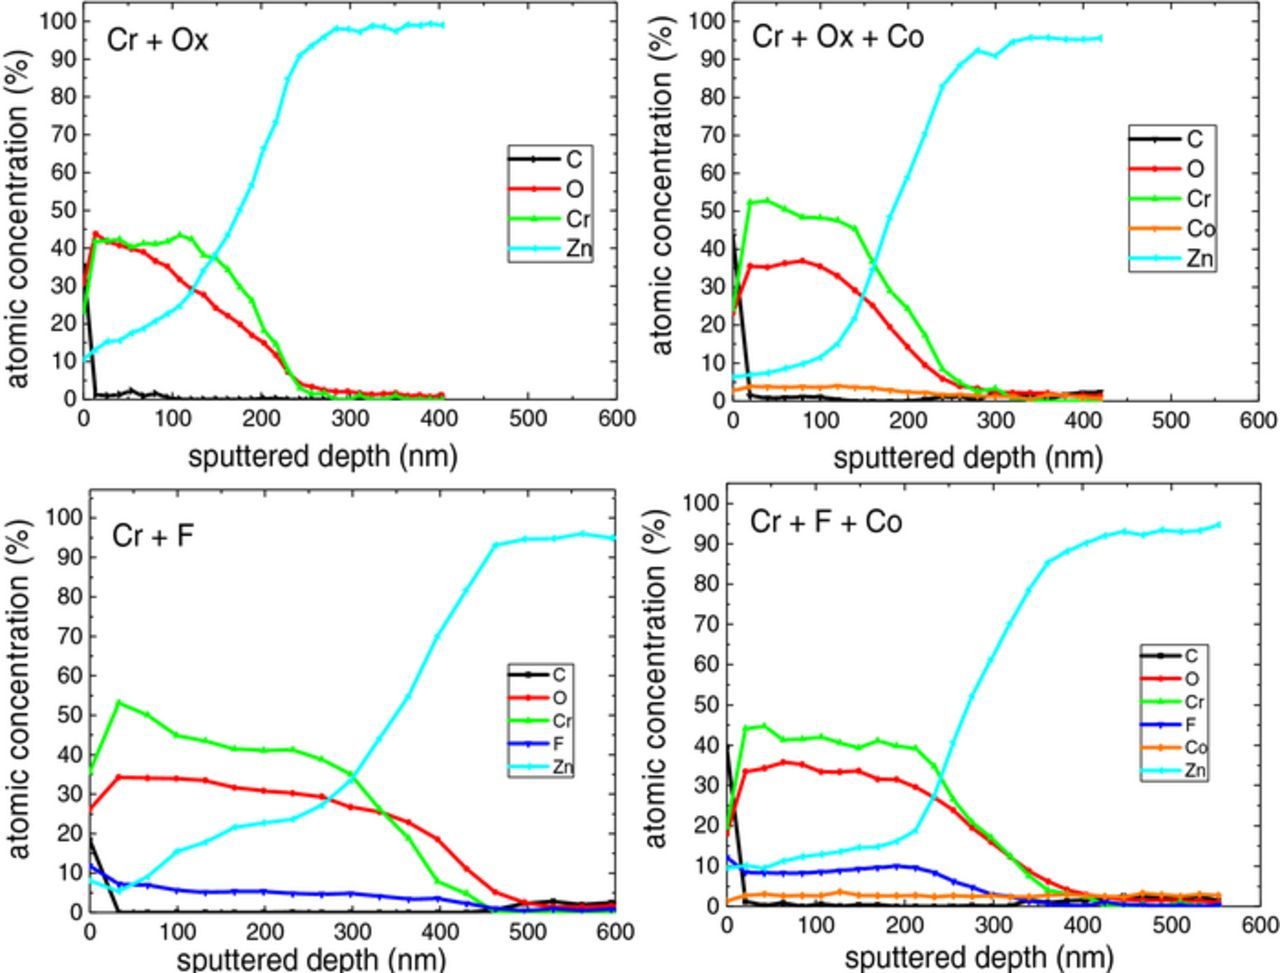
Figure 6. Quantitative Auger depth profiling of TCC coatings, (a) Cr + Ox, (b) Cr + Ox + Co, (c) Cr + F, (d) Cr + F + Co.
Oxygen content within the layer increased initially compared to the level at the surface, then stabilized before declining at a depth corresponding to the zinc substrate. The concentration of all elements except zinc decayed with further depth profiling into the coating. For almost all samples, carbon was only seen at the very surface, which might be the influence of being exposed to ambient atmosphere. For the case of fluoride-containing treatment solution, the results indicate enrichment of fluorine with a comparable amount of chromium in the layer. It is proposed that the layers consisted of a mixture of metal (Cr, Zn and perhaps Co)- oxide, hydroxide, fluoride, and possibly oxyfluoride species. The Cr, F and Co concentrations of the relevant samples are compared in Fig. 7. The AES results do not indicate a significant difference in Cr intensity between the layer formed in fluoride and oxalate-containing baths (Fig. 7a). Besides, the layer formed in the treatment solution including cobalt and fluoride contained clearly more fluorine than the one prepared by the fluoride-containing solution without cobalt (Fig. 7b). Large negative values of the free enthalpy of formation of CrF3 (−1088.0 kJ/mol)41 and former XPS investigations which found CrF3 in the TCC coating42 suggest that a part of chromium is bonded with fluoride. Moreover, cobalt was detected in the coatings formed by the treatment solution containing cobalt. The Co concentration was calculated with the Co1 ∼ 705 eV (Fig. 7c) as well as the Co2 ∼ 772 eV (Fig. 7d). In good agreement with ICP results, the cobalt-fluoride-containing sample contained significantly less cobalt compared with the sample formed by the treatment solution containing oxalate and cobalt (Figs. 7c and 7d).
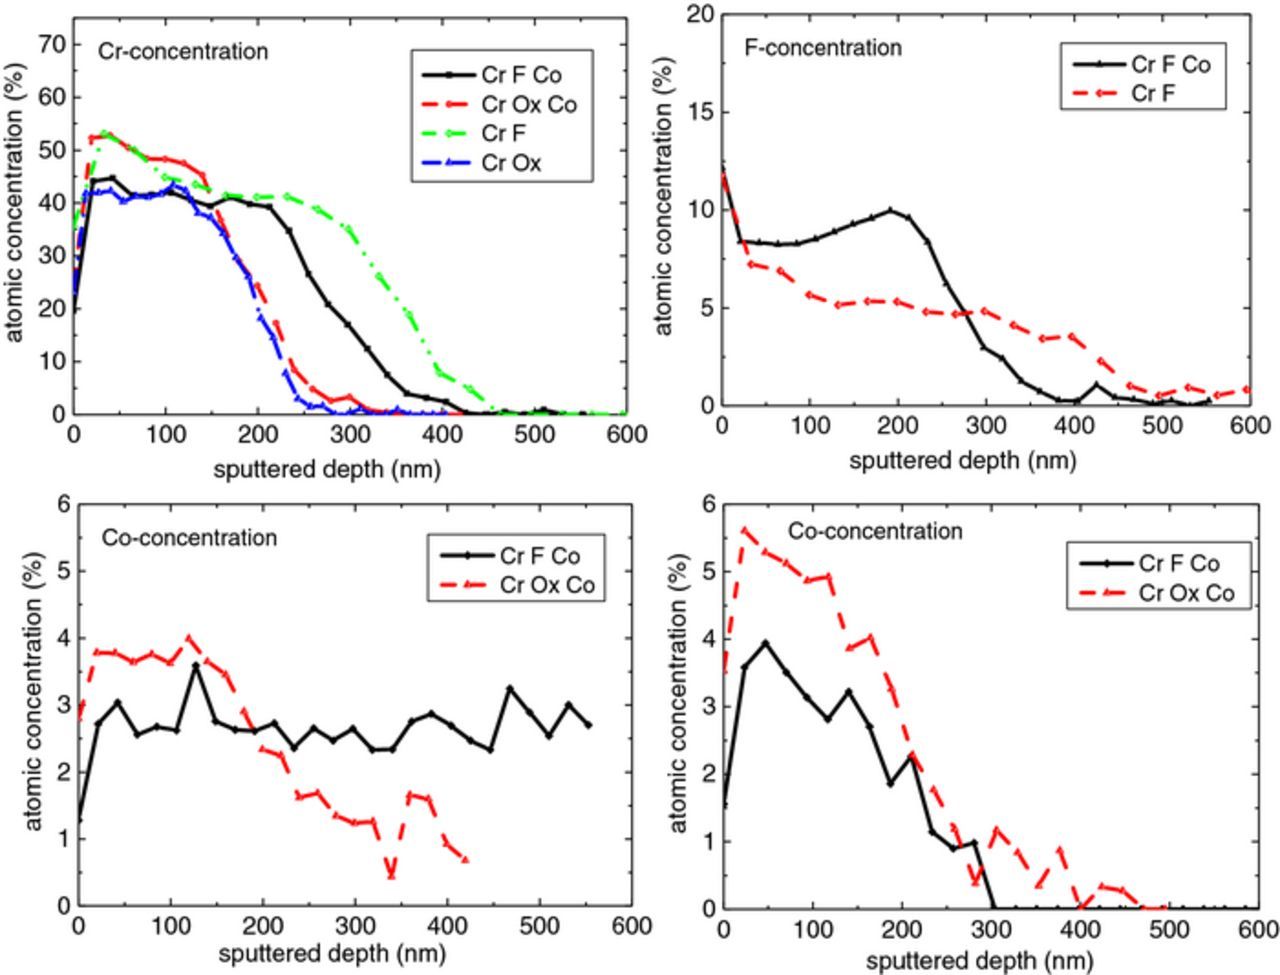
Figure 7. Quantitative Auger depth profiles of a) Cr concentration, b) F concentration, c) Co concentration evaluated with the Co1∼ 705 eV peak, d) Co concentration evaluated with the Co2 ∼ 772 eV peak.
When the level of Cr in the studied TCC coating on the Zn substrate and that on the Al substrate are compared, it can be seen that the level of Cr in the TCC coating was quite high (40–50 at. %). This is significantly higher than the Cr levels in the TCC coatings (ca. 10 at. %) formed on aluminum.33,35,36 The underlying reason might be that the process of conversion coating is closely related to the dissolution of the substrate. The solubility of zinc in an aqueous solution and especially in an acidic medium is higher than the solubility of aluminum. Therefore, the formulation of a conversion coating might vary depending on the substrate used. The TCC bath designed for Al substrate is usually based on zirconium (Zr) and/or titanium (Ti),25,30,43,44 which is why there is less Cr in the resulting layer. Furthermore, the level of Cr in the TCC coating is proportional to the Cr concentration in the treatment solution, and many of the TCP coatings formed on aluminum were done using proprietary passivating baths.28,32–36 The drawback of the research on commercial TCP coatings is that the exact composition and especially the amount of Cr in the passivating bath are usually unknown. Moreover, immersion time also has a large effect on the Cr content in the layer. As an illustration, Cr 2p3/2 spectrum fitting for the chromate layer on zinc of a previous study shows that the atomic percentage of Cr in the layer with a chromating time of 30 s to 60 s is around 40–50%.45
Comparing the Cr and Co concentration in the treatment solution to the measured atomic concentration of these elements from AES, it is visible that the ratio of Cr concentration (0.08 M) to the Co concentration (0.004 M) in the treatment solution, is comparable to the ratio of detected Cr (40–50%) to that of cobalt (∼5%) in the formed layer.
Potentiodynamic polarization curves
The anodic potentiodynamic polarization curves of the passivated zinc layers in 5% NaCl solution are shown in Fig. 8. The polarization curves showed a good reproducibility. Values for jcorr and Ecorr, for each TCC coating, were obtained by the Tafel line extrapolation of the anodic j-E curve and are listed in Table VIII. Comparing the corrosion potential of the bare zinc surface (−1.111 V) to the passivated surfaces (e.g. −1.019 V for Cr + Ox), the TCC coatings shifted the corrosion potential toward less negative values. Among the TCC layers, the "Cr + F" sample had the least noble potential, which can be attributed to the high density of pores in this sample (Fig. 1c and Fig. 2c) that form a pathway for the penetration of chloride ions. Comparing the samples, it is noticeable that the corrosion potentials of the surfaces coated by cobalt-containing treatment solutions were more noble. As an illustration, the corrosion potential of the fluoride-containing layer was increased from −1.039 V to −1.009 V by adding cobalt to the treatment solution. This is assigned to the homogenous morphology of these conversion coatings, plus the role of Co ions at low concentrations in the formed layer as a corrosion inhibitor.46 Moreover, the corrosion current density of the zinc surface (2.27 μA/cm2) was higher than for the TCC layers (i.e. around 0.4 μA/cm2). Therefore, the formed layers protect the zinc from the corrosive environment. It is noticeable that the anodic and cathodic branch of the j-E curves show different behaviors based on the complexing agent. Dissolution of zinc is the reaction which takes place in the anodic branch and oxygen and/or hydrogen ion or water reduction occurs in the cathodic branch. A substantial reduction of the anodic branch can be seen for the fluoride-containing layers in comparison with the smaller reduction of the anodic and cathodic branch for the layers formed by the oxalate-containing solution. The decrease in dissolution rate of the fluoride-containing layers might result from passivation of the film matrix. It is observed that the passive region was enlarged by the addition of cobalt to the treatment solutions. As can be seen, the passive region of Cr + F + Co surface with a breakdown potential of about −878 mV vs. SCE was the broadest. It is suggested that the passive film might have been formed during the sample storage time. This might be explained by the highest enrichment of chromium in this layer in comparison to the others, as determined by ICO-OES analysis (Table VI). This sample also showed the lowest roughness based on the AFM analysis (Table V). According to a study,47 the thickness of a passive film is inversely proportional to its roughness. It is proposed that fluoride-containing coatings provided corrosion protection to the zinc substrate through increasing the breakdown potential and suppressing the anodic current density, i.e. lowering zinc dissolution. The decrease in anodic and especially cathodic current density of the films formed in oxalate-containing solution expresses the lowering of both dissolution and reduction reactions, in comparison with that of the zinc surface. Moreover, localized corrosion initiation was inhibited in these types of films due to their denser and less defective morphology. The results indicate the effectiveness of TCC coatings to retard oxidation of zinc by decelerating oxygen and chloride transfer to the zinc substrate.

Figure 8. Potentiodynamic polarization curves of the passivated specimens in the baths under study and immersed in solutions of 5% wt of NaCl.
Table VIII. Ecorr(V vs. SCE) and jcorr(A/cm2) values of the TCC coatings formed after 60 s immersion time.
| No. | Film | Ecorr(V vs. SCE) | jcorr(μA/cm2) |
|---|---|---|---|
| 1 | Zn | −1.111 ± 0.005 | 2.27 ± 0.32 |
| 2 | Cr + Ox | −1.019 ± 0.006 | 1.01 ± 0.34 |
| 3 | Cr + Ox + 1/2 Co | −1.014 ± 0.005 | 0.89 ± 0.11 |
| 4 | Cr + Ox + Co | −1.012 ± 0.003 | 0.86 ± 0.12 |
| 5 | Cr + F | −1.039 ± 0.012 | 0.40 ± 0.14 |
| 6 | Cr + F + 1/2 Co | −1.027 ± 0.010 | 0.51 ± 0.13 |
| 7 | Cr + F + Co | −1.009 ± 0.008 | 0.77 ± 0.32 |
Discussion
Considering the SEM and AFM images, the conversion coatings formed by different passivating baths showed that specifically adding cobalt to the treatment solution reduced the density of microstructural defects. Moreover, the films formed by fluoride-containing solution, and without cobalt, had the highest thickness and number of micropores. Meanwhile, the oxalate-containing treatment solutions produced uniform films. ICP-OES results indicated higher incorporation of chromium for the films formed by the fluoride-containing solution and more cobalt incorporation for the layer produced by the oxalate-containing solution. The latter was also proven by AES. Thus, the ingredients of the treatment solution play a crucial role in the formation mechanism plus film composition and subsequently its structure.
Formation of the TCC coatings
To shed light on the possible composition of the TCC layer formed on the Zn substrate, the chemical speciation of the system with the pH changes was illustrated in Fig. 9. The distribution of the Cr(III), Zn(II), and Co(II) species with pH ranging from 0.0 to 14.0 was calculated using Visual MINTEQ software (ver. 3.1, Stockholm, Sweden, model by KTH, Jon Petter Gustafsson).

Figure 9. The distribution of (a) Cr(III) species in Cr + Ox + Co treatment solution, (b) Cr(III) species in Cr + F + Co treatment solution (c) Co(II) species in Cr + Ox + Co treatment solution, (d) Co(II) species in Cr + F + Co treatment solution, (e) Zn(II) species in Cr + Ox + Co treatment solution, (f) Zn(II) species in Cr + F + Co treatment solution, for pH between 0 to 14 and T = 40°C using VISUAL MINTEQ software.
When the zinc electroplated part is immersed in a Cr(III)-based passivation bath, zinc oxidation (dissolution), reduction of oxidizing agent (NO3−) and hydrogen evolution occur.16,21,48–50 The TCC coating is produced through the substrate dissolution (Reaction 1) which activates the surface (zinc) for electron transfer reactions and favors the cathodic reduction of hydrogen (Reaction 2) and nitrate.
![Equation ([1])](https://content.cld.iop.org/journals/1945-7111/165/10/C657/revision1/d0001.gif)
![Equation ([2])](https://content.cld.iop.org/journals/1945-7111/165/10/C657/revision1/d0002.gif)
The standard potentials of the reactions involved during the cathodic reduction of nitrate ion vs. the saturated calomel electrode (SCE) range from +0.803 to 1.246 V,51,52 which are much more noble than the reversible potential for the hydrogen evolution reaction (HER). Therefore, it can be deduced that nitrate is a stronger oxidizing agent and from a thermodynamic point of view, the cathodic reduction of nitrate would be preferred compared to hydrogen evolution. However, the extent of hydrogen evolution is also governed by the kinetics of the hydrogen reduction reaction on the substrate.53 All the cathodic reactions (including nitrate and hydrogen reductions) induce a local pH increase at the surface.31,54,55 A previous study54 exhibited 2–6 units of interfacial pH rise depending on the coating system. Therefore, due to the consumption of protons at the surface or the formation of hydroxide ion, precipitation of metal hydroxide is facilitated on the substrate surface. Fig. 9 also indicates that increasing local pH aids depositing Cr(OH)3, Co(OH)2, and Zn(OH)2 on the surface during conversion coating for both types of solutions. Figs. 9a and 9b show that in both fluoride and oxalate solutions, Cr3+ starts to precipitate as Cr(OH)3 at the pH levels above 5. Cr may also precipitate as chromium trifluoride (CrF3) in the fluoride-containing solution, starting at the lower pH values (Fig. 9b). Based on X-ray photoelectron spectroscopy (XPS) results, it is proposed that the Cr(III) identified in the TCC coating is mainly representative of an amorphous hydrated Cr(OH)3 rather than a crystalline Cr2O3.21,45 In brief, the chemical state of Cr(III) in the coating, according to XPS analysis of some studies, mainly revealed as hydroxide,19,21,38,45,56,57 oxide19,21,45,57 and fluoride.38
In contrast to some studies,17,21 cobalt was detected in the layers. Given that cobalt oxalate (CoC2O4)(Ksp = 2.9 × 10⁻⁹)41 and cobalt hydroxide (Co(OH)2)(Ksp = 5.9 × 10⁻¹⁵)41 both have a low solubility product, the precipitation of these compounds in the layer formed in the cobalt-containing electrolyte is foreseeable. Fig. 9c shows that for the case of oxalate-containing solutions, cobalt oxalate starts to deposit at low pH values and cobalt hydroxide begins to deposit at a pH above 11. In the fluoride-containing solution, cobalt hydroxide deposition commences at pH values above 9.
Figs. 9e and 9f indicate that zinc hydroxide starts to deposit at pH values above 10 in oxalate-containing solution and above 8 in fluoride-containing solution.
In the nitrate reduction process, the proton supplier is water or a weakly acidic to neutral solution.58 It was shown that the potential of nitrate reduction becomes more positive in the presence of a metal ion because it is suggested that the metal ion acts as an intermediary for charge transfer from the electrode to the nitrate ion.59 Liu et al.60 by employing the I–V curves of the ZnO films, electrodeposited from nitrate aqueous solution with different Zn2+ concentrations and the same NO3− concentration (1.0 M), showed that the reduction of nitrate was enhanced upon increasing the Zn2+ concentration. Moreover, it is suggested that the rate of the nitrate reduction reaction in an electrolyte is increased by the addition of a metal ion which can be precipitated as hydroxide (i.e. Cr3+, Co2+, and Zn2+).51 This can be attributed to the hydrolysis of metal ions which breaks the O-H bond in water and releases an aqueous proton. Ogawa et al.61 performed ac polarography on nitrate reduction in the presence of various metals and discovered a linear shift of the reduction potential correlated to the logarithm of the stability constants for the first hydration of the added metal cations. The results were interpreted as indicating that hydrolysis of metal ion supplied protons to the nitrate ion throughout the reduction process. Fig. 10 shows that for both fluoride and oxalate solutions, Cr precipitates on the substrate at much lower pH values in comparison with Co and Zn. It appears that at pH levels below 9 for oxalate-containing solution and below 7 for fluoride-containing solution, the highest stability constants for the first hydration of the metal belongs to Cr. Thus, it is suggested that in the related pH range for each treatment solution, the hydroxide ions which were produced by the excess nitrate reduction due to the addition of Co2+ (first hydration of Co) were used by Cr. Taking the ICP-OES results (Table VI) into account, that might be the reason for the higher deposition of chromium in the films formed by the cobalt-containing treatment solution. It is suggested that the addition of cobalt to the electrolyte provided more protons, due to the hydrolysis of an extra metal ion, and thus accelerated the rate of nitrate reduction. When the concentration of nitrate and Co2+ are compared, it can be deduced that the interfacial pH value was eventually increased and that facilitated the precipitation of metal hydroxides.
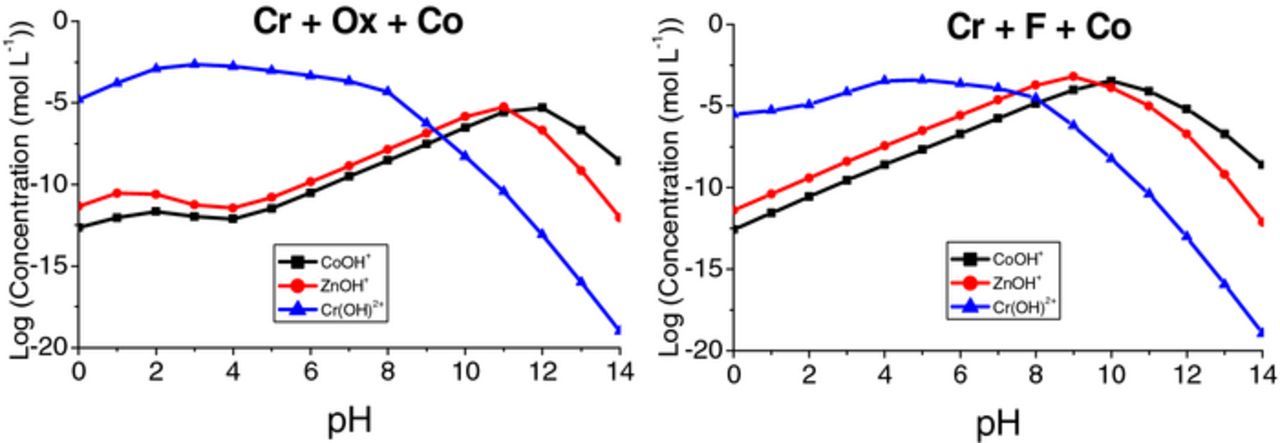
Figure 10. The distribution of first hydration of Cr, Zn, and Co for (a) Cr + Ox + Co solution, (b) Cr + F + Co solution for pH between 0 to 14 and T = 40°C using VISUAL MINTEQ software.
The exponential fit for the layer thickness which is formed during 60 s of immersion time (deposition rate) versus the reciprocal of absolute temperature (passivating bath temperatures; 3°C, RT, and 40°C) for each solution treatment is shown in Fig. 11. Employing this graph as an Arrhenius plot and assuming Cr(OH)3 as the main component of the layer, bring about the activation energy attributed to the TCC coating growth (Table IX). The values indicate that the type of complexing agents impacts the film growth by influencing the activation energy. As an illustration, the activation energy of Cr + Ox + Co sample (21 ± 3 kJ/mol) was higher than the sample produced by a passivating bath with the same amount of Cr and Co, with fluoride complexing agents (14 ± 3 kJ/mol for sample Cr + F + Co). Furthermore, adding cobalt to the oxalate-containing treatment solution did not lower the activation energy associated with the layer formation (comparing 22 ± 4 kJ/mol for Cr + Ox to 21 ± 3 kJ/mol for Cr + Ox + Co), as much as it did for fluoride-containing solution (comparing 18 ± 4 to 14 ± 3).
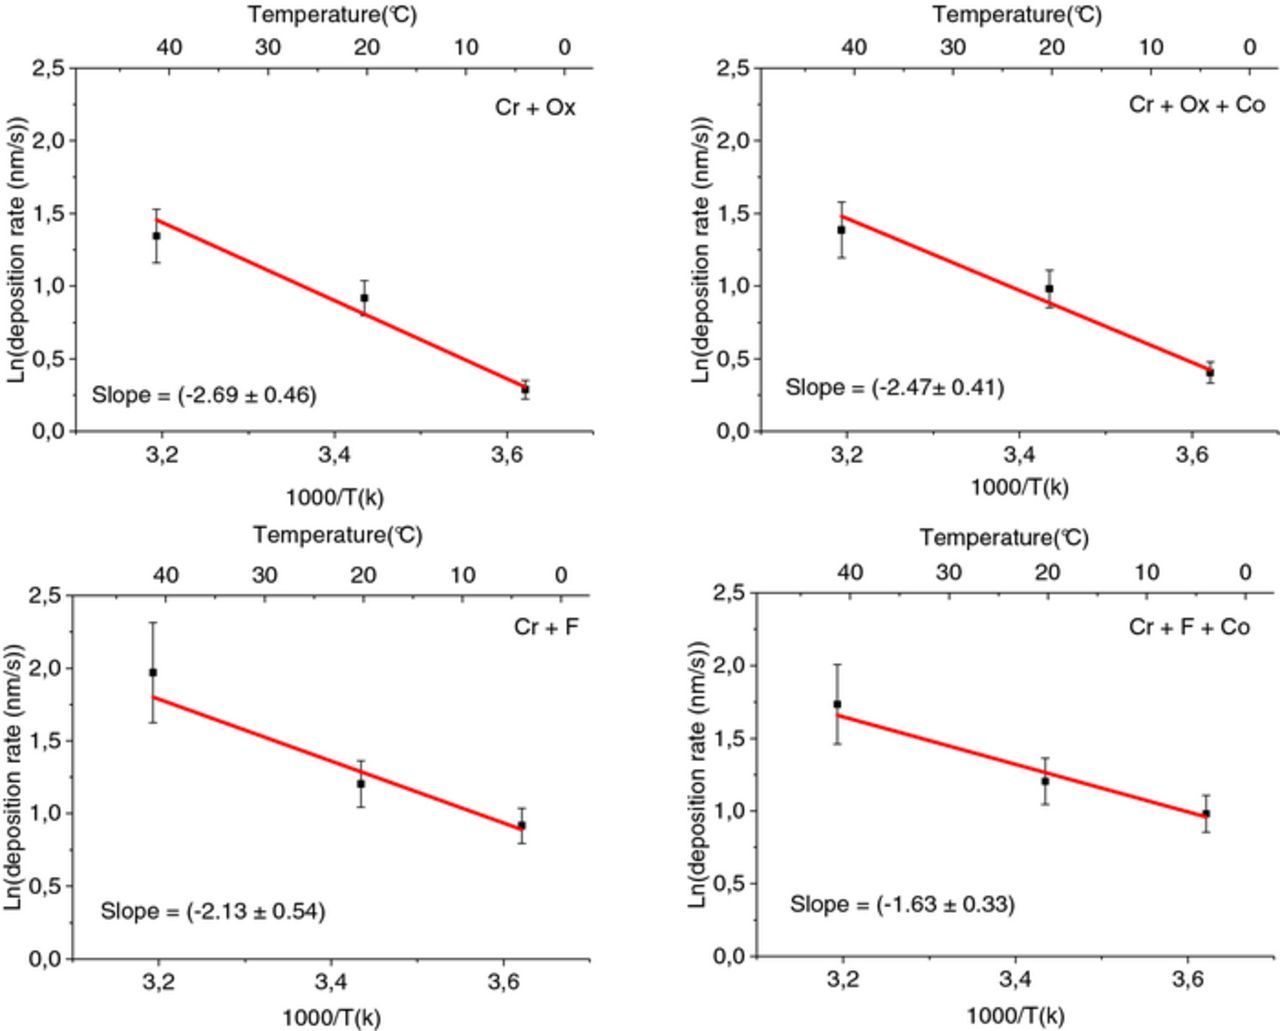
Figure 11. Arrhenius plots of TCC coatings (a) Cr + Ox, (b) Cr + Ox + Co (c) Cr + F (d) Cr + F + Co.
Table IX. Activation energy of the film growth produced by the Cr(III)-based passivation bath.
| Passivation | Activation Energy (kJ/mol) |
|---|---|
| Cr + Ox | 22 ± 4 |
| Cr + Ox + Co | 21 ± 3 |
| Cr + F | 18 ± 4 |
| Cr + F + Co | 14 ± 3 |
The presence of fluoride ions in the treatment solution is reported to activate the surface,62,63 besides dissolving the zinc substrate during the film formation.62–64 Based on the representative data (Table III), the films formed by fluoride-containing treatment agents are around 100–200 nm thicker than those formed by the oxalate-containing solution. This effect relates to the nature of the ligands. In a Cr(III)-based passivating bath, adding complexing agents disassembles the stable Cr(III) aqua complex structure and increases the electrochemical activity by forming [Cr(H2O)6-nLn]3−n (n, complex ion, and L, complexing agents).65 Thus, the lability of the ligand with the metal ion defines the rate of Cr(III) ions precipitation on the substrate. The order of the ligand replacement lability decreases as the ligand field stabilization increases.22 For a metal ion, the ligand field strength increases according to the spectrochemical series.66 According to the spectrochemical series66 and comparing fluoride and oxalate as the complexing agent, the field strength of the ligand which Cr(III) ion is coordinated to is weaker when fluoride is the complexant. Therefore, at a given time, more Cr(III) ions by fluoride-containing solution are deposited onto the substrate. That might be the reason for the higher incorporation of chromium and consequently higher thickness of the film produced by the fluoride-containing bath. Moreover, the presence of fluorine in the AES depth profiling data might imply the formation of compounds such as ZnF2 (ΔG° = −713 kJ/mol51) and CrF3 (ΔG° = −1088 kJ/mol).51 Nevertheless, less cobalt was detected by AES and ICP-OES for the fluoride-containing sample. Since ZnF2 and CoF2 are slightly soluble in water,67 the deposited form of these compounds was possibly dissolved from the treated surface during water rinsing and resulted in lower remained cobalt content and the formed cavities. Furthermore, micro-voids can also arise when byproducts during layer deposition escape as gases and the lateral diffusion of atoms occurs too slowly to fill the gaps, resulting in a tensile stress.68 It was reported that the formation of bubbles that cling to the surface throughout the deposition process may result in voids,69 this process often interferes with film growth and may lead to porous or spongy deposits.70 It was also addressed that evolved hydrogen can produce a non-uniform porous layer by sticking at the surface, concealing the underneath layer.71,72
The reduction of nitrate to gaseous products was reported for various materials in the literature.73–75 The kinetics of nitrate reduction was investigated by Li et al.73 electrochemically, using the gas detector tube method and gas chromatography-mass spectroscopy, the formation of gases, i.e. NO and NO2, was proved. It was shown that the possibility of nitrate reduction reactions highly depends on the pH of the solution. For instance, at pH 4, the reduction of nitrate to N2, N2O, and NO was possible while hydrogen evolution was not possible.
As soon as the zinc plated part is immersed in the treatment solution, a variety of reactions including anodic dissolution, nitrate, and hydrogen reduction, adsorption-desorption of metal-oxide/hydroxide reactions may take place at the interface between the electrolyte and the substrate. While the zinc plated part is still immersed in the bath, different types of gases may form at the substrate surface, either as the result of nitrate reduction or hydrogen evolution. During the conversion process, the gas bubbles may interfere with the film deposition, locally inhibit mass transfer, and form pores as they are leaving the TCC layer.
It was reported that adding surfactants to the passivating bath results in better wetting of the zinc and producing a more uniform film.50 Moreover, adding a substance to the treatment solution which acts as a surfactant, permits the free evolution of the hydrogen76 or other entrapped gases. Oxalate ions were shown to thoroughly encrust the surfactant assemblies.77 Therefore, it can be suggested that in the oxalate-containing treatment solution, the oxalate ions acted as a surfactant which facilitates the free evolution of formed gases. Consequently, fewer micropores and cavities were observed for the film produced by the oxalate-containing electrolyte. Based on previous studies,31,35 cracks, detachment, and delamination were also observed on trivalent chromium process (TCP) coatings on aluminum alloys produced by fluoride-containing proprietary treatment solution.
A schematic illustration of a layer produced by Cr(III)-based treatment solution is depicted in Fig. 12. During the conversion coating process, a mixture of the above-mentioned gases may form in the reaction layer between the substrate (zinc) and the bulk electrolyte (Fig. 12a). The formed gases may hinder the smooth deposition of metal hydroxide/oxide on the substrate. Throughout the TCC process, in the regions in which the deposition reactions are taking place, there are forces parallel to the substrate, due to the surface tension (vertical blue arrows); there are normal forces caused by the agitation perpendicular to the zinc substrate (green arrows); and there is the internal pressure of the formed bubbles (black arrows). As the bubble expands, its internal pressure decreases,78 and the resultant forces cause the bubble to detach from the reaction layer. After detachment of a bubble, the gas region consists of disjoint volumes. However, the TCC process duration might not be long enough to fill the gap with metal hydroxide/oxide depositions. As a result, the microstructural defects are formed in the TCC layer. A previous study indicated that water was entrapped through the formed micropores in the layer.79 The ultimate morphology of a TCC coating exhibits a duplex structure (Fig. 12b); a thick barrier layer with microstructural defects (micropore and voids) is formed on the Zn substrate and a thin layer on top of that. It is not clear why and when the second layer is formed. Considering the AES depth profiling of the TCC coating, the outer layers (first 20–40 nm of the coating) consist of C, Zn, F and Co for those samples which had these elements in their passivating solution. Cr and O seem to increase as the inner TCC layer is reached. It may also be that the top layer was formed after withdrawing the samples from the passivating bath because of exposure to oxygen or humidity in the air. Therefore, the film (inner layer) was reacted with ambient oxygen and humidity and as a result, a dense continuous barrier (outer) layer was formed on top of that. Besides, the coating morphology was clearly influenced by adding cobalt to the treatment solution, in a way which favors the production of a smoother film.
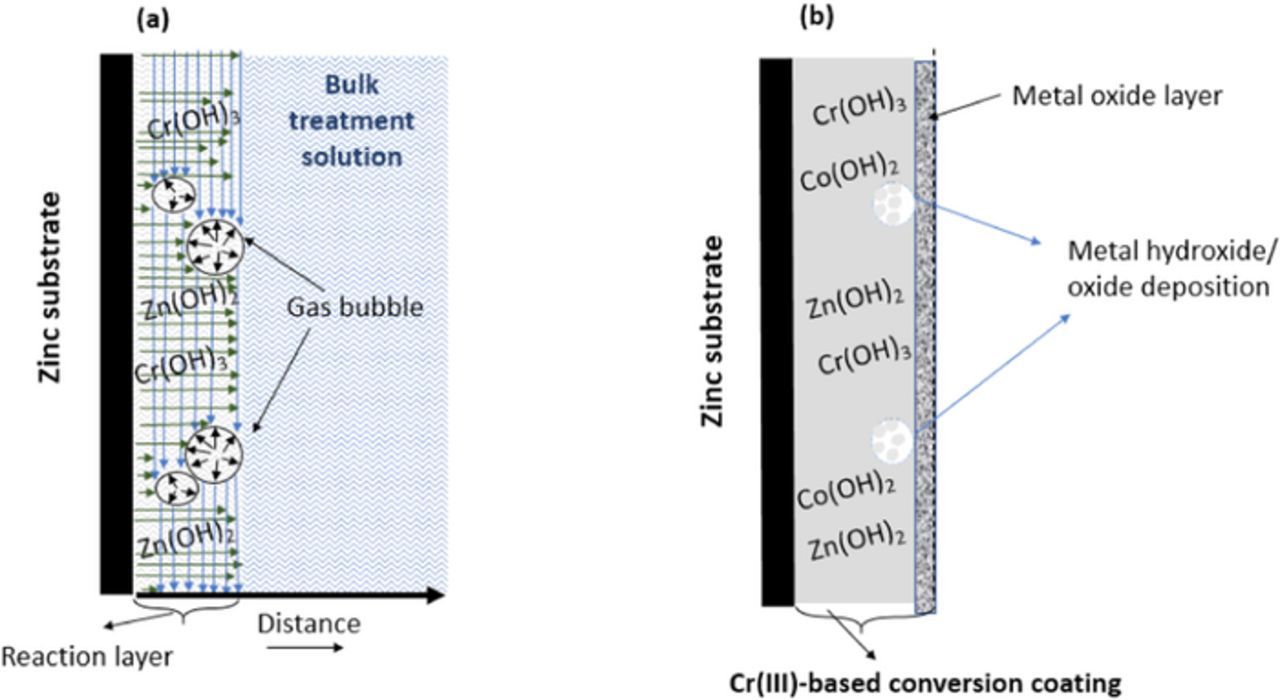
Figure 12. A schematic illustration of (a) TCC coating formation during immersion time, the vertical blue arrows show the forces due to surface tension, acting along the direction parallel to the interface; the horizontal green arrows indicate the normal tension perpendicular to the zinc substrate due to the agitation (manual shaking) throughout the immersion time; the black arrows show the force due to the internal pressure of the formed bubbles. The reaction layer is the area between the substrate and the bulk treatment solution, in which during the TCC process the deposition reactions are taking place. (b) A schematic illustration of the ultimate morphology of the formed TCC layer.
Influence of immersion time
As the film is forming, the reaction layer occludes the zinc surface and the reaction between the zinc surface and the Cr3+ ions continues by diffusion of the active constituents through the film. It might be that the layer is thickened until the substrate is protected from the oxidizing agent in the passivation solution. In other words, when nitrate (oxidant) in the treatment solution no longer contacts the zinc/zinc oxide interface to be able to dissolve it, the film thickness reaches a limiting value.
It was shown that increasing immersion time did not necessarily lead to an increased thickness of the film. Figs. 9a and 9b also indicate that for pH values higher than 9 in oxalate-containing solution or higher than 10 in fluoride-containing solution, solubility increases due to the formation of a more soluble complex, [Cr(OH)4]−. Therefore, it is suggested that by increasing the immersion time from 60 to 80 s, due to an increased interfacial pH, a part of the deposited Cr(OH)3 was dissolved as [Cr(OH)4]− (Reaction 3).
![Equation ([3])](https://content.cld.iop.org/journals/1945-7111/165/10/C657/revision1/d0003.gif)
Gigandet et al.80 showed that in the chromate conversion coating process, the chromate film reaches a limiting thickness at a specific immersion time attributable to the dissolution/deposition mechanism of the film formation. It is suggested that as the immersion time increases initially, the coating gets thicker until the path from the substrate through reaching the treatment solution is closed.62 Afterward, film thickening ceases. Subsequently, the metal oxidation stops until some of the formed films are dissolved again; therefore, the resistivity drops, and oxidation starts again. It is also reported that for TCC coating, the zinc substrate becomes passive as the layers are deposited, and this process retards its oxidation.39 Hence, although various reaction species can still access the Zn substrate via diffusion through the porous passive layer, the passivation of the substrate decelerates the pH increase near the surface of the growing film. Thereafter, the formed layer re-dissolves into the solution as proton concentration along the surface is restored via diffusion driven by the proton concentration gradient built up ahead of the growing film. Therefore, it is suggested that increasing immersion time does not necessarily lead to a thicker layer. The limiting thickness is probably influenced by the passivation bath processing parameters, immersion time plus temperature and pH of the solution, as well as its composition.
Conclusions
The trivalent chromium-based model solutions with two different complexing agents, fluoride and oxalate, were applied on zinc plated steel. Results obtained in the present study imply that the TCC coating is deposited in a layered structure, which is thinned through heat-treatment. The thicker coating does not necessarily better protect the film against corrosion. In general, the TCC coatings protected the zinc substrate by reducing the cathodic and, especially, anodic current density and shifting the corrosion potential, Ecorr. The type of complexant was shown to play an essential role in Cr(III) ions lability in the bath, and therefore, deposition of this ion on the zinc surface as well as the structure and corrosion protective properties of the film. Based on ICP-OES measurement, when fluoride was the complexing agent, more Cr was deposited on the zinc substrate, while when oxalate was the complexant, more cobalt was incorporated into the coating. Moreover, the fluoro ligand produced a porous layer that was thicker, while oxalate made a thinner and yet more uniform film. Microstructural defects in the layer formed in the fluoride-containing treatment solution were ascribed to the formation of gas bubbles (i.e. N2O, N2, H2), locally interfering coating precipitation and prohibiting uniform deposition of metal compounds on the substrate. In contrast, oxalate ions act as a surfactant that improves wetting over the zinc substrate and prevents gas bubbles to adhere on the surface. Addition of cobalt to the treatment solution with either complexant resulted in smoother layers formed. Cobalt might have affected the kinetics of the film deposition throughout the TCC process. This will be the subject of further investigations. Furthermore, the thickness of the TCC increases with increasing immersion time to the point at which the competition between the growth of TCC and Zn dissolution leads to an optimal film thickness. It is proposed that the formation of a packed layer with fewer cavities, which is influenced by the type of anions in the treatment solution, is one of the main keys to the resistance of the coating against corrosion.
Acknowledgments
S.H. gratefully acknowledges Technische Universität Ilmenau and Atotech Deutschland GmbH for the given fellowships. Also, the authors acknowledge financial support for the in situ atomic force microscope by the German Research Foundation (DFG), the free state of Thuringia, and the European regional development Fund (EFRE) (DFG-Gz: INST 273/56-1 FUGG) and Mario Kurniawan for taking the AFM images. Besides, the author would like to appreciate Dr. Nickel in Atotech Deutschland GmbH for giving the opportunity to access to the ICP-OES device.
ORCID
Sanaz Hesamedini 0000-0003-2658-2873
Andreas Bund 0000-0001-9837-2408