Abstract
The unique properties of graphene blended with palladium deposition were used for sensing application by virtue of its charge transfer properties. Epinephrine (EP) is anodically oxidized on a glassy carbon electrode (GCE) modified by palladium graphene composite in phosphate buffer solution of pH 7. The electrodeposited palladium over the GCE – graphene surface ensures fast electrochemical determination of EP. The electrode served as a sensing platform for the simultaneous voltammetric determination of EP, ascorbic acid (AA) and uric acid (UA). The electrochemical deposition of palladium has greatly enhanced the surface properties. Cyclic voltammetry (CV), differential pulse voltammetry (DPV) and chronoamperometry were used to assess the electrochemical performance. Investigations reveal that the process is adsorption controlled involving two electrons and the average catalytic rate constant is 2.39 × 10³ M−1s−1. Palladium incorporated electrode sensitively determined EP in presence of the usual interferents uric acid (UA) and ascorbic acid (AA) with well resolved peaks at very minute concentrations. DPV method enabled the highest sensitivity of 100nM for EP, 170nM for UA and 22μM for AA. The modified electrode offered excellent performance toward real samples such as blood serum and urine.
Export citation and abstract BibTeX RIS

This is an open access article distributed under the terms of the Creative Commons Attribution 4.0 License (CC BY, http://creativecommons.org/licenses/by/4.0/), which permits unrestricted reuse of the work in any medium, provided the original work is properly cited.
Epinephrine (EP), ascorbic acid (AA) and uric acid (UA) are important biomolecules that co-exist in the extra cellular fluid of the central nervous system and serum. EP is an important catecholamine neurotransmitter responsible for various biological and chemical processes. EP is synthesized through a natural process in human body from L- tyrosine. Studies on the electrochemistry of EP is important because it regulates heart beat and plays a significant role in treatment of diseases such as cardiac arrest, anaphylaxis, hypertension, glaucoma, bronchitis, bronchial asthma and other allergic conditions.1 Uric acid (UA) is the primary product of purine metabolism2 and its level ranges from 41–88 mgmL−1 in serum.3 Abnormal concentration level of UA is an indication of several diseases, such as gout, hyperuricemia and Lesch – Nyhan syndrome, Leukemia, Pneumonia etc.4–6 Ascorbic acid, commonly known as vitamin C also plays a very significant role and essential to maintain proper function of immune system.7,8 Being an antioxidant, it reacts with histamines and peroxides and in reducing the cancer incidences.9–11 Monitoring the levels of these biomolecules is therefore of great importance and has been a challenge to researchers. Many electrochemical strategies12–15 have been designed and applied for the detection of these samples. Methods like liquid chromatography,16–18 fluorometry,19,20 chemiluminescence,21,22 capillary electrophoresis23 and spectrophotometry24 are being used for the detection of EP, AA and UA. Whereas electro analytical techniques are advantageous for the detection of these electro active molecules by virtue of low cost, fast response, simple instrumentation, high sensitivity and facile miniaturization. But the coexistence of EP, AA and UA results in interference due to their close oxidative potentials. This difficulty in obtaining well resolved signals demands the use of modified electrodes capable of producing resolved signals.
Many reports on modified electrodes are available for the determination of EP, AA and UA, such as electrodes modified by conducting polymers, amino acids, nanocomposite materials etc. Among the different nanomaterials graphene based materials received great interest because of their fascinating surface structure and versatile electrical and mechanical properties.25–27 Graphene is one atom thick planar sheets of sp2 bonded carbon atoms that are densely packed in a honeycomb crystal lattice, which is primarily obtained from reduction of graphene oxide.28 Functionalization of graphene leads to improvement of surface area and related properties resulting in enhanced electrode kinetics, when used for electrode modification.29 There are reports of glassy carbon electrode modification with metal nanoparticles-graphene composites for the electrochemical quantification of EP leading to enhanced sensitivity and low detection limits by virtue of an increased electroactive surface area and efficient electron transfer.30 Metal nanoparticles-dispersed graphene are best known for their synergistic effect in the analytical determination of many biomolecules.31 Noble metal nanoparticles find potential applications in catalysis, energy conversion, sensors and fuel cells.32,33 Palladium is best known for its catalytic effect34–37 and an electrode modification based on graphene palladium can greatly enhance the surface properties of an electrode.38
Graphene sheets are protected by a cloud of π conjugated electrons that prevent the individual carbon atoms from chemical interactions. Any topological defects in graphene can break this barrier and enable the exposure of reactive carbon atoms. Therefore, functional groups or dangling atoms in graphene help to establish strong bonds with a second component. Metal reinforced graphene composites possess outstanding physical and mechanical properties making it an ideal reinforcement material for composites. As graphene is a zero-bandgap material, the presence of defects and functional groups help to open a bandgap and induce a semiconductor behavior.39 Defective sites of graphene are preferred to clean graphene surfaces for the dispersion of metal nanoparticles. Graphene interacts and binds more strongly with transition metals like Co, Ni, Pd and Ti. The hybridization between d-states of transition metals with pZ states of graphene leads to a bandgap opening.
Chemical reducing agents are avoided by choosing a green method of solar exfoliation for the preparation of reduced graphene oxide. In solar exfoliation heating rate is so rapid that exfoliation takes place at much lower temperature than thermal exfoliation and evolution of CO2 and decomposition of functional group occur immediately after irradiation. Layers of reduced graphene oxide expanded due to release of COX gases during irradiation. Additionally, reduction of graphite oxide in aqueous suspension leads to agglomeration of graphene sheets. Moreover, solar exfoliated reduced graphene oxide was found to be highly conducting.40,41Thus, solar exfoliated reduced graphene oxide can offer more effective electrochemical surface area making it suitable for electrode modification. The abundance of palladium on the earth is at least fifty times more than that of platinum, which has raised the interest for intensive research on palladium nanoparticles in areas of electrocatalysis. Palladium forms strong bonds with reduced graphene oxide, which results in altered electronic configuration and band structures near the dirac points.42,43 The strong interaction between the reduced graphene oxide and palladium nanoparticles prevents metal leaching and thus imparts stability in the configuration as well as size distribution.44
The present study aims to investigate the performance of a glassy carbon electrode modified by reduced graphene oxide synthesized by solar exfoliation followed by electrochemical nucleation of palladium toward the simultaneous determination of EP, AA and UA. A fine dispersion of reduced graphene oxide in methanol was drop casted on a glassy carbon electrode (GCE) on which palladium was electrodeposited at a potential 1.4 to −0.6 V. The electro catalytic property of the electrode toward EP was studied using chronoamperometry.
Experimental
Reagents and instrumentation
All chemicals used in this work were of analytical grade and used without further purification. EP, UA, AA, graphite powder (45μm), palladium chloride and potassium permanganate were obtained from Merck. Disodium hydrogen phosphate and monosodium hydrogen phosphate were used to prepare phosphate buffer solution (PBS). Phosphoric acid and sodium hydroxide were used for adjusting the pH of the buffer solution. Deionized water of high quality was used throughout the study. Electrochemical studies including cyclic voltammetry (CV), differential pulse voltammetry (DPV), chronoamperometry and electrochemical impedance spectroscopy (EIS) were carried out using CHI 6046D electrochemical analyzer. A three-electrode system was employed throughout. A glassy carbon electrode (GCE) modified with solar exfoliated reduced graphene oxide (sG), subsequently subjected to electrodeposition of palladium served as the working electrode, a platinum wire as counter electrode and Ag/AgCl as reference. Surface morphology of the modified electrode was examined using Field Emission Scanning Electron Microscopy with Nova nano SEM-450 and Atomic Force Microscopy (AFM) with 5500 Agilent atomic force microscope. Confocal Raman spectrometer, Witec alpha 300 was used for recording Raman spectrum of sG. FTIR spectra of graphite oxide (GO) and sG was recorded on Thermo Fisher Scientific Nicolet iS50 FTIR spectrometer. Bruker AXS D8 X-ray diffractometer with a Cu Kα radiation source was used for recording powder X-ray diffraction patterns of GO, sG and palladium deposited reduced graphene oxide (sG-Pd).
Electrode modification
Graphite oxide (GO) was synthesized from graphite powder by improved Hummer's method.45 It was subsequently subjected to solar exfoliation by focusing solar rays with the help of a convex lens.41 Change of color from light brown to black following exfoliation and expansion in volume are visible changes indicating the formation of reduced graphene oxide (sG). Graphene suspension was prepared by sonicating 0.5 mg/mL graphene in methanol, which was optimized by observing the peak current for varying concentrations of sG loaded on GCE. A 3mm diameter GCE was polished using 0.05μM alumina slurry followed by ultrasonic cleaning using distilled water and methanol. It is then dried in air. Stable suspension of graphene (5μL) was drop casted on GCE (sG/GCE), dried in air and used for electrodeposition. Electrodeposition of palladium on sG/GCE was done with repetitive potential scan between −0.6 and 1.4 V for seven cycles in an electrolytic solution of 1mM PdCl2 and 1M NH4Cl with pH of 3.4.46 Cycle number was optimized by assessing the performance of electrode with varying amount of palladium loading. The electrode was further subjected to cyclic voltammetry in phosphate buffer to ensure the palladium deposition. The obtained electrode sG-Pd/GCE was rinsed with distilled water, dried at room temperature and used for further electrochemical studies.
Electroanalytical measurements
Voltammetric measurements were carried out at room temperature in 0.1 M phosphate buffer at pH 7. CV and DPV were recorded in the potential range −0.4 to 1.4 V with a sweep rate of 50mV/s. Calibration plots were obtained by running DPV followed by subsequent addition of known concentration of the analytes. EIS experiments were carried out in 1:1 mixture of 1mM K3Fe(CN)6 and 0.1 M KCl solution over the frequency range 0.1 Hz to 1 MHz. Chronoamperometry was recorded with low potential value 0.145V and high potential 0.245 V.
Commercially available adrenaline bitartarate injection solution was used for evaluating practicality of the sensor. Human serum sample (500 μL) was diluted to 10mL and used for real sample analysis. Urine sample was also analyzed as above.
Results and Discussion
Characterization
The layered structure and nanosized pores on graphene sheets are to be investigated through different characterization techniques. XRD, Raman, FTIR, FESEM and TEM were the tools used for the characterization. The addition of palladium brings changes to the surface morphology of graphene sheets beneficial for effective electrochemical performance in a mixture of biomolecules. The techniques adopted for characterization of the composite were XRD, AFM and FESEM. Fig. 1a shows the XRD patterns of GO and sG. A sharp intense peak at 8.90 in GO indicates greater d-spacing,47 showing improved oxidation. The absence of peak around 90 in sG reveals complete reduction. A broad peak obtained at 250 is in accordance with similar results41 suggesting relatively short domain order followed by the nature of stacking of graphene sheets. Fig. 1b shows the FESEM images of the as prepared sG. The wrinkled morphology of sG is clearly visible in the image. Figs. 1c and 1d shows TEM images of sG. It clearly reveals the layered structure and there are nanosized pores in the obtained graphene sheets. These pores are due to the rapid solar exfoliation process and pores play an important role by wetting the surfaces while in contact with the electrolyte and make available the entire stacked surface for the adsorption of the materials.48,49
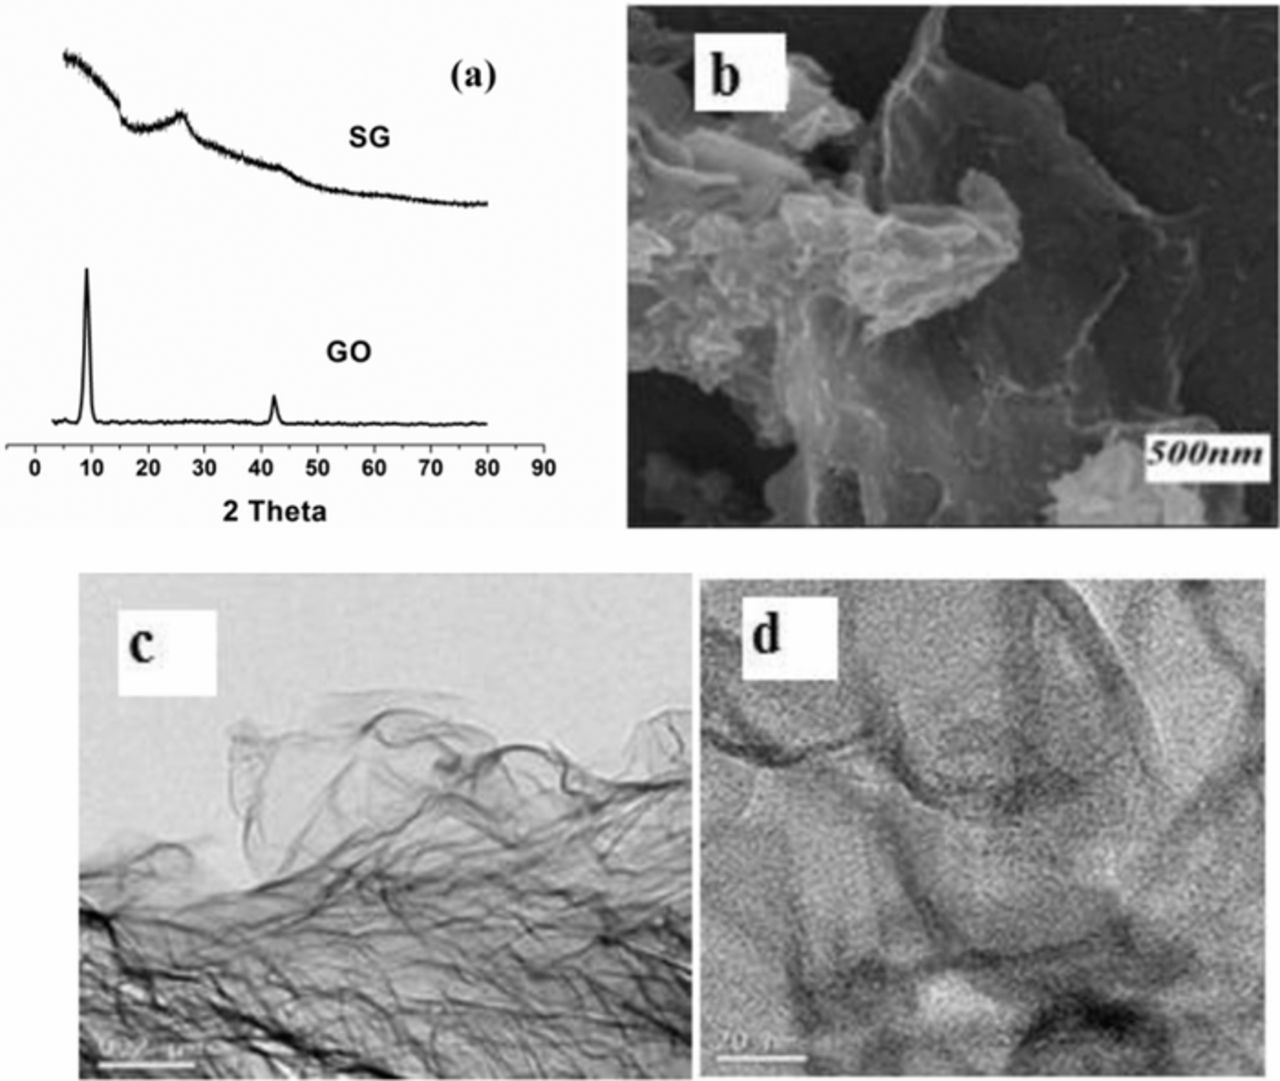
Figure 1. (a) XRD patterns of GO & sG, (b) FESEM image of sG, (c) and (d) TEM images of sG.
XRD spectrum of sG-Pd on ITO was shown in Fig. 2a, here nano palladium shows reflections due to (111), (200) and (220) at 2θ = 39.5, 47 and 67, respectively. The characteristic peak of palladium at (200) ratifies successful reduction of palladium metal complex to palladium.50The morphology of the as prepared sample was also characterized by AFM imaging (Fig. 2b), which shows that the depositions of palladium nanoparticles follow uniform nature and roughness of the surface is also visible. FESEM images (Figs. 2c and 2d) of sG-Pd reveals spherical shaped palladium nanoparticles are deposited on solar exfoliated reduced graphene oxide layers.
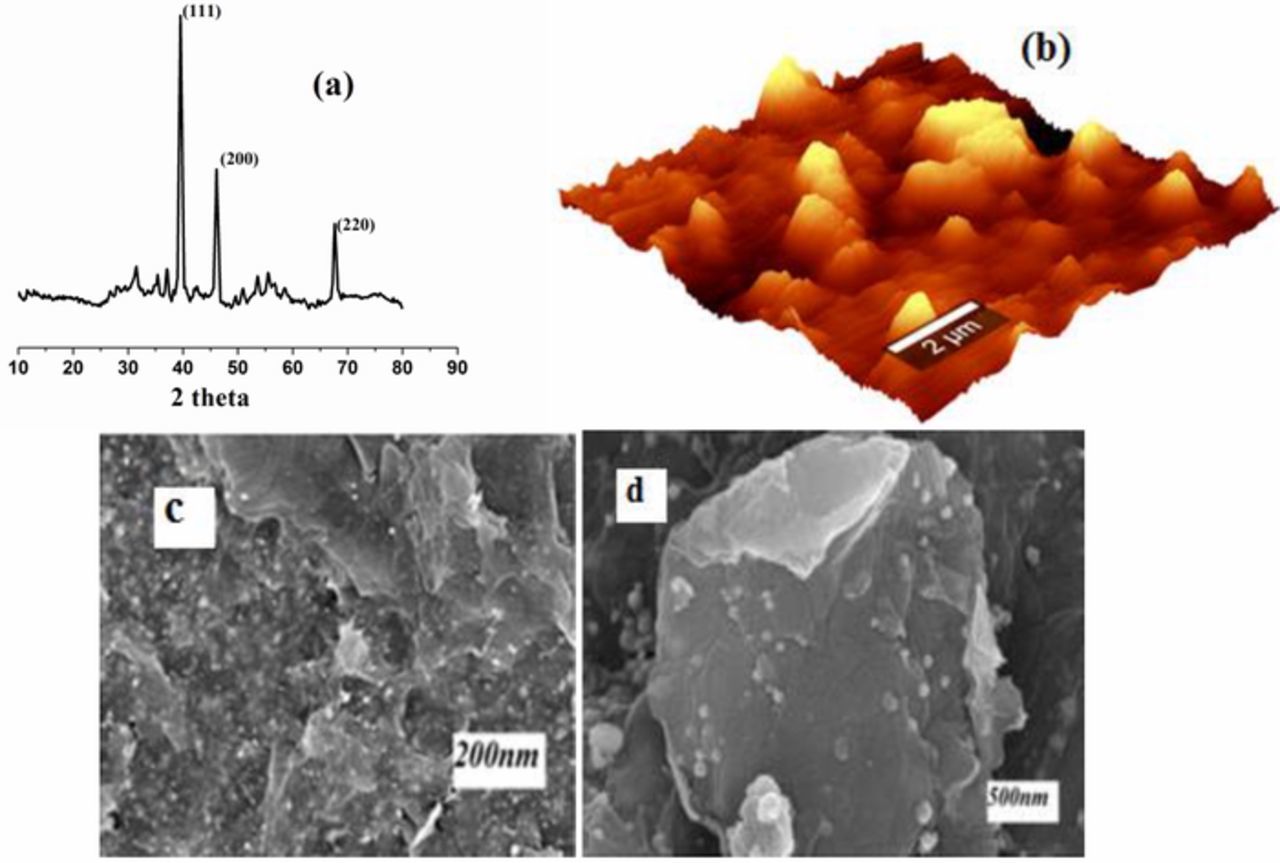
Figure 2. (a) XRD pattern of sG-Pd, (b) AFM topographic 3D image of sG-Pd, (c) and (d) FESEM images of sG-Pd.
Optimizing the quantity of sG cast on GCE
To optimize the quantity of sG on GCE surface the redox current of EP resulting from varying concentrations of sG suspension was recorded by drop drying different concentrations of graphene suspensions on GCE surface. Prior to use, the sG/GCE was rinsed with distilled water to remove loosely bound graphene on the electrode surface.48 Peak current of EP increased with increasing concentration up to 0.5 mg/mL and decreased thereafter. The decrease in redox current can be due to increase in thickness of the electrode surface leading to a reduced diffusion of substrate on to the electrode surface. Hence an optimized concentration of 0.5mg/mL was selected throughout.
Electrodeposition
Palladium nucleation on sG/GCE was carried out with repetitive potential scan between −0.6 and 1.4 V for seven cycles at a sweep rate of 50 mV/s. Fig. 3a represents the cyclic voltammogram of palladium nanoparticle deposition process. On scanning the potential in negative direction palladium particles are deposited on the electrode surface at a potential of −0.14 V.51 The electrolyte containing PdCl2 and NH4Cl at pH 3.4 contain [PdCl4]2− as the active palladium specie. The overall reaction for palladium deposition can be
Absence of a cathodic current at potentials greater than 0.28 V in the CV confirm that there is no under potential deposition and the deposition follow the Volmer-Weber growth mechanism.52,53 The onset of palladium deposition is indicated by a sharp increase in cathodic current below −0.15 V. The anodic peak at 0.55 V can be ascribed to the dissolution of deposited palladium.46
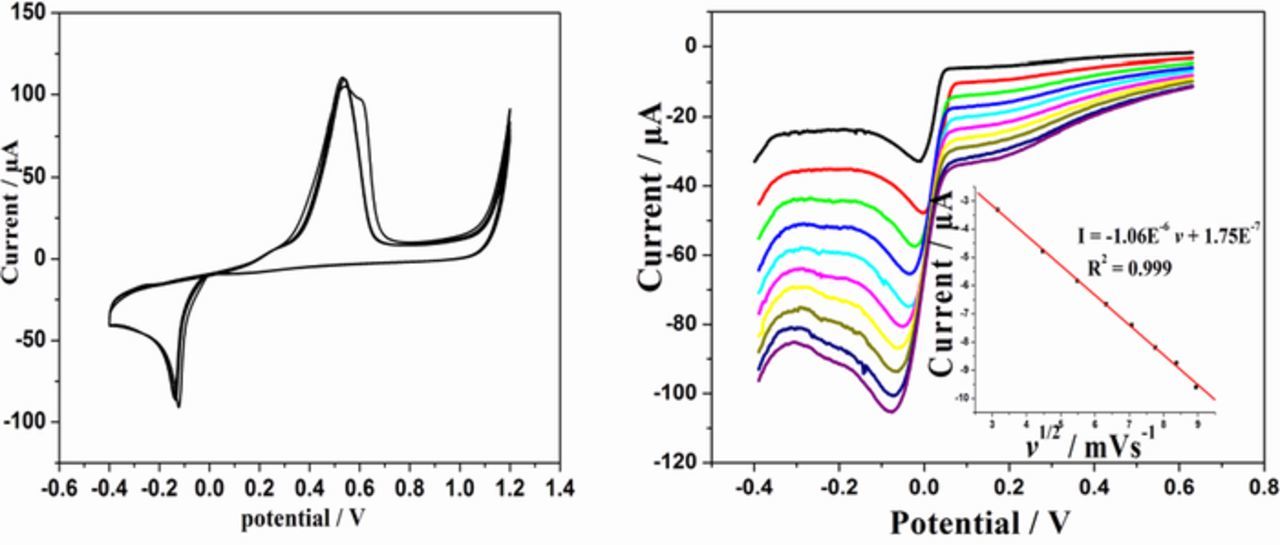
Figure 3. (a) CVs showing electrodeposition of Pd at sG/GCE in 1 m NH4Cl (pH 3.4); scan rate 50 mV/s, (b) Cathodic peak currents of electrochemical deposition at different scan rates. Inset: linear variation of Ip vs v1/2.
Fig. 3b depicts the voltammogram of cathodic current at different scan rate and the current density is linear with the square root of scan rate. This confirms that the reduction of palladium ions on graphene surface is a diffusion controlled process. Applying Randles- Sevick equation for irreversible electro deposition process54 the surface area was found to be 0.326 cm2 from the slope of the linear part of Ip vs v1/2 plot.
Cyclic voltammogram of the modified electrode recorded in phosphate buffer (pH 7) after electro deposition showed a characteristic peak of palladium at potential −0.14 V, confirming palladium deposition.
Optimizing palladium deposition on sG/GCE
Amount of palladium loaded on graphene surface and morphology control the electrochemical activity of the modified electrode. The influence on the peak current of EP on different loading of palladium on sG/GCE was investigated by varying number of CV scanning cycles during deposition. sG/GCE surface was scanned for 2 to 10 cycles. Maximum peak current was recorded for 7 cycles. From XRD data, the particle size of palladium was found to be 15.1 nm during seven cycles.
Electrochemical performance of sG-Pd/GCE
The electrochemical response of bare GCE (a), sG/GCE (b) and sG-Pd/GCE was analyzed by recording CV in ferrocyanide medium, 0.1M KCl being the supporting electrolyte. Among the three electrodes sG-Pd/GCE shows higher redox peak currents and lower potential (Fig. 4). To compare the effective surface area of the three electrodes the scan rates were varied from 10–100 mV/s and the corresponding peak current were recorded. Applying Randles-Sevick equation, surface area of the electrodes was calculated.55,56
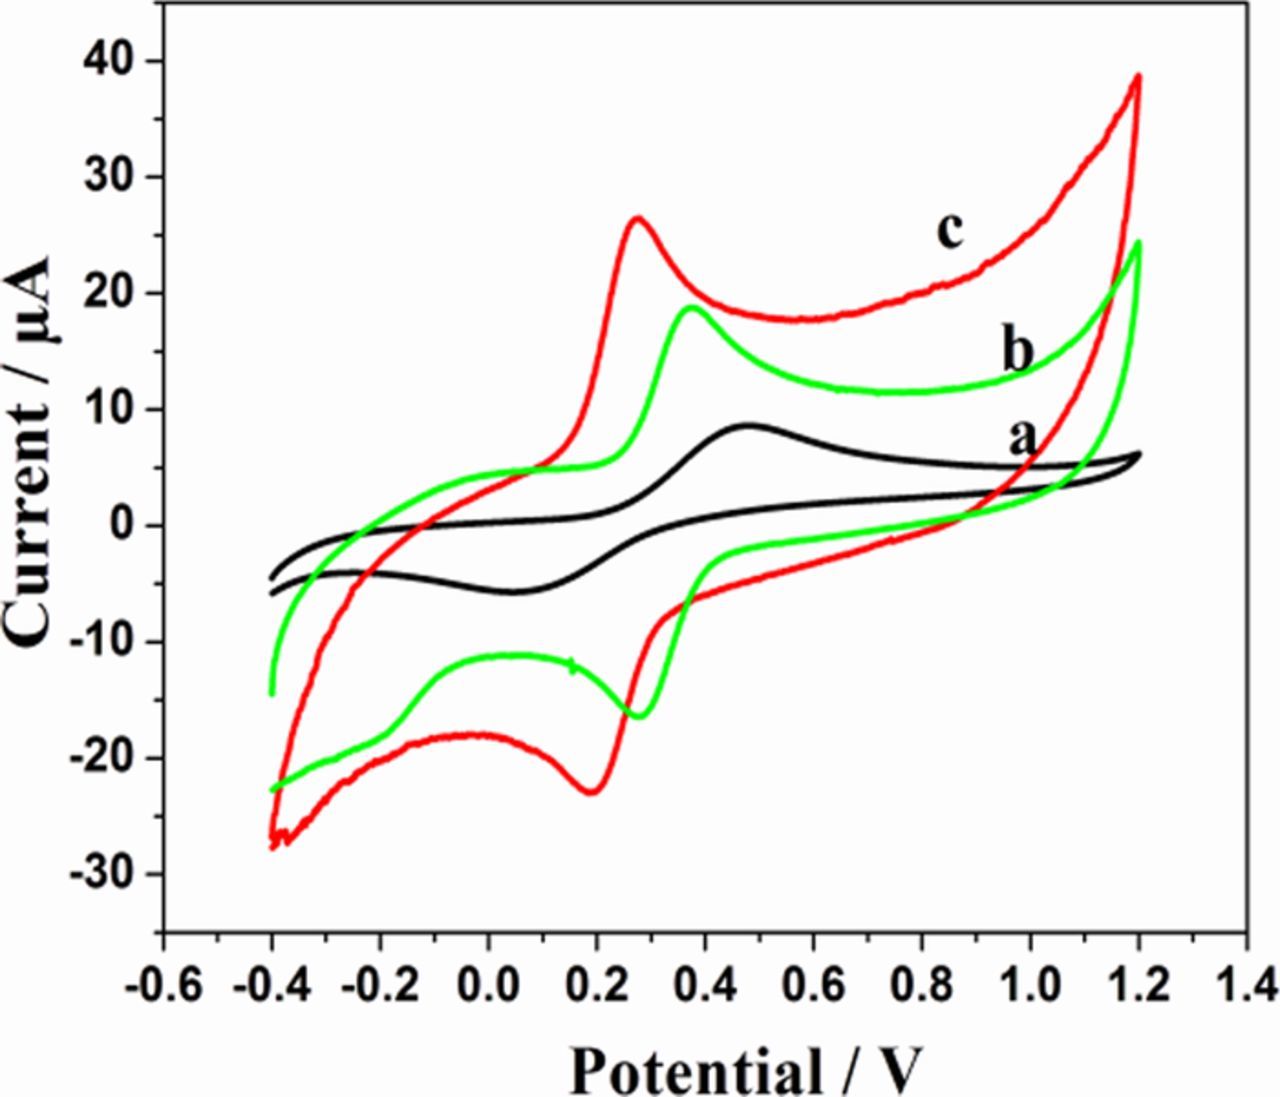
Figure 4. CVs of bare GCE (a), sG/GCE (b) and sG-Pd/GCE (c) in 0.1M KCl+1mM K3Fe(CN)6 at 0.05V/s.
Where Ip is the peak current density in A cm−2, n is the number of electrons involved (n = 1), where D is the diffusion coefficient in cm2 s−1, A (cm2) is the surface area of the electrode, C0 is the concentration of K3[Fe(CN)6] in mol cm−3 and v (V s−1) is the scan rate. The surface area of the electrodes was obtained from the slope of Ip - v1/2 plot (n = 1 and D = 7.6 × 10⁻⁶ cm2/s).57 The electrochemically active surface areas were calculated as 0.048, 0.139 and 0.324cm2 for bare GCE, sG/GCE and sG-Pd/GCE, respectively. The enhanced surface area for sG/GCE electrode is higher than that of reported graphene modified electrodes justifying the advantage of solar exfoliated graphene.55,56 Furthermore, presence of palladium nanoparticles doubled the effective surface area, establishing excellent performance of the composite toward electrode modification.
Electrochemical impedance spectroscopy (EIS) is an effective tool to investigate the characteristics of modified electrode-electrolyte interface. The electrical conductivity of the bare GCE, sG/GCE and sG-Pd/GCE were studied by EIS in 1mM K3Fe(CN)6 solution. Fig. 5 shows the Nyquist plots recorded for bare and modified electrodes. The proposed equivalent circuit of the EIS data is also shown in the inset. In the circuit, Rs, Rct, W and Cdl are the solution resistance, electron transfer resistance, Warburg element and double layer capacitance, respectively. The electron transfer resistance (Rct) can be directly measured from the semicircle diameter. Rct of the bare GCE was estimated to be 559.4Ω and that of sG/GCE and sG-Pd/GCE was 131Ω and 34.52Ω respectively. The decrease from 559.4Ω to 131Ω indicate that sG/GCE played a significant role in enhancing the active surface area of the electrode than the bare. There was a considerable decrease in Rct value for sG-Pd/GCE, which indicates that palladium incorporation on graphene accelerates the electron transfer process between modified electrode and [Fe(CN)6]3−/4−. This behavior shows the successful incorporation of Pd nanoparticles on the surface of solar graphene.50 All these facts illustrates the prepared modified electrode possess excellent electron transfer rate, greater effective surface area, low charge transfer resistance suitable for a perfect sensor.
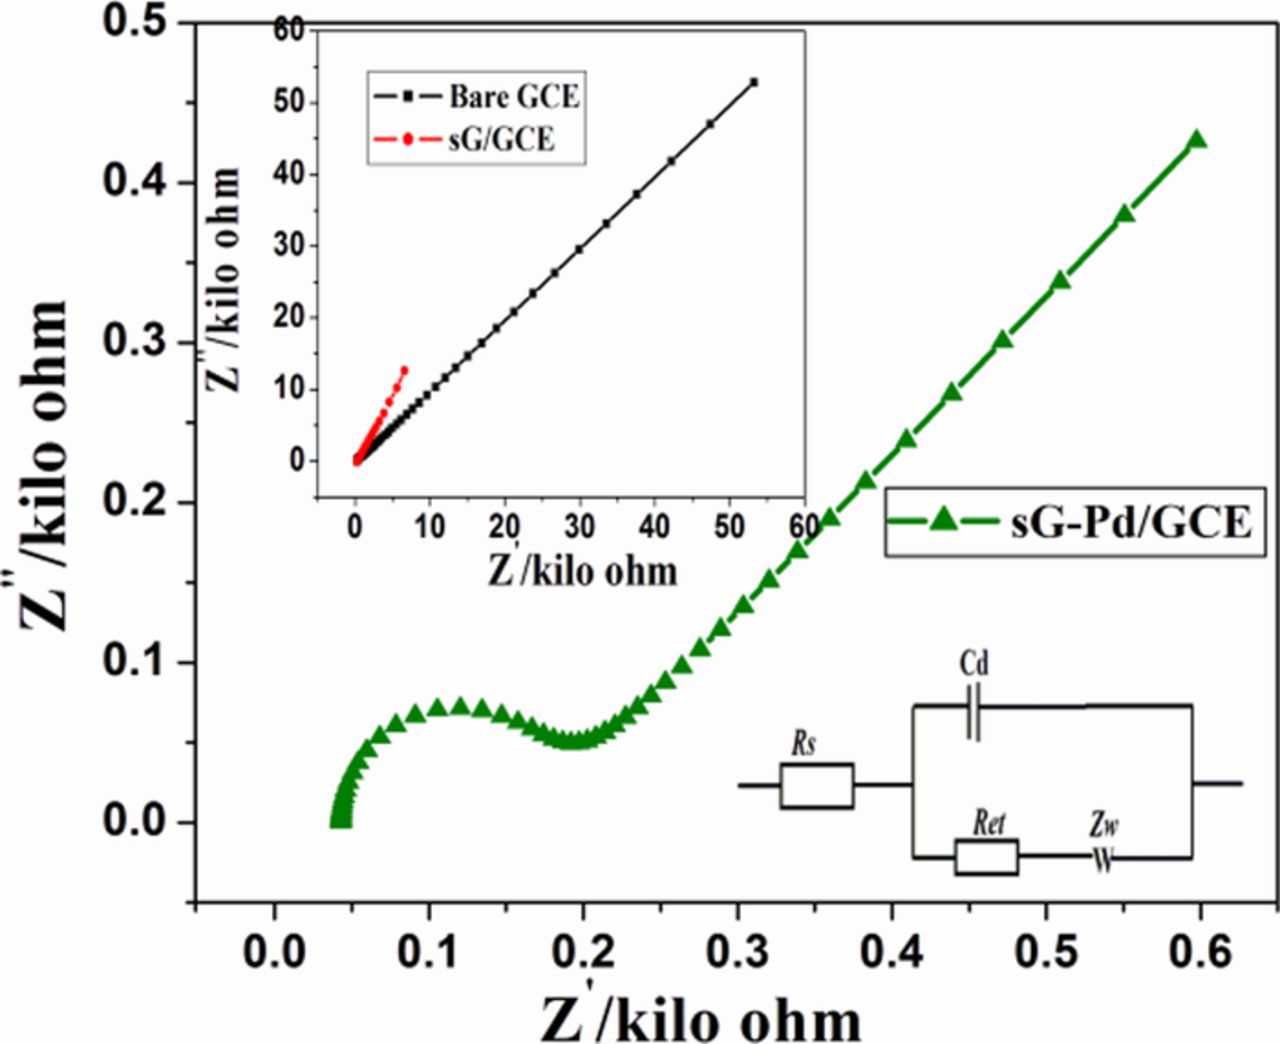
Figure 5. EIS spectra of sG-Pd/GCE Inset: EIS of bare GCE and sG/GCE in 0.1M KCl+1mM K3Fe(CN)6.
Electrochemical behavior of EP
The electrochemical evaluation of the modified electrode shows properties suitable for electrochemical detection of the analyte molecule epinephrine. To assess this behavior, voltammetric studies were carried out. Fig. 6 shows the cyclic voltammograms of electrooxidation of EP at bare GCE, sG/GCE and sG-Pd/ GCE in 0.1 M phosphate buffer (pH 7) at a sweep rate of 50 mV/s. At bare GCE, a broader anodic oxidation peak at 0.413V was observed. In sG/GCE an oxidation peak at 213 mV was observed with appreciable enhancement in peak current. The lowering in potential by 200 mV can be ascribed to the presence of out of plane π orbitals at graphene layer in enabling higher polarizability of the surface aiding the oxidation process.58 Further lowering of peak potential was observed in sG-Pd/GCE giving an oxidation peak at 0.195V with increase in current density, attributing to the fact that palladium deposition on graphene strongly enhances electrochemically active surface area of the electrode accelerating electron transfer.59
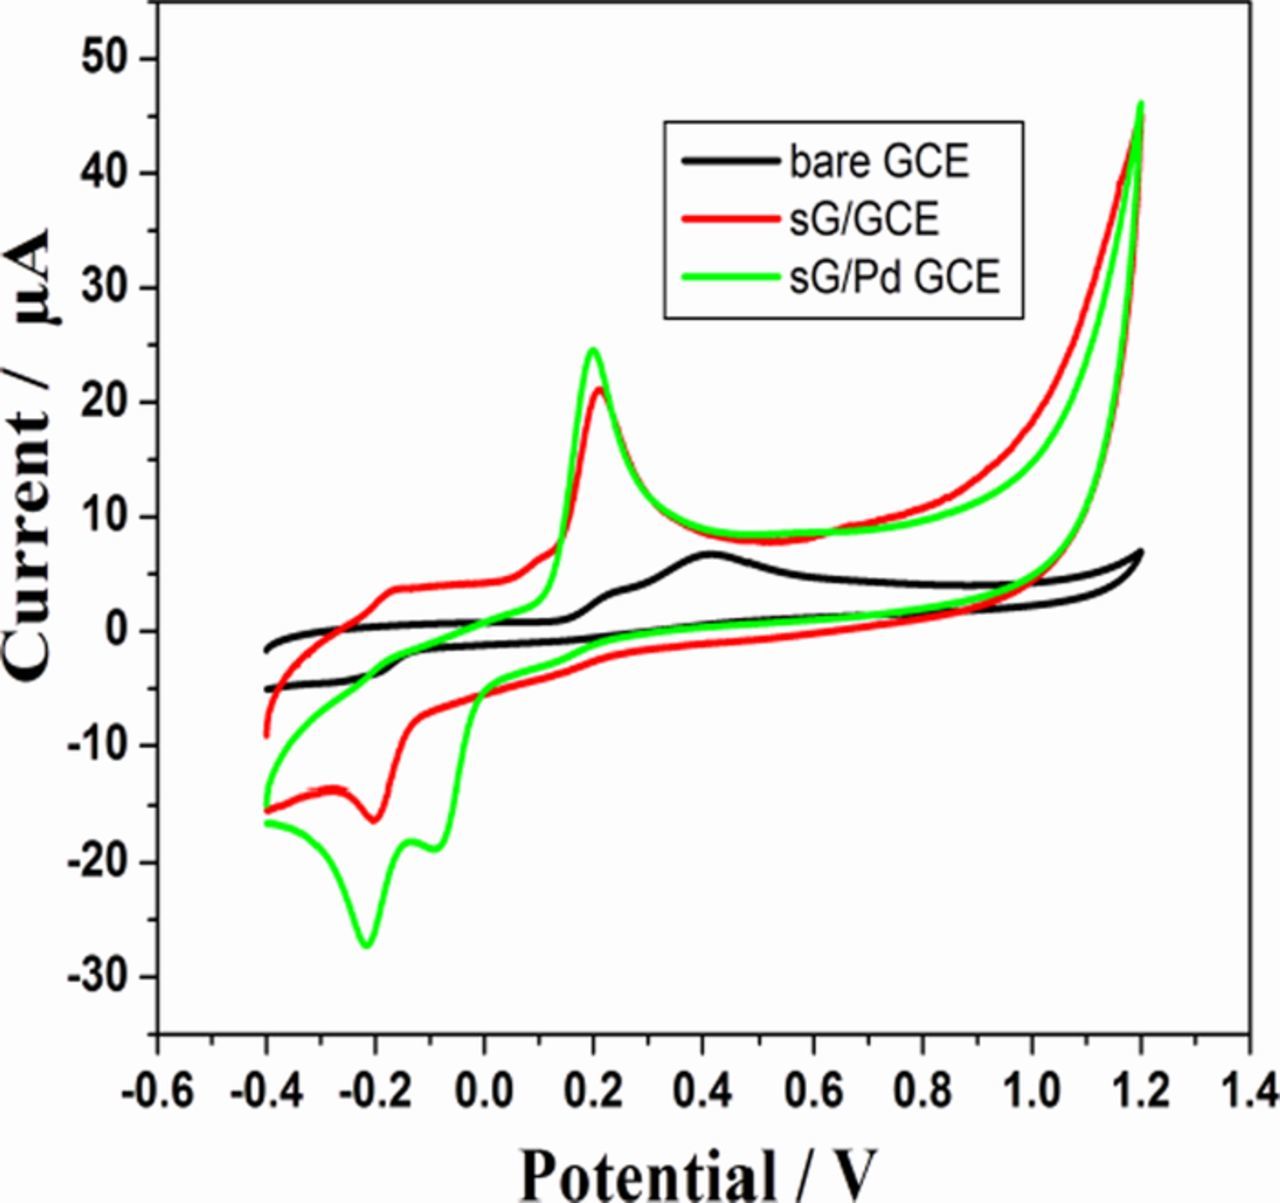
Figure 6. CVs of 0.2Mm EP in 0.1M PBS (pH 7) at bare GCE, sG/ GCE and sG-Pd/ GCE, sweep rate 50mVs1.
Chronoamperometry
The activity of the modified electrode towards the oxidation of EP was also checked using chronoamperometry (Fig. 7). The catalytic rate constant (kcat) was evaluated by the method described by Galus:60
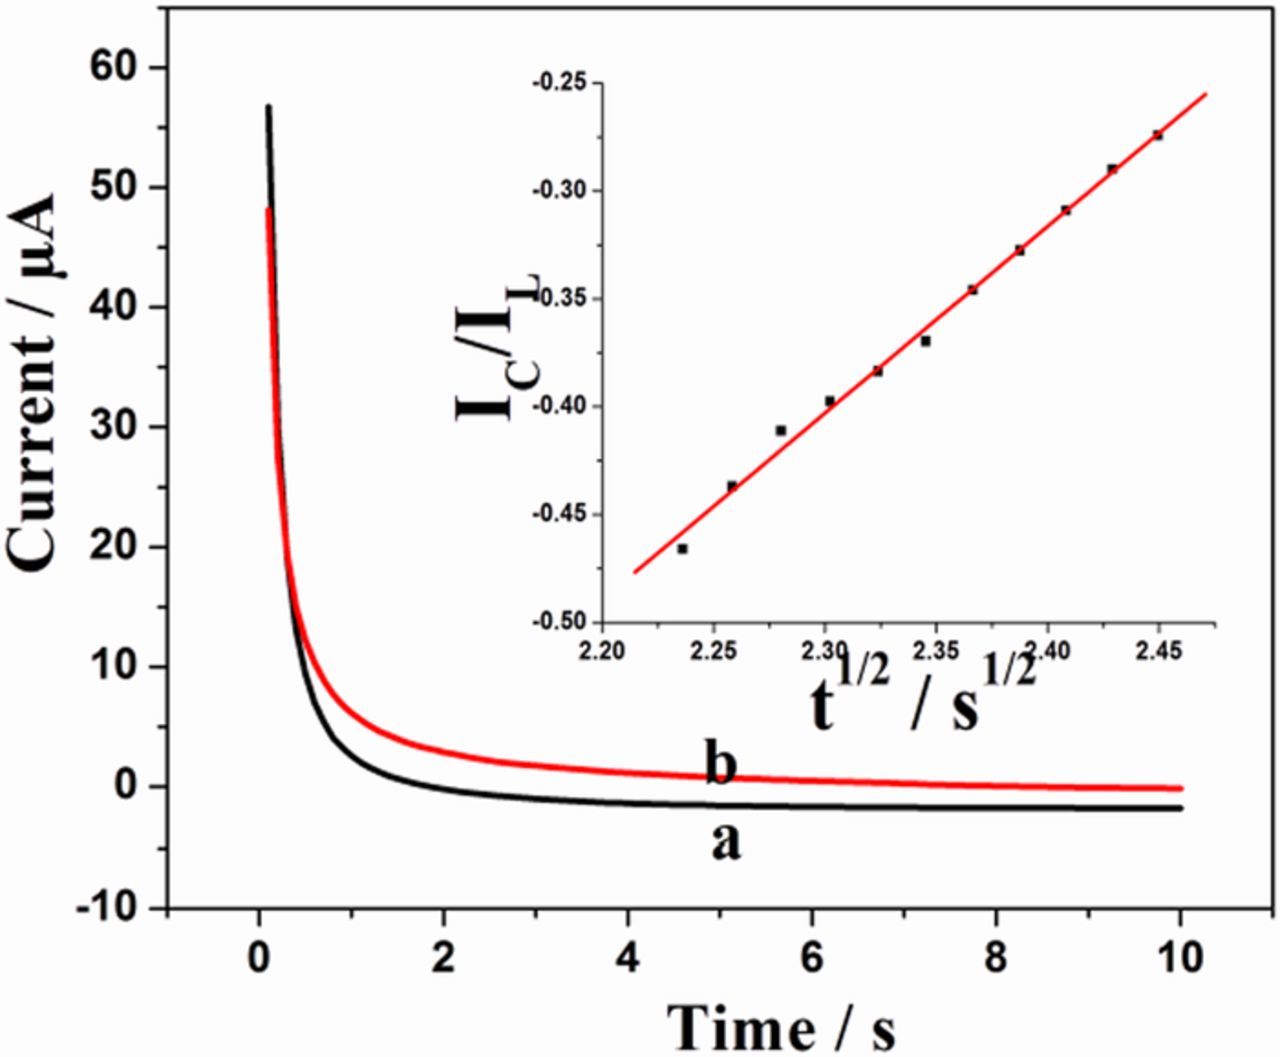
Figure 7. Chronoamperometry of sG-Pd/GCE (a)without analyte (b) with 0.1mM EP in 0.1M PBS (pH7). Inset: Plot of IC/IL versus t1/2.
Where IC is the catalytic current of sG/Pd GCE in presence of EP, IL is the limiting current in the absence of EP and γ = kcat C0 t is the argument error function. In the case where γ exceeds 2, the error function is almost equal to 1.0 and the above equation can be reduced to:
Where C0 denotes analyte concentration, kcat and t are the catalytic rate constant and time elapsed respectively. After measuring the catalytic current IC, the chronoamperometric procedure was repeated under identical conditions, in the absence of EP, in order to determine IL. From the slope of IC/IL vs t1/2 plot, the value of kcat can be calculated for a given concentration of the substrate. The linear plots are in agreement with the above equation. The value of kcat was found to be 2.39 × 10³ M−1s−1 for 0.1mM EP showing the catalytic activity of the modified electrode.61
Electrochemical response of mixture of AA, EP and UA at bare GCE and modified electrodes
Both AA and UA often coexist with EP in physiological fluids and the concentration of AA is much higher than that of EP and UA.62 Therefore, their simultaneous determination had become relevant. Figure 8 illustrates the cyclic voltammograms of 1mM AA, 0.1mM EP and 0.1mM UA recorded at bare GCE, sG/GCE and sG-Pd/GCE in 0.1 M PBS at pH 7. A single broad peak was shown by bare GCE. As AA, EP and UA oxidize at almost same potential and such peaks are inconvenient for any investigation. In sG/GCE distinct peaks for EP and UA are visible at 0.25V and 0.49V. Peak current corresponding to these peaks were 47.21 μA and 30.01 μA, respectively. Whereas, in sG-Pd/GCE the three peaks corresponding to AA, EP and UA appeared at a potential of 0.14, 0.21 and 0.45 V, respectively. The current density increased from 47.21 μA to 80.16 μA for EP and the peak current corresponding to UA increased from 30.01 μA to 51.14 μA after palladium deposition. The peak current corresponding to AA was 39.67 μA. The charge transfer resistance offered by bare electrode is more whereas, that of sG-Pd/GCE is least. When analytes are added to an electrode with such a rough and porous surface, the peak current of these molecules get enhanced and the peaks are well separated. The peak separation obtained for AA-EP, EP-UA and AA-UA was 70 mV, 240 mV and 310 mV, respectively. These facts illustrate the performance of modified electrode sG-Pd/GCE to provide clear separation peaks for AA, EP and UA from a mixture. The performance of sG-Pd/GCE toward simultaneous determination was further investigated by varying parameters such as pH, scan rate and concentration.
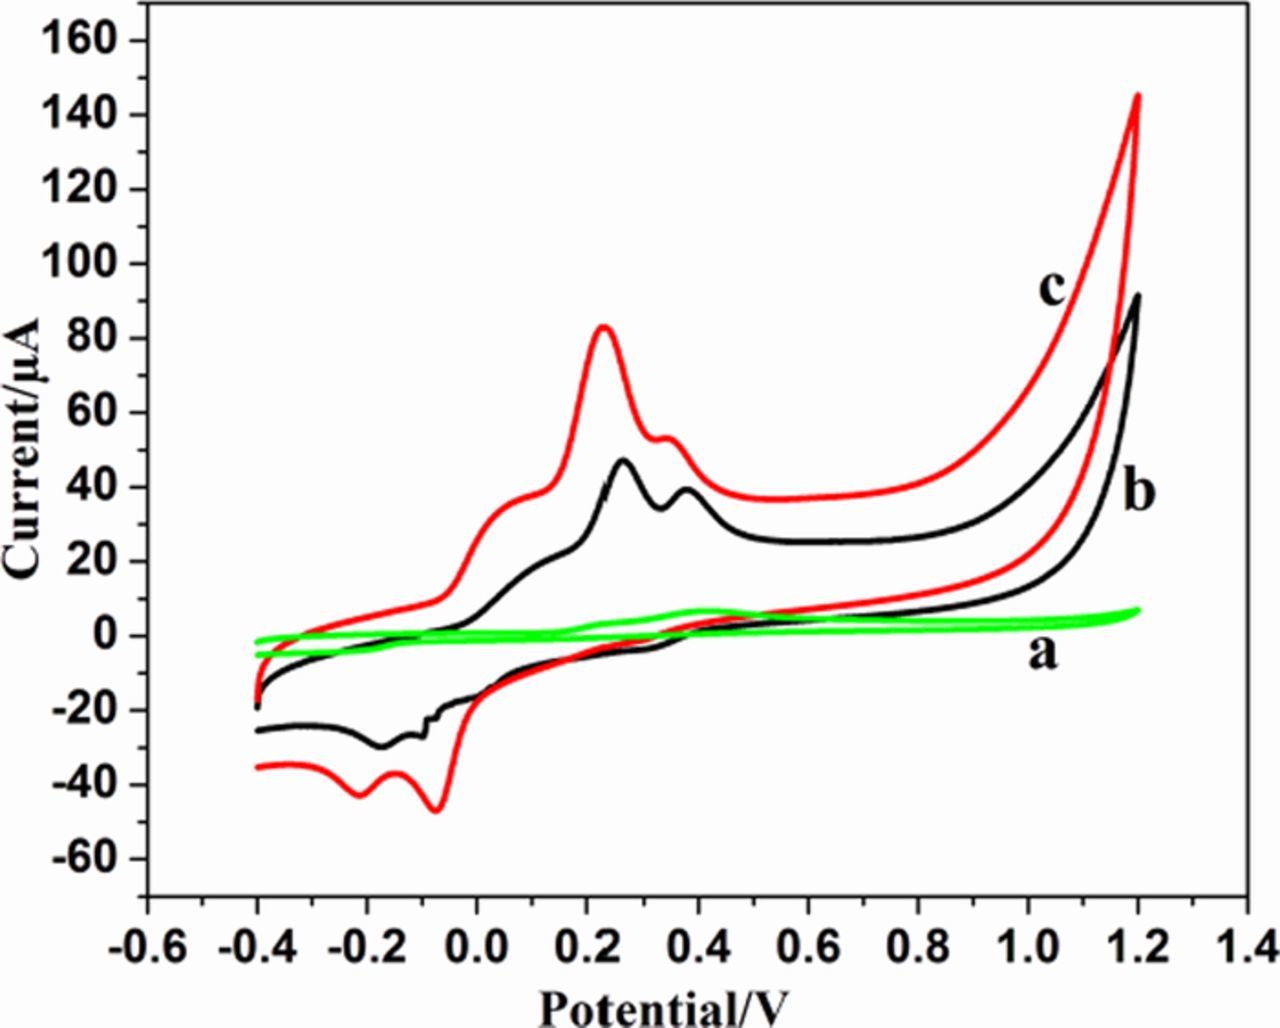
Figure 8. CVs of 1Mm AA, 0.1Mm EP and 0.1MmUA in 0.1M PBS at (a) bare GCE (b) sG/GCE and (c) sG-Pd /GCE.(pH 7) at 50mVs1.
Influence of pH on the oxidation of AA, EP and UA
The response of sG-Pd/GCE (Fig. 9) with variation in pH was evaluated in the range 3 to 8. The peak current associated with EP and UA increases from pH 3 and maximum current obtained at pH 7 and then decreases. The peak potential moves to more negative values with increase in pH indicating the participation of protons in their electrode reactions and negative slopes showed that the deprotonation was involved in the oxidation, which was facilitated at higher pH values. The linear regression equations are given by
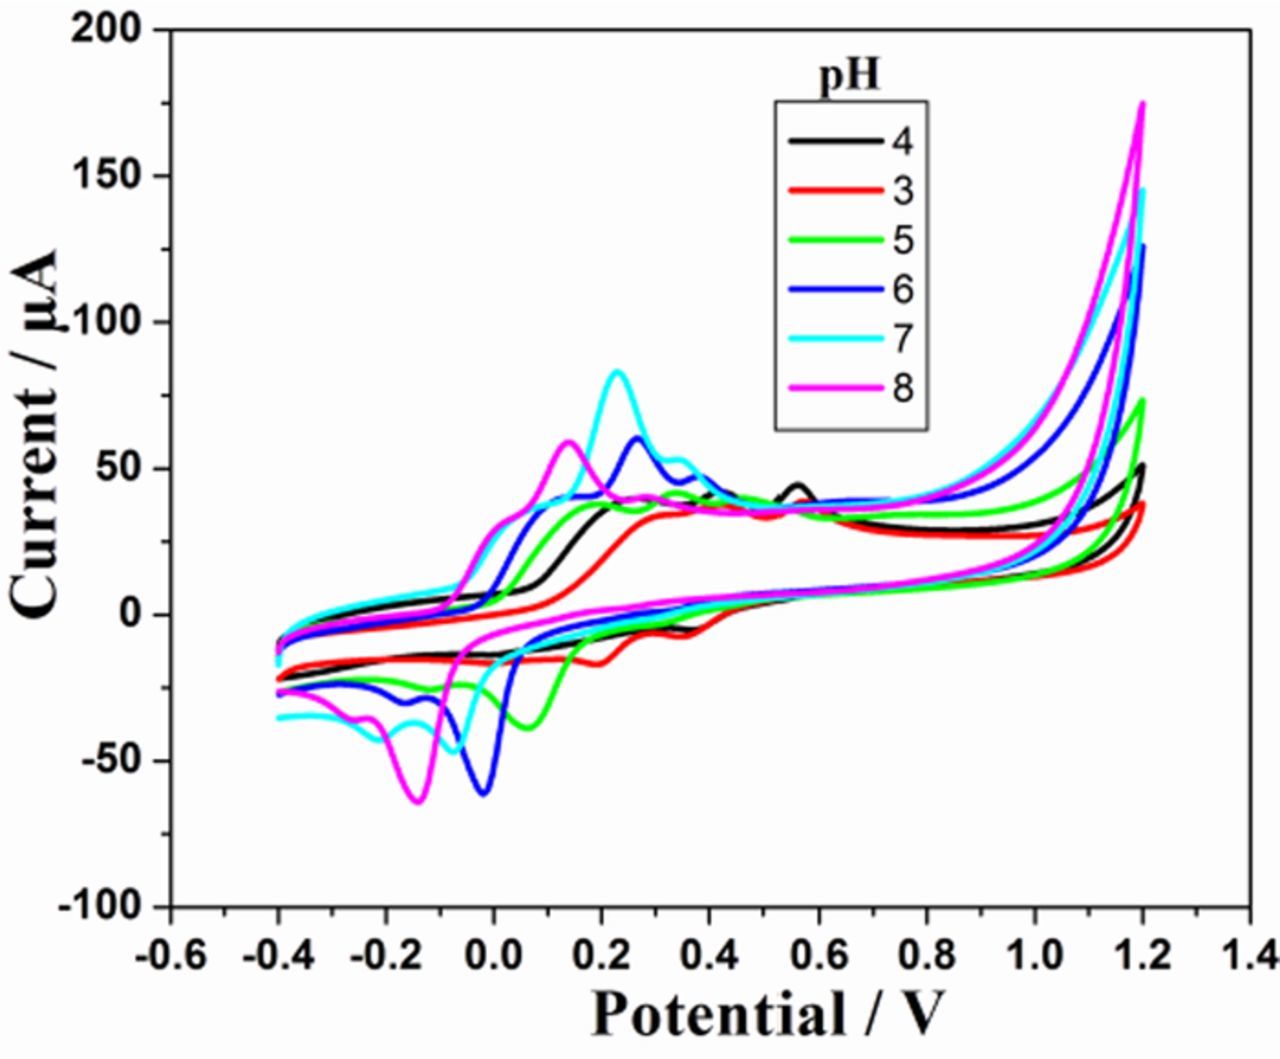
Figure 9. Voltammograms of mixture of 1mM AA, 0.1 mM EP and 0.1 mM UA at sG-Pd/GCE in 0.1M PBS from pH 3 to 8 at scan rate 50mVs1.
The slopes 60.3 mV and 56 mV indicate equal number of electrons and protons have taken part in the electrode reaction.63 But the influence of solution pH on the peak current of AA showed a different mode. Here the peak current increases first and then seems to be decreasing. The oxidation peak potentials shifted to less positive potentials with increasing solution pH with a slope of 46 mV indicating 1:1 proton – electron transfer.31 The linear regression equation is given by

Considering the above aspects pH 7 was optimized for simultaneous determination.
Role of scan rate
Electrochemical behavior of mixture of AA (1mM), EP (0.1mM) and UA (0.1mM) in 0.1 M phosphate buffer solution at sG-Pd/GCE was studied by varying the scan rates between 10--1000 mVs−1 (Fig. 10).
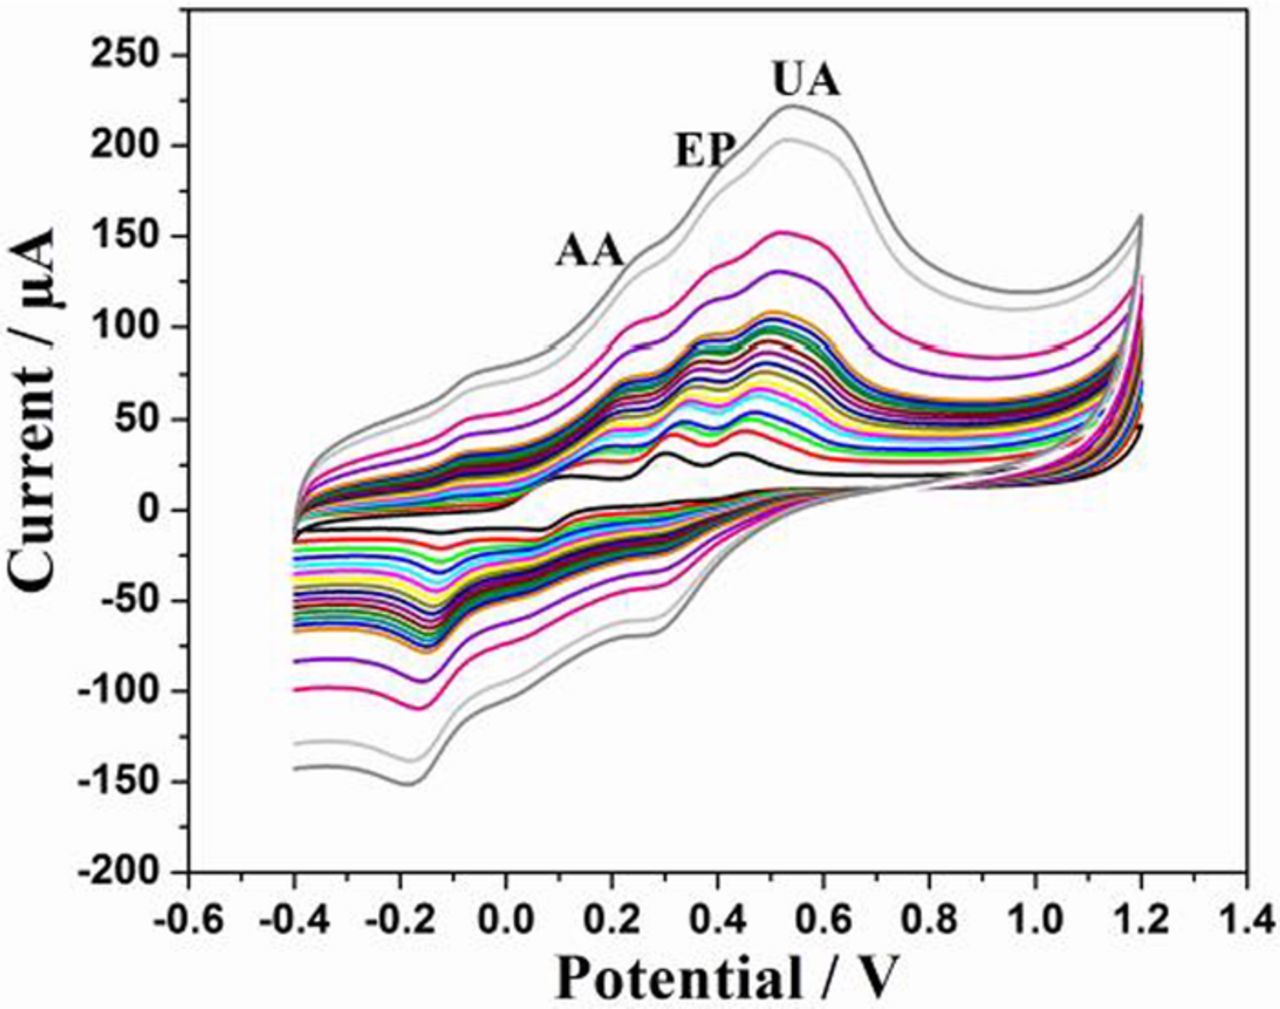
Figure 10. CVs of mixture of AA, EP and UA at sG-Pd/GCE in 0.1M PBS (pH7) at various scan rate from 10–400mVs−1.
The peak current increases with increasing scan rate. There was a good linear relationship between peak current and scan rate of the three in both low and high scan range indicating surface confined process.64 A linear correlation was obtained between peak potentials (Ep) and logarithm of scan rates. The electron transfer coefficients (α) obtained from the slopes were 0.69, 0.59 and 0.49 for AA, EP and UA respectively. The value is lie between 0.3 and 0.7 in most systems, and it is usually taken as 0.5,65 so the number of electrons (n) involved in the reaction is estimated to be 2.
Determination of AA, EP and UA using DPV
DPV being much current sensitive, fast and sensitive detection can be achieved through this technique. Therefore, DPV was recorded at bare GCE, sG/GCE and sG-Pd/GCE in a solution mixture containing 1mM AA, 5μM EP and 50 μM UA in 0.1 M PBS of pH 7 at a scan rate of 50 mV/s (Fig. 11). Figure 11A clearly shows, three well defined peaks corresponding to AA, EP and UA at −0.05, 0.161 and 0.289 V, respectively at sG-Pd/GCE with increased peak separations. The DPV produced by sG/GCE at the same concentration (Fig. 11B) shows peaks for AA and UA only, whereas, EP is not detected at all. sG-Pd/GCE can produce resolutions of these three molecules at concentrations even lower than this.
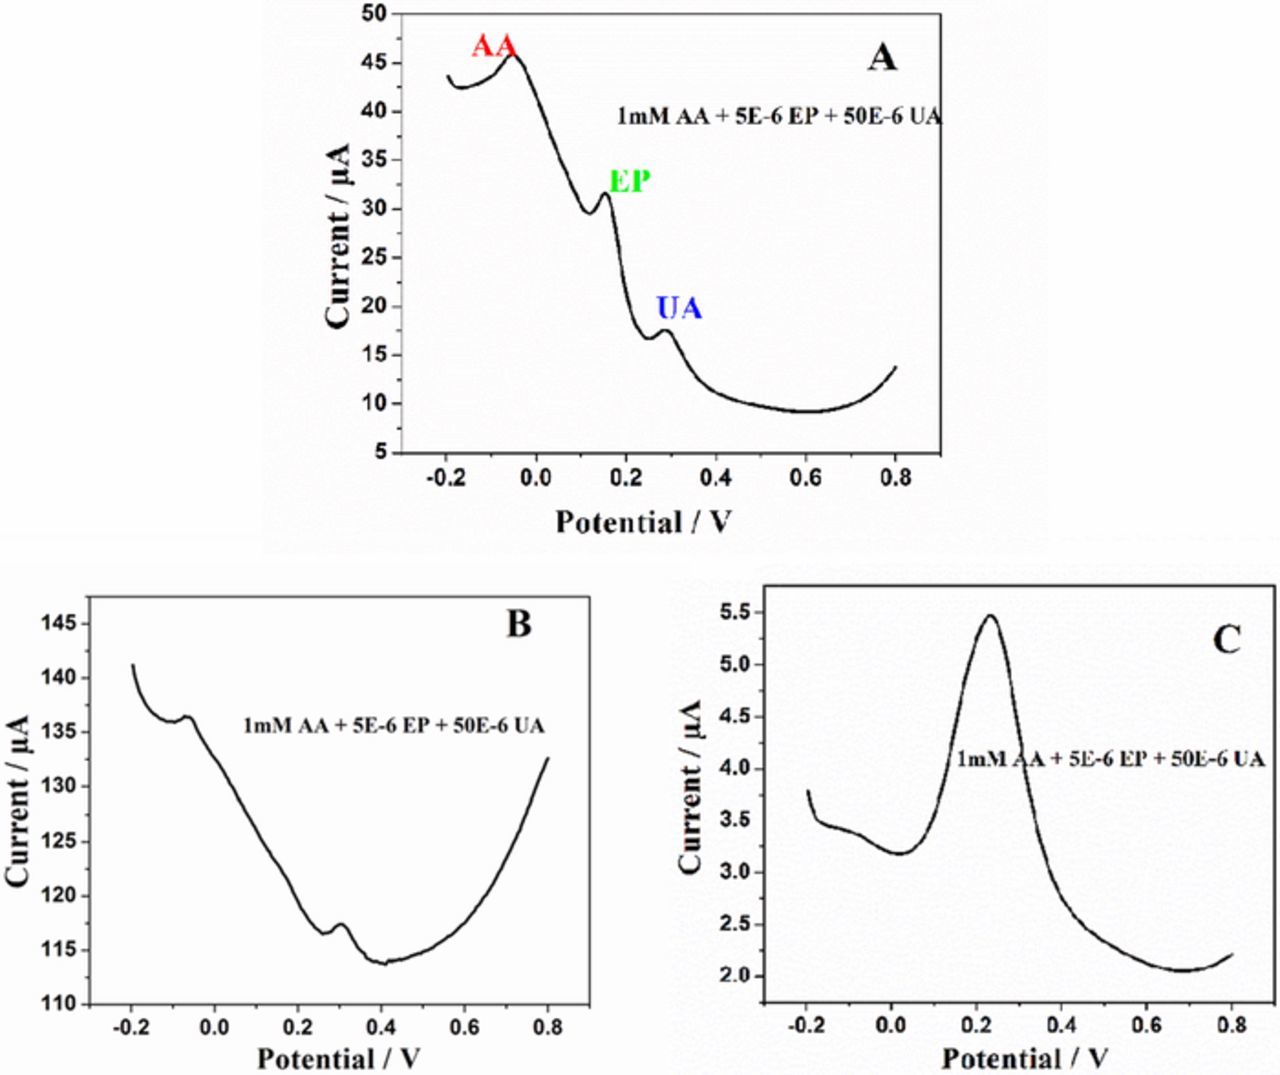
Figure 11. DPVs of (A) sG-Pd/GCE, (B) sG/GCE (C) bare GCE in 1mM AA, 5μM EP and 50μM UA in 0.1M PBS (pH 7) at a scan rate of 50mVs1.
Figure 12A shows DPVs for EP, UA and AA by varying the concentrations of EP from 2μM to 50 μM, UA from 10μM to 100 μM and AA from 0.3mM to 1.3mM in 0.1 M PBS of pH 7 at 50 mV/s. Well resolved anodic peaks corresponding to the oxidation of AA, EP and UA were observed. The peak currents of AA, EP and UA increased linearly with increase in concentration. Figs. 12B, 12C and 12D depict the calibration curve, concentration vs. peak current satisfying the following linear regression equation.
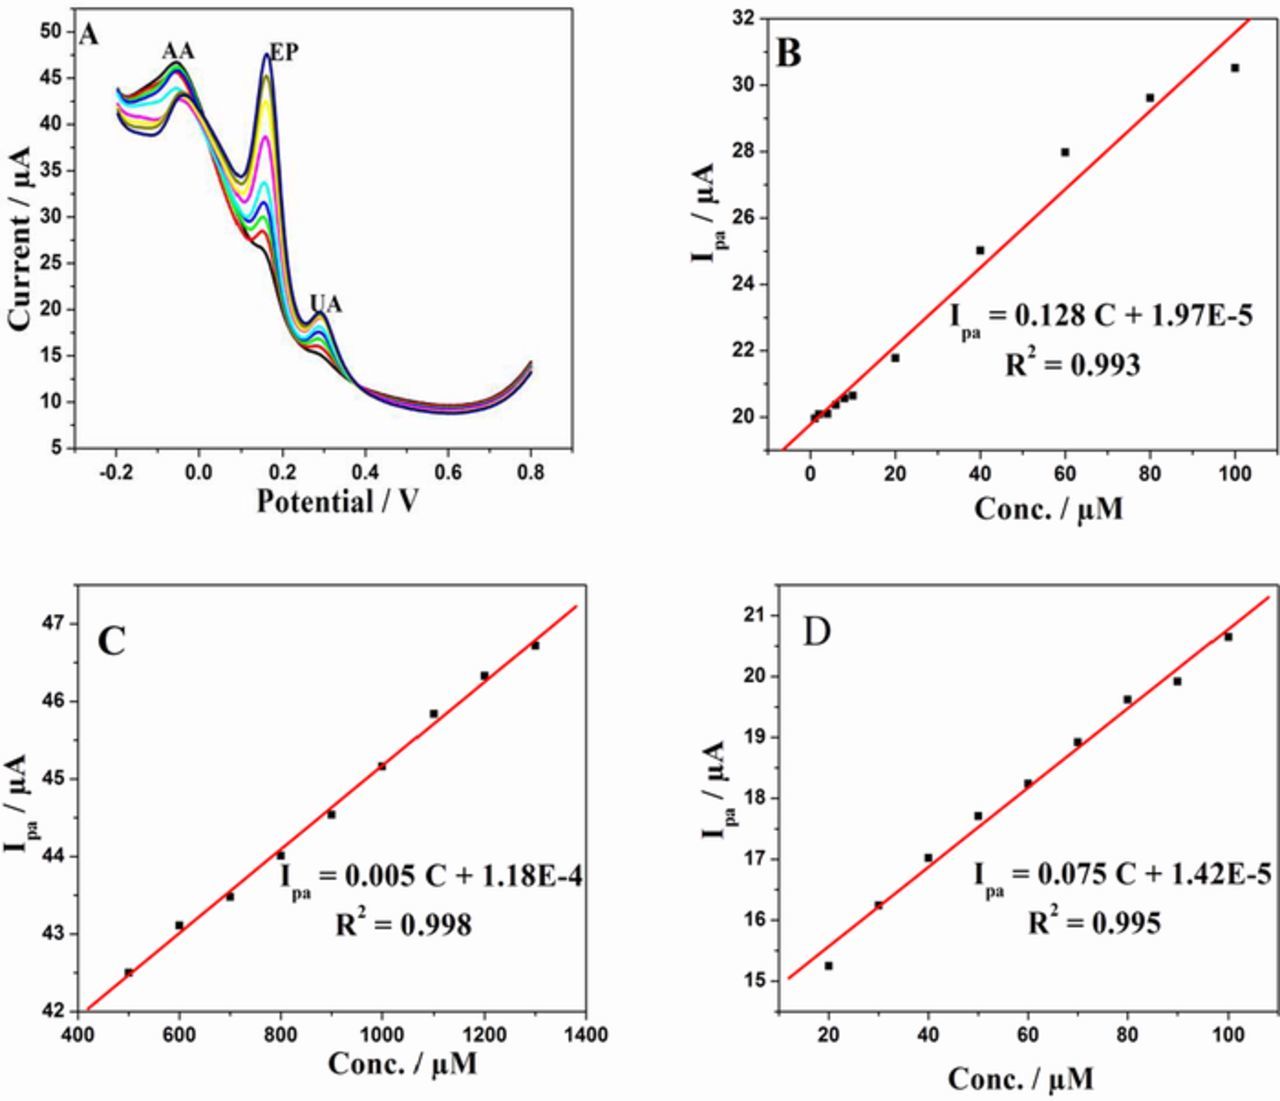
Figure 12. (A) DPV curves of varying concentrations of AA, EP and UA in 0.1M PBS (pH 7) at 50 mVs−1 scan rate. The concentration varied for AA (0.3mM to 1.3mM), EP (2μM to 50 μM) and UA (10μM to 100 μM). (B), (C) and (D) are the calibration plots of EP, AA and UA respectively.
The limit of detection of EP, AA and UA was found to be 100 nM, 22 μM and 170 nM, respectively. The comparison of this method with other reported electrochemical methods are given in Table It2.
Table I. Comparison of analytical parameters for the detection of EP, AA and UA at sG-Pd/GCE with other modified electrodes.
| Material | Technique | Analyte | Linear Range (μM) | LOD (μM) | Reference |
|---|---|---|---|---|---|
| Cu(II) nanocomplex | DPV | 10.0–600.0 | 2.5 | 70 | |
| Nanoporous Au film | DPV | 20.0–190.0 | 2.43 | 71 | |
| Poly(ionic liquids) and polypyrrole nanotubes supported gold nanoparticles | DPV | EP | 35.0–960.0 | 0.298 | 72 |
| Magnetic silica/titania Xerogel | DPV | 40.0–530.0 | 2.94 | 15 | |
| Reduced Graphene Oxide with Poly(eriochrome black T) | DPV | 0.8–70.0 | 0.4 | 29 | |
| sG/Pd/GCE | DPV | 2.0–50.0 | 0.1 | Present Work | |
| Graphene flowers/carbon fiber electrode | DPV | AA | 45.4–1489.23 | 73.52 | 73 |
| UA | 3.78–183.87 | 3.98 | |||
| Pd nanoparticle/Graphene/Chitosan GCE | DPV | AA | 100–4000 | 20 | 74 |
| UA | 0.5–200 | 0.17 | |||
| Nickel hydroxide/solar graphene/GCE | DPV | AA | 150–300 | 30 | 31 |
| UA | 2–15 | 0.46 | |||
| Electrochemically activated carbon paste electrode | DPV | AA | 400–1000 | 6.0 | 75 |
| UA | 6–90 | 0.1 | |||
| sG/Pd/GCE | DPV | AA | 300–1300 | 22 | Present Work |
| UA | 10–100 | 0.17 |
Table II. Determination of EP, UA and AA in human blood serum sample.
| EP added (μM) | Found (μM) | Recovery (%) | UA Added (μM) | Found (μM) | Recovery (%) | AA Added (μM) | Found (μM) | Recovery (%) |
|---|---|---|---|---|---|---|---|---|
| 2 | 2.05 | 102.5 | 20 | 20.1 | 100.5 | 500 | 498 | 99.6 |
| 4 | 4.25 | 106.6 | 30 | 28.9 | 96.33 | 600 | 630 | 105 |
| 6 | 6 | 100 | 40 | 39.6 | 99 | 700 | 690 | 98.6 |
| 8 | 7.8 | 97.5 | 50 | 50.8 | 102.6 | 800 | 800 | 100 |
As EP was positively charged under neutral condition, the attraction force between EP (pKa = 8.88) and negatively charged graphene surface facilitated the oxidation process than the other two molecules whose pKa values are 4.1(AA) and 5.4(UA) respectively66 and their peak intensities are lower compared to EP. The large shift in peak potential may be due to changes in the pH of the solution brought about by the addition of excess of the acidic substance AA as already reported.60,67 Moreover the synergistic effect of graphene and Pd nanoparticle31 and large surface area of palladium nanoparticles can enhance the performance in the oxidation process of AA, EP and UA by reducing the charge transfer resistance, thus improved its reversibility to greatly improve the peak currents. During the positive scan the palladium surface becomes oxidized to PdO and the species get chemisorbed on the oxidized sites, followed by electron transfer with the formation of a reduced palladium sites during cathodic scan and subsequent release of the oxidation products occur.68 The states of palladium can change rapidly between oxidized and reduced form there by adherence of oxidized AA or UA on the electrode surface can be avoided enabling simultaneous determination.69
Stability and reproducibility of the modified electrode
The reproducibility of the modified electrode was evaluated by observing the response of the modified electrode in 100μM EP at pH 7 in phosphate buffer. The experiments were repeated at time intervals of one, three and six days with the same electrode giving reproducible results with an RSD of 2.4%.
The repeatability of the modified electrode toward determination of EP was checked for successive measurements with the same modified electrode. The results were in very good agreement for ten successive cycles with RSD of 2%, establishing the reliability of the sensor.
Application of sG-Pd/GCE in real sample analysis
Determination of EP in injections
The practicality of the modified sensor was evaluated in commercially available adrenaline bitartarate injection solution without any further pretreatments. DPVs of different concentrations of standard solutions of EP were recorded and known amount of EP injection samples were added to phosphate buffer at pH 7. DPVs were recorded and recovery ratios on the basis of this method were examined. The average recoveries obtained were in the range 97.5% to 103.3%.
Analysis of EP, UA and AA in human blood serum and urine
To establish the practicability of the proposed sensor in biological fluids; it was used in the determination of EP, UA and AA in human blood serum and urine. 500 μL serum sample was diluted to 10mL with PBS (0.1M, pH7). DPVs were recorded after each addition of the standard solution. The sensor gives recoveries in the range 97 to 106% (Table II), suggesting accuracy in the analysis of biological fluids. Good recoveries were obtained for urine samples also and the peak of UA was observed in diluted urine sample without its standard addition.
Conclusions
The electrochemical response of EP, AA and UA toward a palladium supported graphene modified electrode was investigated systematically by CV, DPV and chronoamperometry. The sensitivity toward analytes was considerably enhanced due to interfacing of solar exfoliated reduced graphene oxide and palladium. Palladium incorporation resulted in improved electrochemical performance in terms of its surface area. This is in agreement with the FESEM, AFM results illustrating greatly enhanced roughness of the surface. The influence of pH on the oxidation behavior shows that the current increases to a maximum at physiological pH 7, simultaneously moving the potential to more negative values. Chronoamperometric studies reveal a high catalytic rate constant 2.39 × 10³ M−1s−1. The sensor can be effectively used in real systems such as human blood serum and urine.
ORCID
Anitha Kumary V. 0000-0001-5829-7933