Abstract
Transition metal dissolution is one of the major causes of capacity and power fade in lithium-ion batteries employing transition metal oxides in the positive electrode. Accelerated testing was accomplished by introducing transition-metal salts in the electrolyte in order to study the effects of dissolution on performance. It is shown that metal dissolution causes a reduction in capacity and cycle stability in full cells. The SEI layer resistance in the negative electrode of full cells increases with increasing concentration of transition metal salts. The growth of the SEI layer is non-uniform and is believed to be caused by the reduction of transition metal species in the negative electrode leading to an increase in inorganic component of the SEI layer.
Export citation and abstract BibTeX RIS

This is an open access article distributed under the terms of the Creative Commons Attribution 4.0 License (CC BY, http://creativecommons.org/licenses/by/4.0/), which permits unrestricted reuse of the work in any medium, provided the original work is properly cited.
Consumption of fossil fuels in the transportation sector is one of the leading causes of greenhouse gas emissions (GHG).1 Efforts to develop cleaner and more efficient alternatives to the internal combustion engine running on petroleum fuels, such as fuel cells and batteries, are on the rise to mitigate this problem. Rechargeable lithium-ion (Li-ion) batteries offer high energy and power densities, good cyclic stability, and low rates of self-discharge. These characteristics are essential for applications in hybrid electric vehicles (HEV), plug-in hybrid vehicles (PHEV), and electric vehicles (EV).2–8 LiCoO2, LiFePO4, LiMn2O4, LiNi1/3Co1/3Mn1/3O2, and LiNi0.8Co0.15Al0.05O2 are some of the common materials used for positive electrodes in lithium-ion batteries. LiNi1/3Co1/3Mn1/3O2 (NCM) positive electrode materials operate safely over a wide voltage window from 2.5 V to 4.6 V (Li/Li+). This positive electrode material can provide high reversible capacities of around 160–180 mAh/g at high rates. NCM provides better thermal stability with the electrolyte at high states of charge compared to other positive electrodes, such as LiNi0.8Co0.15Al0.05O2, LiNiO2, and LiCoO2, which is important for high power applications.3,7–14 Dissolution of transition metals from the positive electrode is a concern for lithium-ion batteries, and manganese dissolution is a major reason for capacity fade in spinel electrodes, including LiMn2O4.15 Although less susceptible than spinel, metal dissolution does occur in NCM electrodes and has been implicated in a rise in impedance and capacity fade with cycling.4,16 Two main routes by which capacity fading may occur due to dissolution are (i) structural changes to the positive electrode and leading to reduced insertion capacity and (ii) accelerated growth of the SEI layer at the negative electrode and the resulting irreversible Li consumption.15,17–22 Capacity fade due to the structural changes occurring in the positive electrode during partial dissolution is more likely in spinel electrodes, where the extent of dissolution is high, or at high potentials (overcharge). This large degree of dissolution in spinels may cause shrinkage of the active material, which decreased the effective transport properties and kinetics of the electrode.20,23 The extent of dissolution in different positive electrode materials was compared by Choi and Manthiram,18 and amount of Mn dissolution is 16 times greater in LiMn2O4 compared to NCM electrodes. They also reported that structural stability is directly related to the extent of dissolution in electrodes.18
Dissolution may also cause a decrease in cell capacity by increased growth and breakdown of the SEI layer21,22 on the negative electrode. Although dissolution has been studied extensively in spinel electrode materials and its negative effects on cell capacity have been well-established, how dissolution affects the growth of the solid electrolyte interphase (SEI) layer is not well-understood. The exact mechanism by which cell degradation occurs due to dissolution in NCM positive electrodes is under debate. Proposed mechanisms for dissolution include disproportionation reaction17,24 and acid corrosion starting from trace moisture present in the electrolytes.18,25,26 Transition metal ions resulting from dissolution diffuse across the separator and are reduced on the negative electrode.4,16,19,21,27–33 Since the growth of the SEI layer on negative electrodes is one of the major factors leading to capacity fade in Li-ion batteries, it is important to understand the effect of metal dissolution on the properties of the SEI layer.21,22,34–41 Understanding the changes occurring in the electrodes and the associated effect on the electrochemical performance of the cell is important in assessing the long-term behavior of these materials. Most of the reports in this area have been conducted in half cells.15,18,27,31 Although half-cell studies are helpful and provide valuable information about the electrochemical properties of the electrode material, they do not provide true estimates of capacity fade for practical applications. Electrode and cell performances vary significantly in full cells compared to those of half-cells. For that purpose, full cell studies with a practical negative electrode material like graphite are necessary.42 Because dissolution is a slow process in NCM, alternative methods are sought to assess the long-term effects of metal dissolution on cell performance.
In this work, the effects of metal dissolution on full cells employing NCM positive electrode and graphite negative electrode were accelerated. Multiple authors have reported dissolution of all transition metal species in NCM positive electrodes.4,16,18,32 In order to understand the effects of dissolution on the SEI layer and capacity fade, transition metal salts representing the metal species in NCM electrodes were added in the electrolyte to accelerate the degradation processes that may follow because of the dissolution. In this study, collective effects of all dissolved ions (Ni, Co, Mn) on the SEI formed in a full cell were investigated. Although all transition metal ions may have a similar effect on degradation and on the SEI layer, a separate study examining the effects of individual ions is warranted to understand it fully. Changes in electrochemical performances of full cells due to the effect of metal dissolution and the effect of dissolved metal ions on the SEI layer are presented. Based on the findings, a possible mechanism for capacity fade due to dissolution is discussed.
Experimental
Electrode preparation and cell fabrication
Coin cells in 2032 configuration were assembled in the laboratory to study the effect of transition metal dissolution in NCM positive electrodes. The positive electrode consisted of Li1.05Ni1/3Co1/3Mn1/3O2 (NCM, NM- 3100, Toda America), carbon black (CB, Super C65, TIMCAL), graphite (KS 6L, TIMCAL), and polyvinylidene fluoride (PVDF) binder (Kureha-7305, Kureha America). PVDF was dissolved in N-methyl-2-pyrrolidone (NMP) and consisted of 5% of solution (by weight). The composition of these electrodes was 87% (NCM), 5% (CB), 3% (graphite), and 5% (PVDF) by weight. The positive electrodes used in the cells were made in our laboratory. The negative graphite electrodes were commercial. The separator was a trilayer polyethylene/polypropylene membrane (Celgard 2325). The electrolyte contained 1M LiPF6 in ethylene carbonate (EC): diethylene carbonate (DEC) (1:1 by wt.%) (Novolyte). In order to simulate the metal dissolution that may occur in NCM positive electrodes, transition metal salts were added to the electrolyte. Powders of thermally stable nickel(II) Bis(trifluoromethanesulfonyl)imide (Ni(TFSI)2), cobalt(II) Bis(trifluoromethanesulfonyl)imide (Co(TFSI)2), and manganese(II) Bis(trifluoromethanesulfonyl)imide (Mn(TFSI)2) (Solvionic) salts were dissolved in the electrolyte so that the concentration of each metal cation was 10 mM (a 30 mM total metal concentration), referred to here as NMC salt. A high concentration of dissolved transition metals was chosen in order to accelerate the degradation process, as mentioned earlier. Carrying out a similar study with lower concentrations of transition metal ions may be helpful in the future to understand and correlate the extent of transition metal dissolved to the capacity fade. In this accelerated degradation approach, transition metal salts were introduced in the electrolyte before the SEI formation takes place. In a practical cell, dissolution of transition metal occurs slowly and may proceed after formation of SEI is complete. Gowda et al. published recent findings and showed that transition metal reduction on graphitic anodes are not affected whether or not an SEI is preformed relative to the introduction of the transition metal ions in the electrolyte.32 It should be noted that any subsequent dissolution occurring from the positive electrode will not change the concentration of the electrolyte significantly because a relatively high concentration of transition metal salts were added into the electrolyte.
For fabrication of the positive electrode, a slurry was prepared by mixing the active material (NCM), carbon black, and the binder in weight percentages given above. The mixture was blended by using an ultrasonic liquid processor (Sonicator 3000, Misonix) for 30 minutes. The slurry was mixed manually with a spatula after 15 minutes of sonication and after the sonication was complete. Next, it was stirred by using a magnetic stir bar for another two hours. Using a doctor blade (AP-99500403, Gardco), the slurry was cast onto an aluminum foil current collector placed on a vacuum plate (DP-201505, Gardco). Following the casting, the electrode was dried at 120°C overnight in a vacuum oven.
1.4 cm diameter electrodes were made from the dried cast with an arc punch. Similarly, the separator was made, but slightly larger size (1.6 cm diameter) to prevent contact between the two electrodes. The assembly process was carried out inside an Argon filled glove box. First the negative electrode was placed unto the bottom case and covered by the separator. Then, 150 μL of electrolyte was added and the positive electrode was placed facing the negative electrode. After that, spacers and a spring washer were added and the coin cell was sealed using a crimper. Thus prepared coin cells were left overnight, and electrochemical testing was commenced on the following day.
Electrochemical testing
All cycling tests were performed on Arbin BT2000 battery cycler (Arbin Instruments). Initial formation cycles included 5 charge and discharge cycles at C/10 rate based on the theoretical capacity of the positive electrode. Cells were charged by following a constant current-constant voltage (CC-CV) protocol. The end-of-charge (EOC) voltage limit was 4.2 V. Following galvanostatic charge at C/10 till this EOC voltage was met; cells were then held at 4.2 V until the current dropped to C/20. After each charge and discharge step, there was a rest period of one hour to allow the cells to equilibrate. The discharge was carried out at a rate of C/10. The discharge step continued until EOD voltage limit of 2.75 V was met. After formation cycles, the useable capacity was determined based on the formation cycles capacities. For long-term testing, 50 cycles were done at C/2. Finally, 5 cycles were done at C/10 to compare the end of cycle capacity to capacity obtained at the end of formation. Electrochemical impedance spectroscopy (EIS) was performed on cells using a potentiostat/galvanostat (Model PGSTAT302N, Metrohm-Autolab) running Nova software. The impedance was carried out in potentiostatic mode at open-circuit potentials at a fully charged state. The amplitude of the AC signal was set at 5 mV and the frequency ranged from 1 MHz to 10 mHz.
Postmortem analysis
After cycling was completed, the discharged cells (graphite delithiated) were dismantled in a glove box in an argon environment. The graphite electrodes were soaked in dimethyl carbonate (DMC) to remove Li salt and dried out before post-mortem analyses. High Resolution (HR)-SEM (Hitachi SU8000) and Focused Ion Beam (FIB)-SEM (Nova nanolab FEI 200) were used to investigate the morphology of the negative electrode surface and cross-section of the SEI layer. X-ray photoelectron spectroscopy (Kratos XPS) was used to identify and analyse the surface components of the SEI layer.
Results and Discussion
The first charge and discharge profiles for full cells with the standard electrolyte and 30 mM NMC salt electrolyte are shown in Fig. 1a. The cells were cycled between 2.75 V and 4.2 V at C/10 rate for the first 5 cycles. During the first cycle, reduced charge and discharge capacities were observed for cells with NMC salt added in the electrolyte. The first cycle irreversible capacity loss for cell with standard electrolyte was 16%, by comparison the loss was 25% for the cell where the transition metal salts were added to the electrolyte. Large first-cycle capacity losses were also observed by Tsunekawa et al.28 after soaking the graphite negative electrode in Mn containing salt. Differential capacity curves for these cells are compared in Fig. 1b. From the differential capacity curves, the charging peaks shift positively by about 100 mV corresponding to higher over-potentials for cell with NMC salt. The discharge peaks remain the same for both cells; but a smaller area under the curve is observed, representing lower capacity for cell with NMC salt.
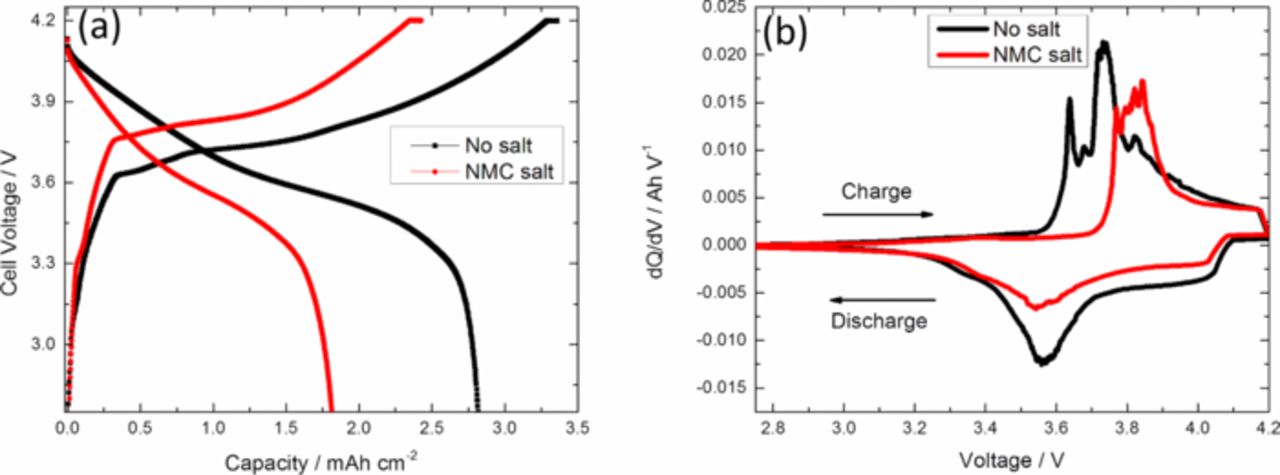
Figure 1. (a) First cycle charge and discharge capacities of a full cell comparing the effects of NMCsalt addition to the electrolyte, (b) Differential capacity curve of a full cell during first cycle charged and discharged between 2.75 V and 4.2 V at C/10.
Cell capacities and coulombic efficiencies are compared in Fig. 2. The addition of 30 mM NMC salt in the electrolyte resulted in a loss of 30% of initial capacity measured at the end of the formation period, whereas the control cell lost only 4% of its formation period capacity. Fluctuations in the overall capacity with cycling were caused by small temperature variations in the room. After 50 cycles at C/2, the rate was reduced to C/10 and 96% of the initial capacity for cell with no salt additives was available at the end of the cycling period. The loss of reversible capacity at low rate (C/10) can be attributed mostly to the loss of cyclable lithium in the cell as reduction products in the SEI. After 5 cycles at C/10, discharge capacity at high rate (C/2) for the cell with NMC salt was 41% lower than the discharge capacity at low rate. Conversely, for cell with standard electrolyte, the reduction in capacity at high rate compared to low rate was 21% between cycles 5 and 6. The difference in ohmic drop related to the ohmic resistance at C/2 and C/10 is only 8 mV for the NMC salt sample. The ohmic resistance alone cannot describe the large drop in discharge capacity between C/10 and C/2. In order to correctly identify the contributing factors for this decrease in capacity at higher rate, charge transfer resistance and diffusional resistance as well as the potential drop across the SEI layer need to be considered. Transition metal salts added in the electrolyte caused a significant loss in initial capacity as well as irreversible capacity after cycling. The coulombic efficiency of cell with NMC salt is lower in the first cycle and it stays lower compared to the cell with standard electrolyte. After 3 cycles, the coulombic efficiencies for both cells are constant. Thus, it appears that a relatively stable SEI is formed after a few cycles, but the rate of SEI growth is higher in cells with the added NMC salt.
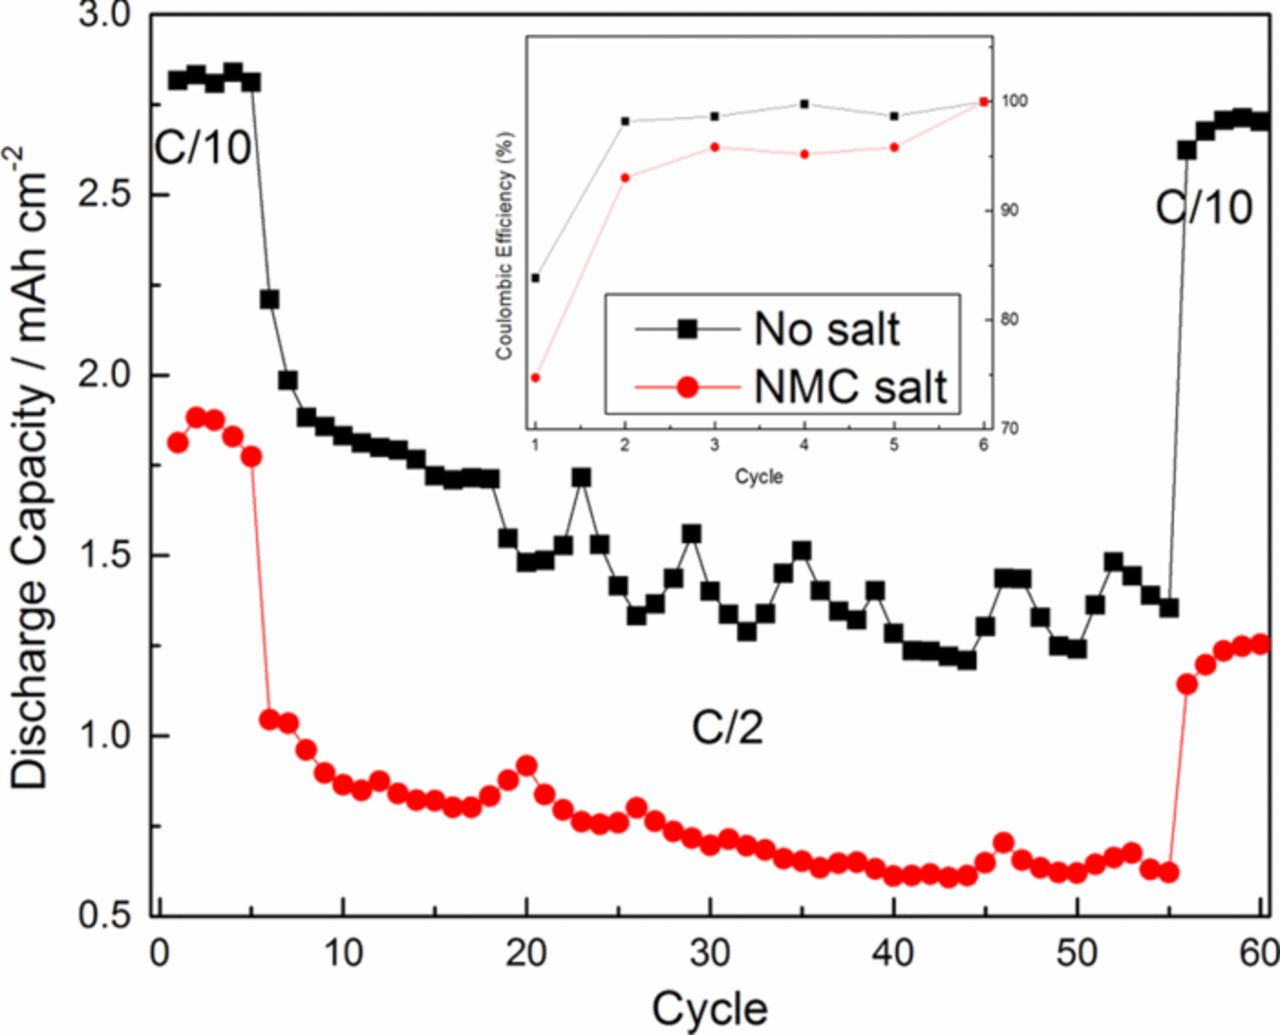
Figure 2. Cycling performances of full cells with and without NMC salt additive in the electrolyte. Cycling was done at C/2. First and last 5 cycles were cycled at C/10.
In order to identify different contributions to the total cell impedance, electrochemical impedance spectroscopy (EIS) was done. Results from an EIS analysis are useful in identifying the solution resistance, SEI layer resistance, charge-transfer resistance, and the nature of diffusion processes occurring in porous electrodes. The frequency response in a Nyquist plot typically contains a high-frequency intercept recognized as the solution resistance, a semi-circle at high frequencies ascribed to the surface layer or SEI resistance, a semicircle at middle frequencies attributed to the charge-transfer resistance, and an inclined line at low frequencies associated with diffusion processes in the porous electrodes.42–44 Comparing the impedance spectra after the formation period in Fig. 3a, a larger semi-circle at high frequency for NMC salt sample was observed. The first semi-circle at the high frequency was assigned to the SEI resistance. The second semi-circle at middle frequencies was assigned to the charge-transfer resistance. The diameter of the semi-circle at high frequencies and the diameter of the semi-circle at middle frequencies were larger for the cell containing NMC salt. Corresponding to the larger diameter semi-circles, the charge-transfer resistance as well as the SEI resistance were both higher, according to our analysis. A similar trend was seen on the impedance spectra for the cycled cells in Fig. 3b. After cycling, there were increases in the diameter of the semi-circle related to the SEI resistance as well as the diameter of the semi-circle related to the charge transfer for both cells. As observed from the diameter of the semi-circles at high frequencies and the diameter of the semi-circles at middle frequencies, the increases in resistances for NMC salt cell were much larger again compared to the EIS from cells with standard electrolyte.
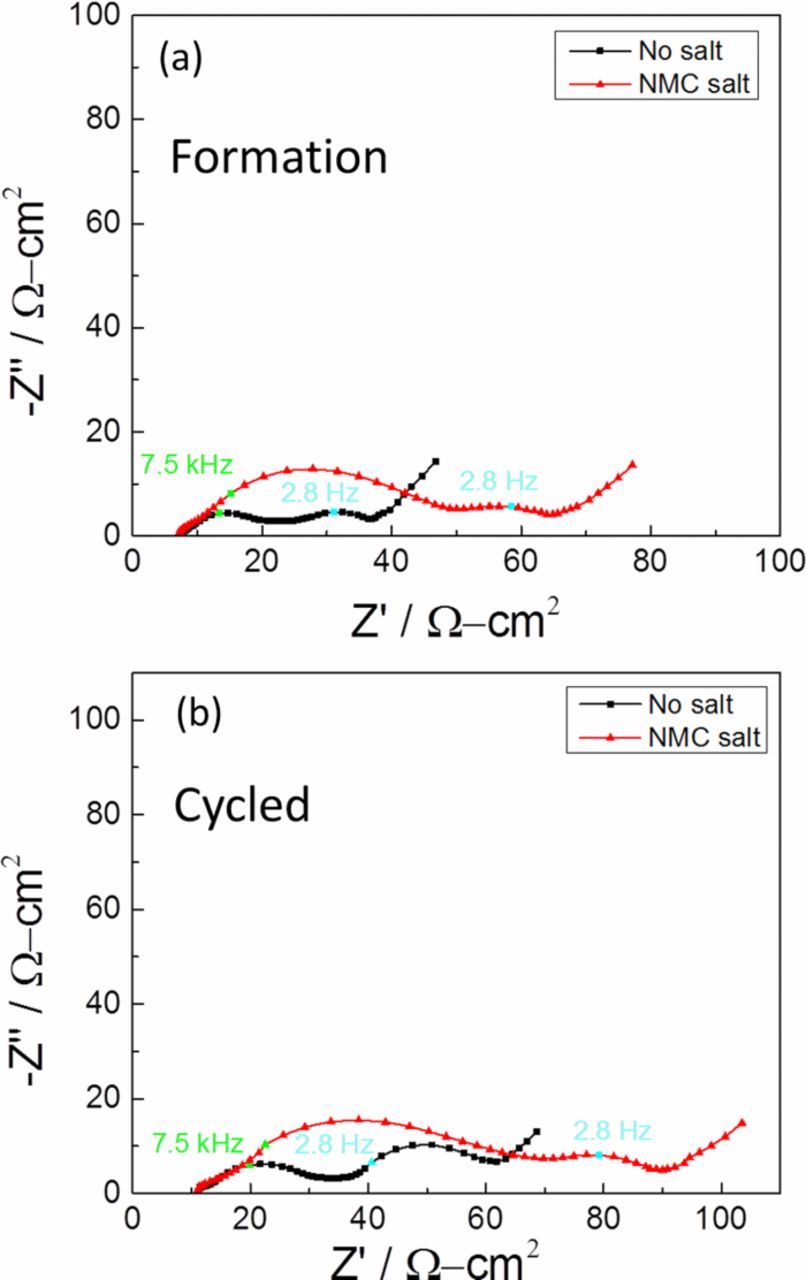
Figure 3. (a) Nyquist plots of fully charged cells after (a) formation period and (b) after cycling.
To examine the changes in the surface morphology of the graphite electrodes, postmortem analysis using SEM was carried out. Fig. 4a shows the SEM images of a pristine graphite electrode. SEM images of graphite electrodes harvested from cycled full cells with standard electrolyte and with NMC salt added in the electrolyte are shown in Figs. 4b and 4c respectively. In both cases, graphite electrode samples from cycled cells show a bright oxide layer covering the electrode. This layer is believed to be the SEI layer. When transition metals were added to the electrolyte in Fig. 4c, noticeably higher surface roughness of the SEI as well as large agglomerates of a bright oxide layer non-uniformly distributed throughout the graphite electrode were seen. These agglomerates were irregular in size and varied from nano-sized up to 11 μm. These SEI-like particles were absent in other electrode samples. These particles may be formed due to the growth in inorganic component of the SEI layer resulting from the transition metal ions reacting with other SEI components and with solvent molecules in the electrolyte.
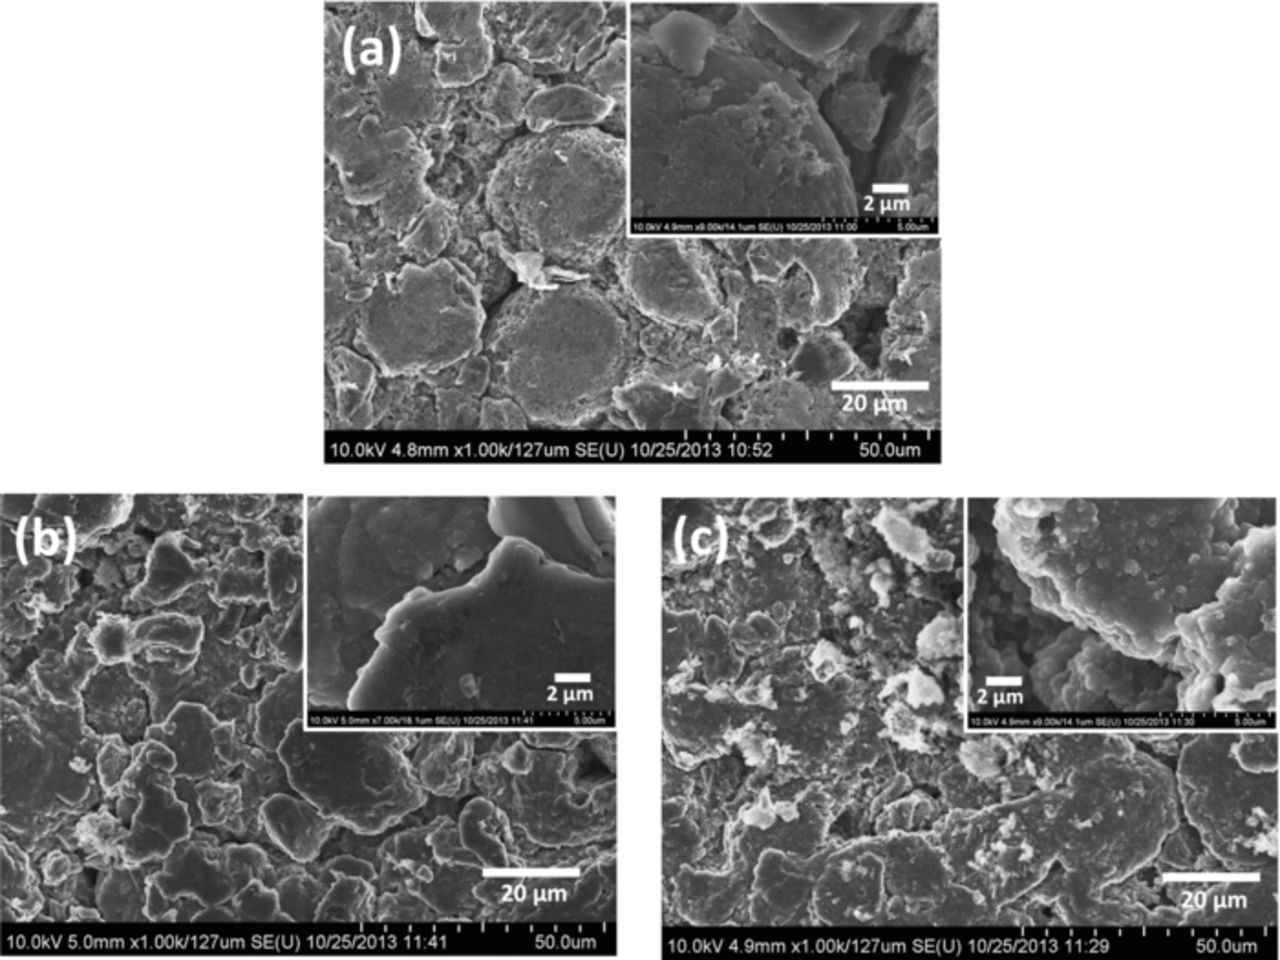
Figure 4. HR-SEM surface morphologies of graphite electrode from (a) pristine electrode (b) full cell with no transition metal salt after cycling (c) full cell with transition metal salt after cycling.
Cross-sectional images of graphite electrodes from full cells provide a better idea about the relative thicknesses of the SEI-like surface layer. Figs. 5a and 5b show FIB-SEM cross-section images of the graphite electrodes from full cells after cycling. The surface layer thickness on the graphite electrode with standard electrolyte in Fig. 5a was uniform and it varied from 60 nm to 70 nm. In contrast, the surface layer thickness with transition metal salts added in the electrolyte in Fig. 5b was irregular and much thicker, varying from 200 nm to 400 nm. Transition metal salts added to the electrolyte appear to have significantly accelerated the growth of the SEI layer in the negative electrode in the full cell. It is evident from comparisons of SEM and FIB-SEM images that transition metals in the electrolyte not only contribute to the growth of a non-uniform SEI throughout the electrode but also to a thicker SEI layer.
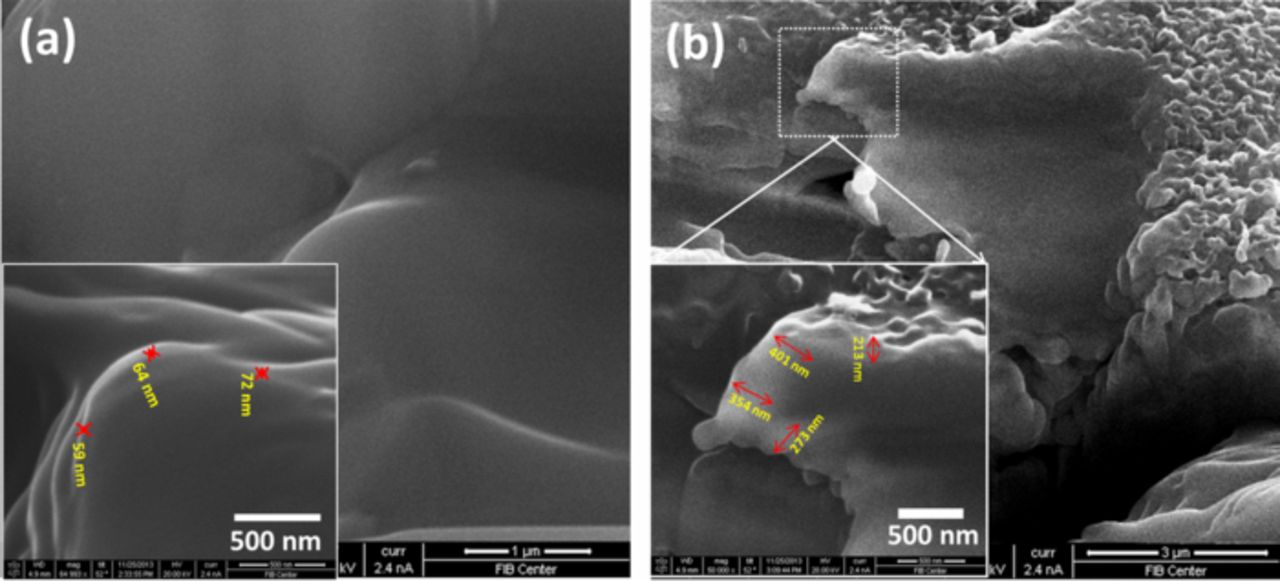
Figure 5. FIB-SEM cross-sectional images of graphite electrodes after cycling from full cells (a) with standard electrolyte and (b) with transition metal salts added in the electrolyte.
Fig. 6 shows the XPS spectra from the graphite electrodes. All electrode samples showed a peak in the region of 284.8 eV for graphite and a peak in the region of 289 eV for PVDF. The XPS was not coupled with sputtering and the analysis and peak assignments for all species were done based on relevant literature available.45–51 A peak in the region of 285.8 eV was assigned to the sp2 hybridized carbon. The observation of a peak around 286.5 eV in all samples is due to the C-O group. In case of fresh electrode samples, this contribution is likely due to oxidation of carbon black used as additive in the electrode. In cycled electrode samples, presence of this peak suggests that organic components of the SEI layer like polyethylene oxide (PEO) and other polymeric species were present. Similarly, a peak around 289.5 eV was identified which was attributed to lithium alkyl carbonates (ROCO2Li). Lithium ethylene dicarbonate (CH2OCO2Li)2 is known to be one of the major constituents of the SEI formed in systems containing EC in electrolytes.45,46 Along with these organic SEI layer components, in the case of electrode samples with transition metal salts in the electrolyte, another peak around 290 eV was observed. This peak was assigned to Li2CO3 which constitutes the inorganic components of the SEI layer. The addition of transition metal in the electrolyte likely caused an increase in the inorganic components of the SEI layer.
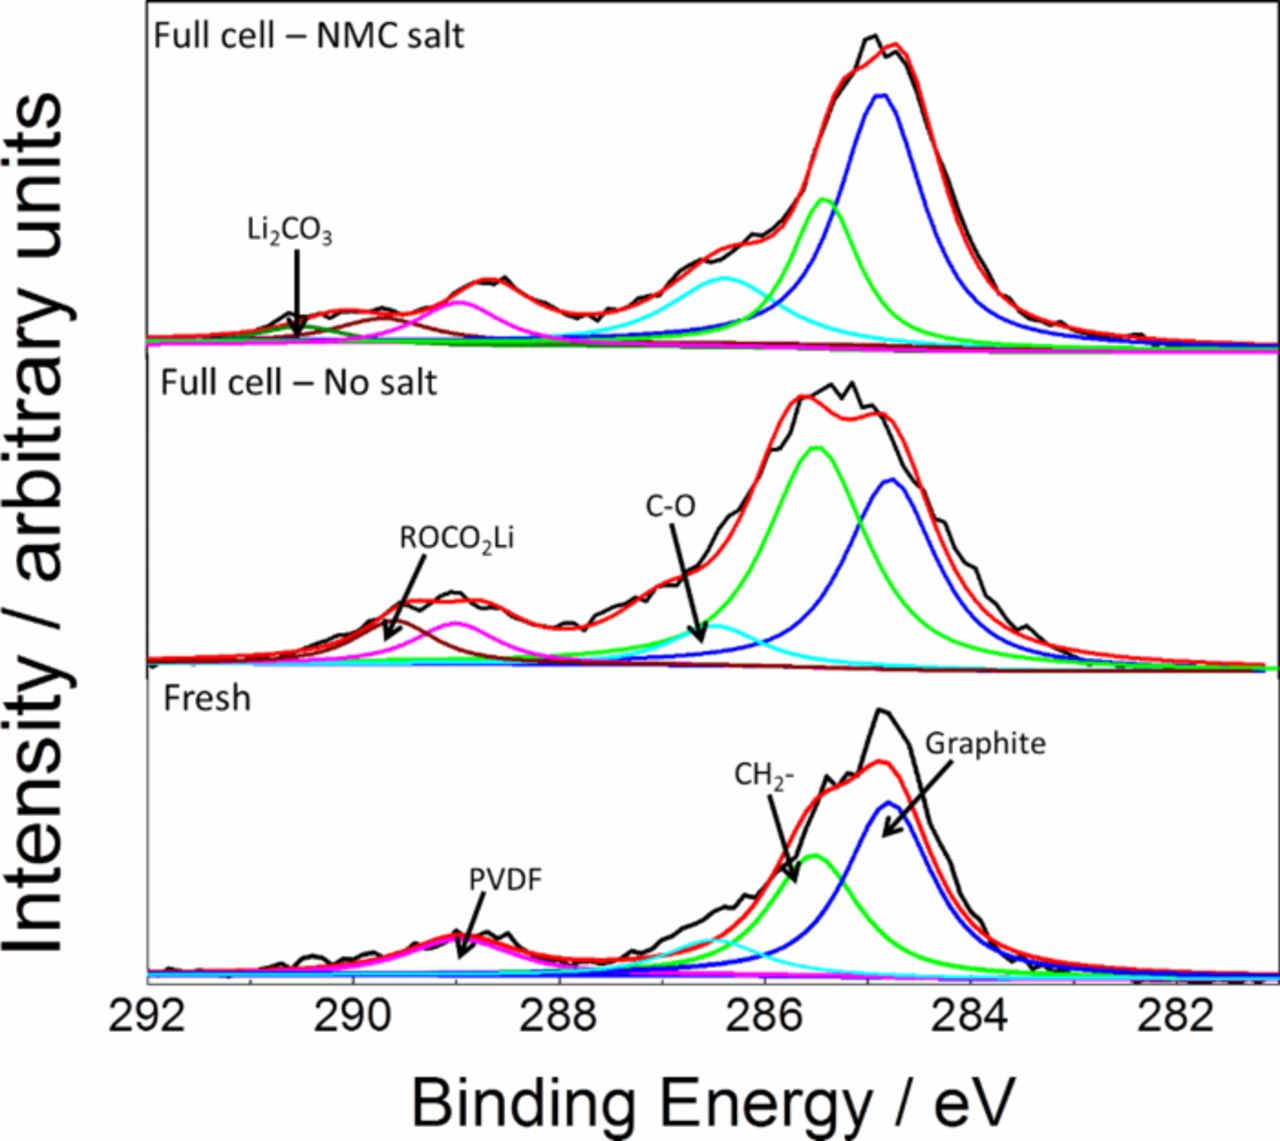
Figure 6. C 1s XPS spectra for graphite electrode from a fresh graphite electrode and cycled graphite electrodes harvested from full cells and half cells with and without transition metal salts added in the electrolyte.
Results presented here show that transition metal salts in the electrolyte cause a significant loss in capacity in full cells. Capacity fade is caused by a number of mechanisms that are often coupled. The exact nature of the capacity fade is unclear. Adding transition metals to the electrolyte to accelerate capacity fade, as used in this report, helps focus on dissolution as a cause of capacity fade. Based on our experimental observations and relevant literature in this area, we present a discussion to understand the effects of the dissolved transition metal salts on the nature of the SEI layer and its growth.
Transitional metal ions present in the electrolyte would diffuse to the negative electrode. There is no question that these transition metals accumulate at the negative electrode;16,30,32,33 however, the valence of these metals has been disputed. Because their standard potentials are more positive than lithium, these metals are expected to be reduced on the negative electrode surface. Recently two different groups at Argonne National Lab and Oak Ridge National Lab presented compelling evidence that the Mn from the positive electrodes is metallic Mn (Mn0).32,33 These results are useful in elucidating the increased rates of capacity fade and increased resistance ascribed to the SEI layer.
One hypothesis for explaining increased degradation is the increased loss of lithium in the SEI layer in the negative electrode. For the first cycle, the irreversible capacity loss of the cell with NCM salt in the electrolyte is more than 25%. Most of the capacity loss during the formation cycles is related to the SEI layer formation. The total amount of lithium available for cycling is fixed by the lithium content of the positive electrode when the cell is assembled. As more cyclable lithium is lost to the SEI layer, the total lithium available in the cell for charge and discharge decreases. A large lithium loss causes the NCM electrode to operate at a more delithiated state and at higher potential. The lithium content of the negative electrode increases due to the accumulation of lithium in the SEI layer. Thus, for the same cell potential, the positive electrode operates at a more delithiated state and at a higher potential. From differential capacity curves in Fig. 1b, a 100 mV shift during charging was observed for cell with transition metal salts in the electrolyte due to this high irreversible lithium loss in the SEI layer during the first cycle.
The reduction of a transition metal ion on the surface of the graphite electrode is accompanied by the deintercalation of two Li+ from the graphite electrode. The reduction reaction of transition metal ions in the negative electrode proceeds by a transition metal (M2+) – Li+ exchange mechanism.28
![Equation ([1])](https://content.cld.iop.org/journals/1945-7111/161/12/A1915/revision1/jes_161_12_A1915eqn1.jpg)
As reduction of dissolved transition metal ions on the graphite electrode proceeds, the subsequent loss of Li+ from the graphite electrode leads to a capacity loss of the cell. If all of the added transition metal in the electrolyte (10 × 10−3 mol each, 150 × 10−6 L) are reduced (M2+ + 2e− → M0) on the negative electrode, 9 × 10⁻⁶ mol Li+ will be deintercalated according to Reaction 1 (formatting for the reference). For the graphite electrode used, total intercalated Li+ is estimated to be 1.44 × 10⁻⁴ mol based on the active material weight of 12.83 × 10⁻³ g for graphite and 300 mAh/g capacity. From this estimate, the capacity loss of the graphite electrode due to the Li+ deintercalation from transition metal reduction on its surface can be calculated to be 6.3%. This value represents a significant capacity loss for the electrode. However, the much higher capacity loss of 30% measured for cells with transition metal dissolved in the electrolyte cannot be explained by this mechanism alone. In order to understand the increased capacity fade fully, we need to look at the SEI layer and modifications in the SEI layer due to transition metals in the electrolyte.
The reduction of electrolyte at the negative electrode and electrolyte interface during the first few cycles helps form the SEI layer. The electrolyte reduction continues throughout the life of the battery but the rate of growth is greatly diminished after the first few formation cycles. The SEI formed in carbonaceous electrodes is complex in structure. The emerging consensus is that the SEI contains an inner thin dense layer that consists mainly of inorganic reduction products and an outer layer that consists of mainly organic reduction products.45 The properties and composition of the SEI including the inorganic and the organic layers vary with the choice of the negative electrode and electrolyte solution. The growth of the SEI layers is believed to be controlled by the transport of solvent molecules through the outer porous layer. The outer porous organic layer restricts the transport of solvated Li-ions or solvent molecules but allows for the diffusion of de-solvated Li-ions through the layer after the formation of stable SEI layer at the end of the formation period.
Experimental evidence presented in literature concerning SEI growth due to transition metal highlight a common observation: presence of transition metal on the negative electrode accelerates the growth of the inorganic components of the SEI.22,28,33 Formation of different metal fluorides and carbonates including LiF and Li2CO3 have been reported on the SEI formed on the negative electrode with transition metal present in the electrolyte. In this work, we also identified Li2CO3 as a component in the surface layer of the graphite electrode of the cell with transition metal salts added in the electrolyte. Li2CO3 was not observed in the sample with standard electrolyte during the postmortem analysis by using XPS. Previous XPS studies coupled with sputtering have shown the presence of Li2CO3 well within the SEI layer.50,51 It is also noted in the literature that organic SEI layer component like ROCO2Li, which is a major reduction product in EC containing electrolytes, undergoes decomposition according to Reaction 4 noted below to form Li2CO3. As this organic reduction product is closer to the surface, the subsequent decomposition reaction is very likely when the electrode sample is being prepared and transferred to the analysis chamber. Thus, although most of the Li2CO3 in the SEI layer is well within the relatively thicker SEI layer, further decomposition of surface organic products into Li2CO3 when the sample is exposed leads to its detection on the surface analysis by XPS. Although utmost precaution was taken to avoid exposing the electrode sample to the ambient atmosphere, it is almost impossible to avoid doing so when preparing and transferring the electrode sample for XPS analysis. In EC based electrolytes, (CH2OCO2Li)2 is a major solvent reduction product and the solvent reduction reaction proceeds as follows41
![Equation ([2])](https://content.cld.iop.org/journals/1945-7111/161/12/A1915/revision1/jes_161_12_A1915eqn2.jpg)
![Equation ([3])](https://content.cld.iop.org/journals/1945-7111/161/12/A1915/revision1/jes_161_12_A1915eqn3.jpg)
(CH2OCO2Li)2 forms a protective layer around graphite active material and protects against further solvent reduction. It forms a porous outer layer and controls the growth of the SEI layer by limiting the rate of solvent diffusion through this layer. When transition metals are present in the negative electrode, (CH2OCO2Li)2 undergoes further decomposition to produce Li2CO3 and other inorganic SEI layer components.
![Equation ([4])](https://content.cld.iop.org/journals/1945-7111/161/12/A1915/revision1/jes_161_12_A1915eqn4.jpg)
Li2CO3 thus produced may react with HF in the electrolyte (formed by the reaction of fluorinated salt with trace H2O) to give LiF.
![Equation ([5])](https://content.cld.iop.org/journals/1945-7111/161/12/A1915/revision1/jes_161_12_A1915eqn5.jpg)
![Equation ([6])](https://content.cld.iop.org/journals/1945-7111/161/12/A1915/revision1/jes_161_12_A1915eqn6.jpg)
Based on our results and corroborating evidence in literature, we predict that the presence of transition metals in the negative electrode may catalyze the decomposition reactions and promotes the formation of Li2CO3 and LiF. The decomposition of (CH2OCO2Li)2 leads to an increase in cracks and pores in the SEI layer. Furthermore, this decomposition leaves an increased surface area of the graphite active material exposed to the electrolyte, which enables solvent reduction to continue. As a result, SEI growth continues beyond the formation period and contributes to a large capacity fade in cells with continued transition metal dissolution. From our XPS results (Fig. 6) and other literature studies with transition metals in the electrolyte, it is evident that transition metals present on the negative electrode accelerate the formation of inorganic SEI layer components such as Li2CO3 and LiF. Similarly, accelerated growth of the SEI layer was also observed from our SEM (Fig. 4) and FIB/SEM studies (Fig. 5), which is corroborated by literature studies analyzing the effects of transition metals on the SEI layer.33 The growth of the SEI layer due to transition metal contributes to a large increase in the impedance of a cell. Additionally, the growth of the SEI layer supported by the transition metal leads to a loss of cyclable lithium within the SEI layer leading to an increased capacity fade.
SEI growth may occur through electronic conduction through the layer or may be governed by the solvent diffusion. If all of the added transition metal in the electrolyte (10 mM, 150 μL) are reduced (M2+ + 2e− → M0) on the negative electrode, 1.62 g/m2 of metal would be deposited. Using the graphite active material loading (76.6 g/m2) and BET surface area (4 m2/g) values for the negative electrode, total area of 4.9 × 10⁻² m2 is obtained. For an average SEI layer thickness of 300 nm in Fig. 5b, the total volume of the SEI was calculated to be 1.5 × 10⁻⁸ m3. The weights of reduced metals in the SEI were converted to volumes using tabulated densities. Thus, the total volume fraction of the SEI due to the reduced metal was estimated to be 0.0021. For such a small volume fraction of metal in the SEI, conduction through the layer is highly unlikely. Therefore, SEI growth through solvent diffusion may provide a better explanation.
A schematic showing a physical picture of the SEI growth is shown in Fig. 7. Transition metal ions present in the electrolyte diffuse through the SEI layers and get reduced on the graphite/SEI interface. Solvent molecules may diffuse through the porous SEI layers and get reduced at the graphite active material surface mainly forming lithium alkyl carbonates. Electrons required for this reduction reaction is available through conducting graphite. Li+ can diffuse through the SEI layers. Lithium alkyl carbonates shields the graphite active material surface from further reduction. But, in presence of transition metals, lithium alkyl carbonates undergo further decomposition to form Li2CO3 and other inorganic compounds. The area in the graphite/SEI interface where metal reduction occurs catalyzes this decomposition reaction. Transition metals catalyze this degradation reaction and the organic SEI layer undergoes morphological changes which cause cracks and pores. The cracks in the SEI layers provide a channel for solvent species to diffuse through the layers. As we observed from FIB/SEM results (Fig. 5), the growth of the SEI layer is non-uniform. Transition metal reduction on the graphite electrode also occurs non-uniformly and the areas in the graphite electrode where metal reduction occurs favor the largest growth in the SEI layer.33 As a result, the growth of the SEI due to dissolved transition metals is also not uniform. The regions in the graphite electrode with transition metal reduced accelerate the further growth of the SEI via reduction and subsequent breakdown of solvent species.
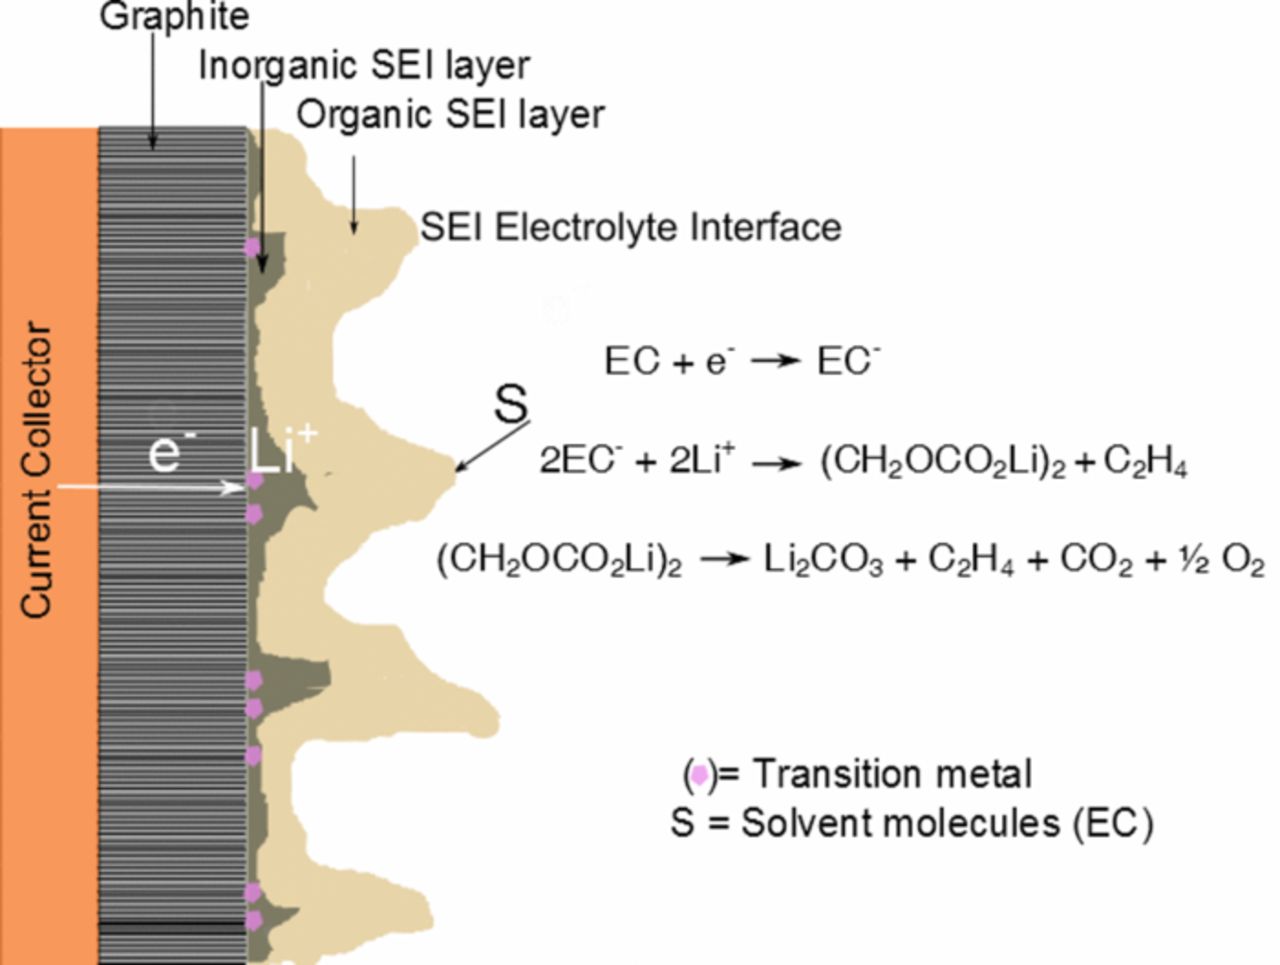
Figure 7. Schematic of a negative electrode and electrolyte interface showing the growth of the SEI layer due to transition metal species present in the electrolyte.
Conclusions
We studied the effects of the transition metal dissolution in full cells employing NCM positive electrodes and graphite negative electrodes by using accelerated testing via addition of transition metal salts in the electrolyte. The addition of transition metal salts in the electrolyte of full cells decreased the capacity and cycleability of the cells. Reduction of transition metal salts in the negative electrode likely caused an increase in the SEI layer resistance. Post-mortem analysis showed appearance of agglomerates of randomly distributed SEI-like particles throughout the electrode in case of cycled graphite electrode from full cell with transition metal salt added in the electrolyte. Cross-sectional images from FIB-SEM showed up to 4 times thicker SEI layer for NMC salt sample compared to that with cycled graphite electrode with regular electrolyte. Addition of transition metal species in the electrolyte was shown to facilitate the growth of the SEI layers. A mechanism showing the increase in the growth of the SEI layer as a result of dissolution of transition metal salts in the electrolyte was presented.
Acknowledgments
This work was supported by the Honda R&D Americas Inc.