Abstract
Tip-generation/substrate-collection mode (TG-SC) of scanning electrochemical microscopy (SECM) was used to study oxygen reduction reaction (ORR) at nanoporous Pt films depending on their pore characteristics. Nanoporous Pt films were electrodeposited in solutions containing Pt precursor, Triton X-100, and lead acetate. The varied composition of electroplating solutions could control the porosities of the deposited Pt films with three different degrees (denoted as npPt-I, npPt-II, and npPt-III): npPt-I had only nanoscale pores but npPt-II and npPt-III had both nanoscale and microscale pores; and npPt-III possessed additional microscale pores. Recessed Pt tips deposited with three different npPts were used to observe their ORR activities in TG-SC mode of SECM, considering its advantage of ∼100% collection efficiency for H2O2 (2-e transfer product of ORR). The SECM results indicate that npPt-I is beneficial for the kinetic controlled potential region via the O2 molecule confinement within npPt-I, while npPt-III is more advantageous in the mass-transport controlled region due to the more promoted O2 influx through the microscale pores leading to the more efficient utilization of the electrode surface for ORR.
Export citation and abstract BibTeX RIS

This is an open access article distributed under the terms of the Creative Commons Attribution Non-Commercial No Derivatives 4.0 License (CC BY-NC-ND, http://creativecommons.org/licenses/by-nc-nd/4.0/), which permits non-commercial reuse, distribution, and reproduction in any medium, provided the original work is not changed in any way and is properly cited. For permission for commercial reuse, please email: oa@electrochem.org.
The search for new catalyst materials for high-performance oxygen reduction reaction (ORR) is important due to the wide range of applications especially for polymer electrolyte membrane fuel cell. ORR, however, is a sluggish reaction and requires a high overpotential. In acidic media, ORR undergoes to produce H2O as a final product via either direct 4-electron transfer or stepwise 2-/2-electron transfer going through the formation of a 2-electron reduction product, H2O2 (equations 1 and 2 shown below).1
![Equation ([1])](https://content.cld.iop.org/journals/1945-7111/162/10/H792/revision1/jes_162_10_H792eqn1.jpg)
![Equation ([2])](https://content.cld.iop.org/journals/1945-7111/162/10/H792/revision1/jes_162_10_H792eqn2.jpg)
In any of these pathways, total number of electrons transferred (n value) nearly 4 is desirable to attain efficient ORR. In the case of 2-/2-electron transfer, the intermediate product, H2O2, is required to stay at the electrode surface or thereabouts for a certain time in order to be further reduced to H2O as a final product. Otherwise, this stepwise pathway causes to lower the ORR efficiency with decreasing n value.
The best ORR catalyst material today is platinum (Pt). Due to the high price and scarcity of Pt, there have been many efforts to develop efficient electrocatalysts by increasing its catalytic surface area. One of the strategies for enlarging active surface area is fabricating nanoporous structures. Owing to their high surface-to-volume ratios, nanoporous structures have been attracted showing their high catalytic activity. In recent years, improved catalytic activity at nanoporous structures started to be explained in terms of not only increased surface area but also their morphological features, namely, confinement effect.2 According to Han et al., the confined space in nanoporous structures enhances H2O2 redox reaction and ORR increasing collision efficiency of reactants by trapping them within pores.3 This suggests that the particle-to-particle distance of the nanoporous catalysts significantly affect the electrocatalytic activity.
Loads of studies have reported the enhanced ORR activity at porous Pt film.4–8 Shim5 and Tominaka7 made porous Pt thin film by electrodeposition and showed the improved ORR activity compared with planar Pt. Jung et al. fabricated porous Pt film with tens of nanometer sized pores by reactive sputtering.4 Porous films with the same pore size but different numbers of pores were made by changing sputtering atmosphere. The impedance test for ORR showed that the more porous Pt has enhanced electrode conductance. Hamel et al. made porous Pt film on carbon substrate with different pore size by pulsed laser deposition under different He gas pressure.6 Increasing ORR current density (including n value) and more positive E1/2 were observed with increasing pore size. Due to very thin Pt film on carbon substrate, however, the catalytic activity of carbon substrate is not negligible.
Rotating ring and disk electrode (RRDE)9–11 and scanning electrochemical microscopy (SECM)12–21 have been generally used to study the ORR activity and mechanism at various metallic thin film catalysts using Pt or Au electrodes for H2O2 detection. Especially, SECM has been proven to be useful for studying the mechanism and activity associated with electrode reactions with high collection efficiency, minimizing experimental errors, such as the effects of the resistive potential drop in solution, the charging current, etc.22 The substrate generation/tip collection (SG-TC) mode of SECM has been widely utilized for the investigation of ORR activity at metallic thin films.15,17,19 The SG-TC mode of SECM, however, still shows low collection efficiency less than 50%.23 The tip-generation/substrate-collection (TG-SC) mode of SECM appears to be attractive for detecting intermediates of tip electrode reaction with nearly 100% collection efficiency.24 However, to the best of our knowledge, there is no report on the investigation of ORR activity of an ultramicroelectrode (UME) by collecting the ORR intermediate (H2O2) at a substrate electrode in TG-SC mode.
Porous Pt films have been fabricated using various strategies such as sputtering,4,25,26 dealloying,25,27–31 electrochemical deposition,27,32 and etc. In current study, porous Pt films with three different degrees of porosities (denoted as npPt-I, npPt-II, and npPt-III, from the smallest to largest pore sizes) were readily prepared by utilizing an electrodeposition along with a simple modification of electroplating solution composition ratios. In fact, the Pt films were electrodeposited on the recessed pore of Pt disk UME (10-μm diameter) using electroplating solution containing Pt precursor and surfactant forming reverse micelle template with various mixing ratios. Their ORR activities were studied with a SECM in TG-SC mode, considering its advantage of ∼100% collection efficiency for the ORR intermediate, H2O2. For comparison, ORR at a planar bare Pt disk UME (10-μm diameter) was also investigated. All the nanoporous Pt films show enhanced ORR activity compared with the bare Pt disk. Meanwhile, different pore sizes of the porous Pt film were found to lead to different ORR activities.
Experimental
Chemicals
Platinum wire (≥ 99.9%, 76 μm diameter), Kimble microcapillary pipettes, sodium chloride (≥ 99.5%), Triton X-100, hexaammineruthenium(III) chloride ([Ru(NH3)6]Cl3, 98%), potassium sulfate (powder, 99+%, A.C.S. reagent), and sulfuric acid (95.0 – 98.0%) were all from Sigma-Aldrich (St. Louis, MO). Pt wire (10-μm diameter) was from Nilaco (The Nilaco Corporation, Tokyo Ginza). Carbon paste from BASi was used for electrochemical connection between an end of platinum wire and a copper wire (Hook-up wire, 28 AWG, Solid PTFE, Spool Green) from AlphaWire. Dihydrogen hexachloroplatinate(IV) hydrate (H2PtCl6·xH2O, Premion, 99.999%) was purchased from Alfa Aesar (Ward Hill, MA). Lead(II) acetate trihydrate (≥ 99.5%) was supplied by Fluka (Steinheim, Germany). All solutions were prepared with 18 MΩ•cm deionized water.
Instruments
Electrochemical deposition was performed using an electrochemical analyzer (CHI 730D) and a refrigerating /heating bath circulator (RW-0525G, JEIO TECH). For all deposition processes, a Pt wire and a saturated calomel electrode (SCE) were used as the counter electrode and the reference electrode, respectively. Electrochemical measurements using SECM were performed in a four-electrode setup using an electrochemical analyzer (CHI 920C SECM) with a gold wire and Hg/Hg2SO4 electrode as the counter electrode and the reference electrode, respectively. Commercial SECM cell was utilized. Each porous Pt structure electroplated on a Pt foil (3 × 3 mm2, 0.025 mm thick) were characterized by field emission scanning electron microscopy (FE-SEM, JEOL JSM-6700F) in order to figure out their structures and pore sizes. For understanding the distances among Pt nanoparticles, porous Pt structures deposited on a TEM gold grid (300 mesh, TED PELLA, INC.) were used to obtain FE-TEM images.
Electrode fabrication
Tip and substrate electrodes were prepared by sealing Pt microwires (10 μm or 76 μm in diameter) under vacuum in glass capillaries (Kimble) followed by vertical polishing to expose the Pt microdisks at the end plane, as previously reported.33 The prepared 10-μm diameter Pt disk ultramicroelectrode (UME) with RG = 6–8; and 76-μm diameter Pt disk electrode were utilized as the tip and substrate electrodes, respectively. RG is the ratio of the overall tip electrode radius including a glass sheath to the Pt disk radius. The Pt tip electrode was immersed in 1.2 M CaCl2 dissolved in acetone/water mixture (1:2 in volumetric ratio) and then the Pt disk was etched by applying 5 V ac voltage (60 Hz) with respect to 0.5 mm diameter Pt wire counter electrode for 4 s using variable autotransformer (Staco Energy Products Co., Daton, OH).
Electrodeposition of porous Pt structures
Pt layers with three different degrees of porosity (npPt-I, npPt-II, or npPt-III) were electrochemically deposited on the Pt surfaces within the recessed pore of the etched Pt tip electrodes with amperometry or cyclic voltammetry (CV) using Pt wire counter electrode and saturated calomel reference electrode (SCE). First, npPt-I was electroplated in a deposition solution (denoted as Soln A) containing H2PtCl6, 0.3 M NaCl aqueous solution, and Triton X-100 (5 : 45 : 50 in wt%) by applying −0.21 V for 1300 (±100) s at 40°C.34 For npPt-III, Soln B was used as the deposition solution composed of 1 g of Soln A and 220 μL of 10 mM Pb(CH3CO2)2·3H2O aqueous solution. In fact, npPt-III was electrodeposited by CV from +0.6 to −0.25 V for 2 (±1) cycles with scan rate of 20 mV s−1 at 40°C. For the deposition of npPt-II, the deposition solution (denoted as Soln C) was slightly varied from Soln B in terms of H2PtCl6 : 0.3 M NaCl solution : Triton X-100 ratio (i.e., 1.5 : 45 : 53.5 in wt% was used instead of 5 : 45 : 50). npPt-II was electroplated by CV (from +0.6 to −0.25 V for 7 (±1) cycles with scan rate of 20 mV s−1 at 40°C.
In all deposition processes, the deposition solutions were heated to 60°C in order to activate components inside of the mixture followed by being cooled down to 40°C before every usage; and the deposition time or the potential cycle numbers were adjusted in order to fill the etched/recessed end pores of the Pt tip electrodes with porous Pt structures completely, which resulted in an inlaid porous disk tip geometry. To extract and remove Triton X-100 from porous structures, the electrodes were stirred in deionized water that was changed with fresh water every 3 h for 4 times.
Electrochemical characterizations
Prior to SECM measurements, all electrodes were electrochemically cleaned by potential cycling between +0.7 V and −0.7 V (vs. Hg/Hg2SO4) in 1 M H2SO4 aqueous solution. Real surface areas (RSAs) of Pt disk, npPt-I, npPt-II, and npPt-III were measured in 1 M H2SO4 solution with CV at a scan rate of 2 mV s−1. The integrated area of a hydrogen desorption region in a given CV result was divided by a conversion factor of Pt (210 μC cm−2).35 For SECM measurements, a Pt disk substrate electrode (76 μm in diameter) was surrounded by heat shrinkable tube (Hanmicable, Busan, Korea) in order to be fixed at the bottom of a SECM cell. The tip electrode was located at a 10-μm distance above the center of the substrate electrode in N2-saturated 10 mM [Ru(NH3)6]Cl3 dissolved in 0.1 M K2SO4 aqueous solution by recording a SECM approach curve. In this process, the tip and substrate potentials were held at −0.9 V and −0.3 V, respectively. After that, collection efficiency test and ORR at this distance were carried out in TG-SC mode. Collection efficiency was obtained before and after measuring ORR by CV in order to confirm that H2O2 was successfully detected during ORR. The tip potential was scanned from −0.3 V to −0.9 V at a scan rate 10 mV s−1 while a substrate potential was held at −0.3 V to re-oxidize [Ru(NH3)6]2+ generated at the tip. ORR was performed in O2-saturated 0.1 M H2SO4 solution by linear sweep voltammetry (LSV) at a scan rate 2 mV s−1 while the substrate potential was constantly held at +0.56 V in order to detect H2O2. The substrate applied potential was chosen as a peak potential of LSV for H2O2 oxidation in 2 mM H2O2 dissolved in 0.1 M H2SO4 at the 76 μm Pt substrate electrode at a scan rate of 2 mV s−1.
Results and Discussion
Characterization of the porosities of electrodeposited Pt films
Each porous Pt film was electrodeposited within a recessed Pt platform (depth of 4.8 ± 0.3 μm, n = 12) formed by electrochemical etching of Pt disk (10 μm in diameter) surrounded with glass insulator sheath. Therefore, the prepared electrodes could have the same projected geometric surface area (GSA) with 10-μm diameter and were used as SECM tip electrodes to study ORR in TG-SC mode.
The TEM images of as-prepared nanoporous Pt structures (npPt-I, npPt-II, and npPt-III) showed the morphological similarity at nanoscopic level that all these npPt films composed of tiny nanoparticles (2–4 nm in diameter) with ca. 2-nm interstices (Figures 1d-1f). On the other hand, npPt-II and npPt-III exhibited to be rough indicating a certain degrees of porosity even at microscopic level while npPt-I was smooth and flat according to the corresponding SEM images (Figures 1a-1c). Particularly, in npPt-II and npPt-III, Pt nanoparticles gathered to make the large clusters among which inter-cluster spaces formed large pores within the npPt film layers. The sizes of these relatively large pores present in npPt-II and npPt-III were estimated based on the SEM image analysis. The pore size distribution (Figure 2) indicated that npPt-III possessed larger pores (67.2 ± 47.7 nm with the most frequent value of 32.79 nm) than npPt-II (13.2 ± 6.8 nm with the most frequent value of 8.3 nm). This implies that various Pt films with different porosities can be synthesized readily by electrodeposition with a simple modification of electroplating solution composition ratios without the need of different types of templates. The regulated different porosities of the Pt films are seemingly attributed to the altered deposition speed in each deposition solution. In fact, for npPt-III deposition, a tiny amount of lead acetate (common seeding material for Pt plating) was added to the npPt-I plating solution. Thus, the Pt deposition was possibly promoted due to the presence of this seeding material, producing the deposited layer with the largest microscale pores. Meanwhile, the deposition solution for npPt-II also contained lead acetate but its Pt precursor concentration was lower than the other two (i.e., 1.5 wt% for npPt-II vs. 5.0 wt% for npPt-I and npPt-III). The intermediate deposition rate is expected at npPt-II because the seeding lead acetate accelerates but the lower Pt precursor concentration impedes the deposition. Accordingly, the intermediate porosity in between npPt-I and npPt-III was obtained at npPt-II, possessing smaller microscale pores than npPt-III in addition to nanoscale pores.
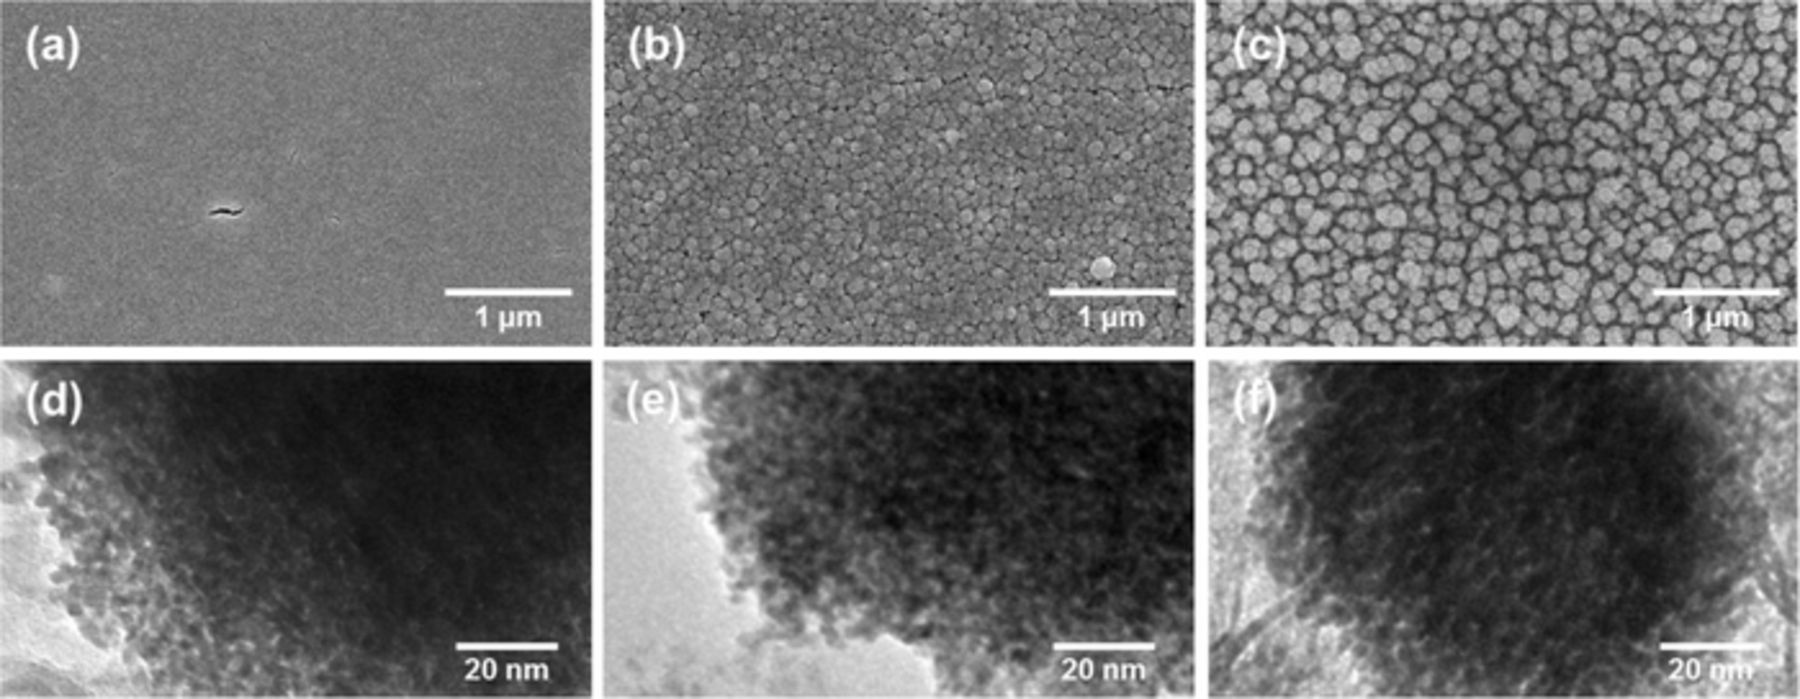
Figure 1. Representative SEM (a, b, c) and TEM (d, e, f) images of npPt-I (a and d), npPt-II (b and e), npPt-III (c and f).
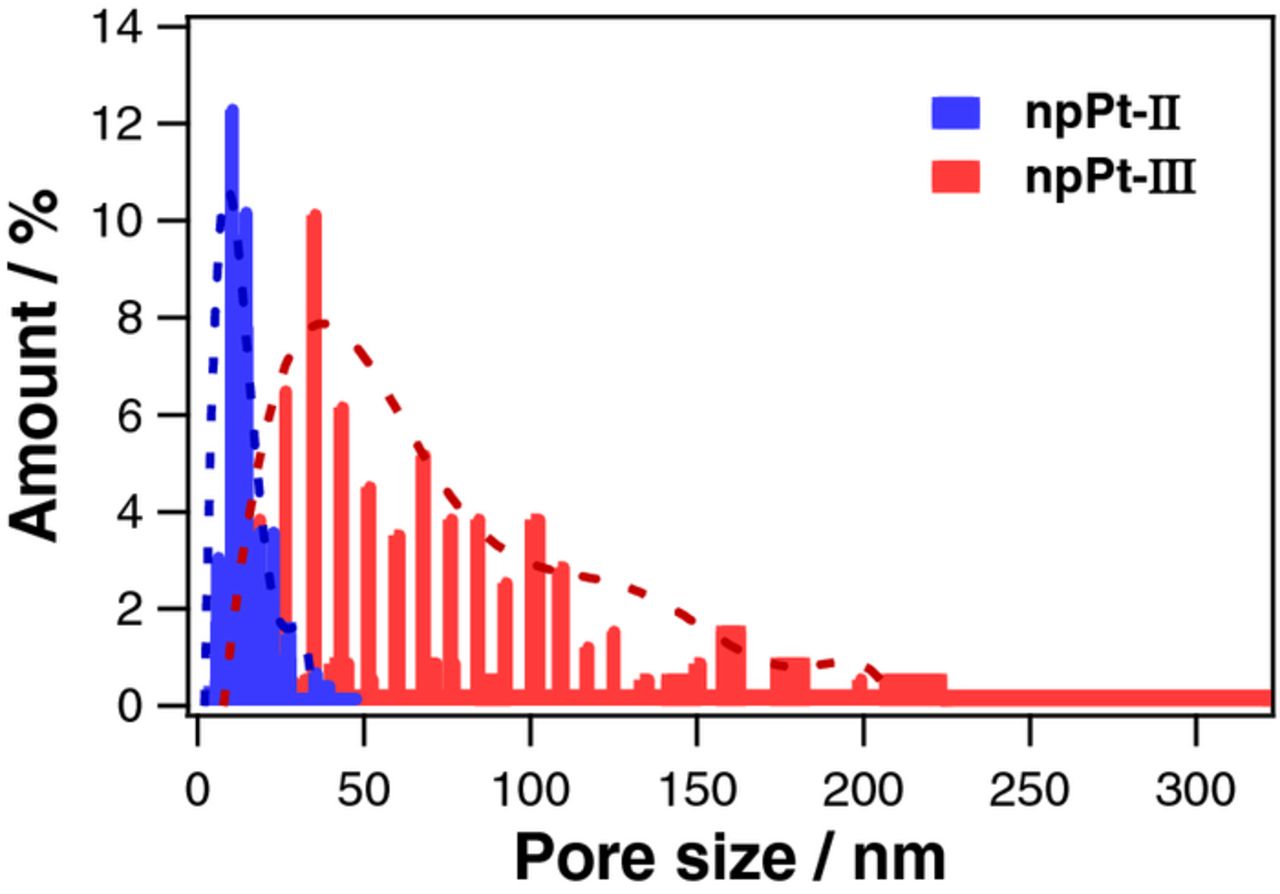
Figure 2. Histograms showing the pore size distributions of npPt-II and npPt-III analyzed from FE-SEM images.
EDS analysis for npPt-II and npPt-III at 20 different sites (Table I) shows that Pb in these porous Pt films was found at only negligible level (≤ 0.1 atomic %) because the concentration of lead acetate in the deposition solutions was very low.
Table I. EDS data obtained for npPt-I, npPt-II, and npPt-III.
| Atomic % | npPt-I | npPt-II | npPt-III |
|---|---|---|---|
| Pt | 100.00 | 99.93 | 99.89 |
| Pb | 0.00 | 0.07 | 0.11 |
Figure 3a presents CV results in 1.0 M H2SO4 solution obtained with the various tip electrodes: Pt disk, npPt-I, npPt-II, and npPt-III. The RSAs of the electrodes were determined from the integrated charge values passed for the hydrogen desorption (appeared between −0.3 V and −0.65 V) on Pt surface using a conversion factor of 210 μC cm−2.35 It was reported that RSAs determined using hydrogen adsorption/desorption were decreased as the potential scan rate increased due to incomplete hydrogen adsorption.36 Thus, a slow scan rate (2 mV s−1) was used to determine RSAs to ensure the complete hydrogen adsorption/desorption on the entire porous Pt surface of the Pt film layers in current study. The estimated RSAs were the largest for npPt-I (71000 ± 6000 μm,2 n = 4), followed by npPt-II (45000 ± 12000 μm,2 n = 4), and then by npPt-III (30000 ± 11000 μm,2 n = 4). Particularly, the differences for npPt-I vs. npPt-II and npPt-I vs. npPt-III were statistically significant (paired t-test, p < 0.05) as shown in Figure 3b. Since the porous films filled the recessed spaces of a similar volume, the smaller interstices among Pt nanoparticles of npPt, the larger RSA it has. In fact, the determined roughness factor (RF = RSA/GSA) showed the same tendency of the RSA order: RFs are 904 ± 76 for npPt-I > 573 ± 152 for npPt-II > 382 ± 140 for npPt-III, n = 4 samples). The RSA of a planar Pt disk electrode was 275 ± 18 μm2 (n = 3) which shows a roughness factor 3.5. This value is slightly larger than a typical roughness factor of polished Pt electrodes, 2–3,37 however, the roughness increases with decreasing radius of electrodes.38
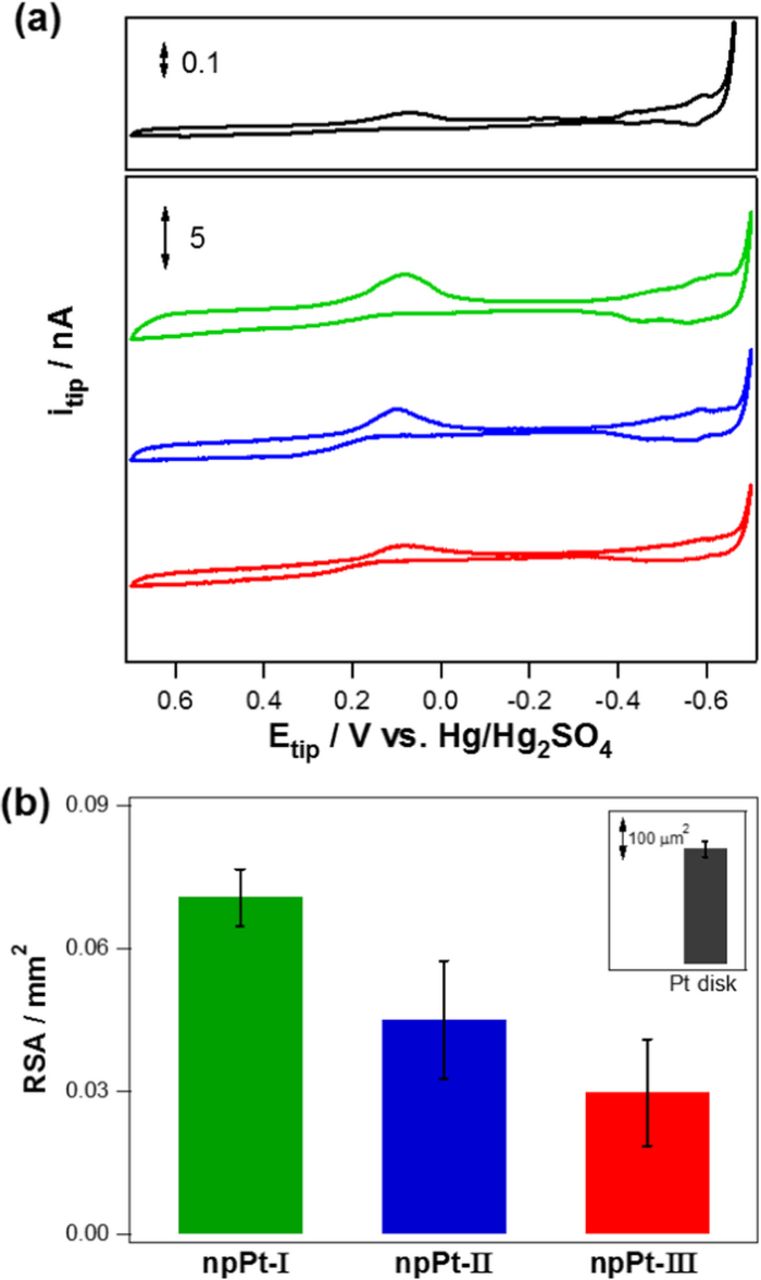
Figure 3. (a) Cyclic voltammograms obtained in N2-saturated 1 M H2SO4 solution with a variety of tip microelectrodes: Pt disk, npPt-I, npPt-II, and npPt-III. Scan rate, 2 mV s−1. All the electrodes have the identical projected geometric area with a diameter of 10 μm. (b) RSA of each electrode calculated by integrating the corresponding H2 desorption peaks in CV curve.
SECM study of ORR at porous Pt films
Collection efficiency of a designed TG-SC mode of SECM experiment was determined using a reversible redox couple, Ru(NH3)62+/3+, at 10 μm of tip to substrate separation that was also used for the SECM study of ORR (vide infra). The applied potential to a tip electrode was scanned from −0.3 to −0.9 V (vs. Hg/Hg2SO4) in an aqueous solution containing 10 mM [Ru(NH3)6]Cl3 and 0.1 M K2SO4, while the substrate potential was fixed at −0.3 V. Nearly 100% of collection efficiency (99.6 ± 0.5%, n = 9) was obtained for three different tip electrodes (npPt-I, II, and III) by comparing the diffusion-controlled steady-state current of Ru(NH3)63+ reduction at the tip and that of the produced Ru(NH3)62+ re-oxidation at the substrate. This confirms that 76-μm diameter substrate is large enough to collect electrochemical product generated from 10-μm diameter tip electrode at their 10-μm separation distance. Collection efficiency experimental results obtained for Pt disk, npPt-I, npPt-II, and npPt-III electrodes are shown in Figure 4, where almost identical CV curves for Ru(NH3)63+/2+ redox reactions were also confirmed for these four different tip electrodes, indicating their GSAs are very similar.
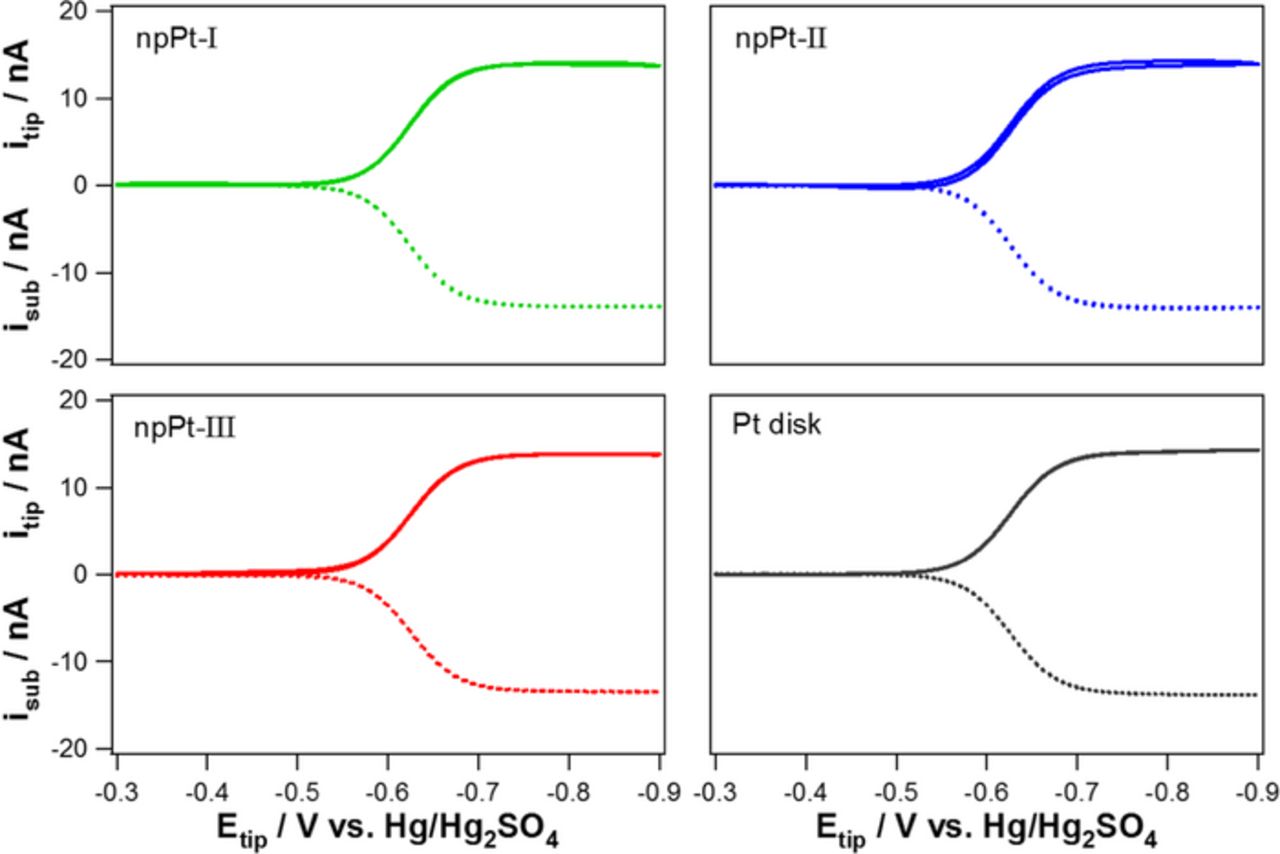
Figure 4. Experimental results of the TG-SC mode of SECM using [Ru(NH3)6]3+ reduction at the tip electrode (solid line) and [Ru(NH3)6]2+ re-oxidation at the substrate electrode (dotted line, Esub = −0.3 V) for the calculation of collection efficiency as a function of tip potential in N2-saturated 10 mM [Ru(NH3)6]Cl3 dissolved in 0.1 M K2SO4. (d = 10 μm).
Voltammetric curves of ORR at four different tip electrodes (bare Pt disk, npPt-I, npPt-II, and npPt-III) were obtained while the substrate electrode potential was fixed to +0.56 V vs. Hg/Hg2SO4 to collect any possible production of H2O2 from the tip electrodes. The potential of +0.56 V applied to the substrate was sufficiently positive to oxidize H2O2 to O2, which was confirmed by LSV curve obtained in a solution containing 2 mM H2O2 and 0.1 M H2SO4. (Figure 5). Most SECM studies on ORR to detect H2O2 have used SG-TC mode rather than TG-SC mode to circumvent possible large capacitive current of large substrate electrode. This possible problem was excluded using relatively small 76 μm substrate electrode as seen in Figure 4.
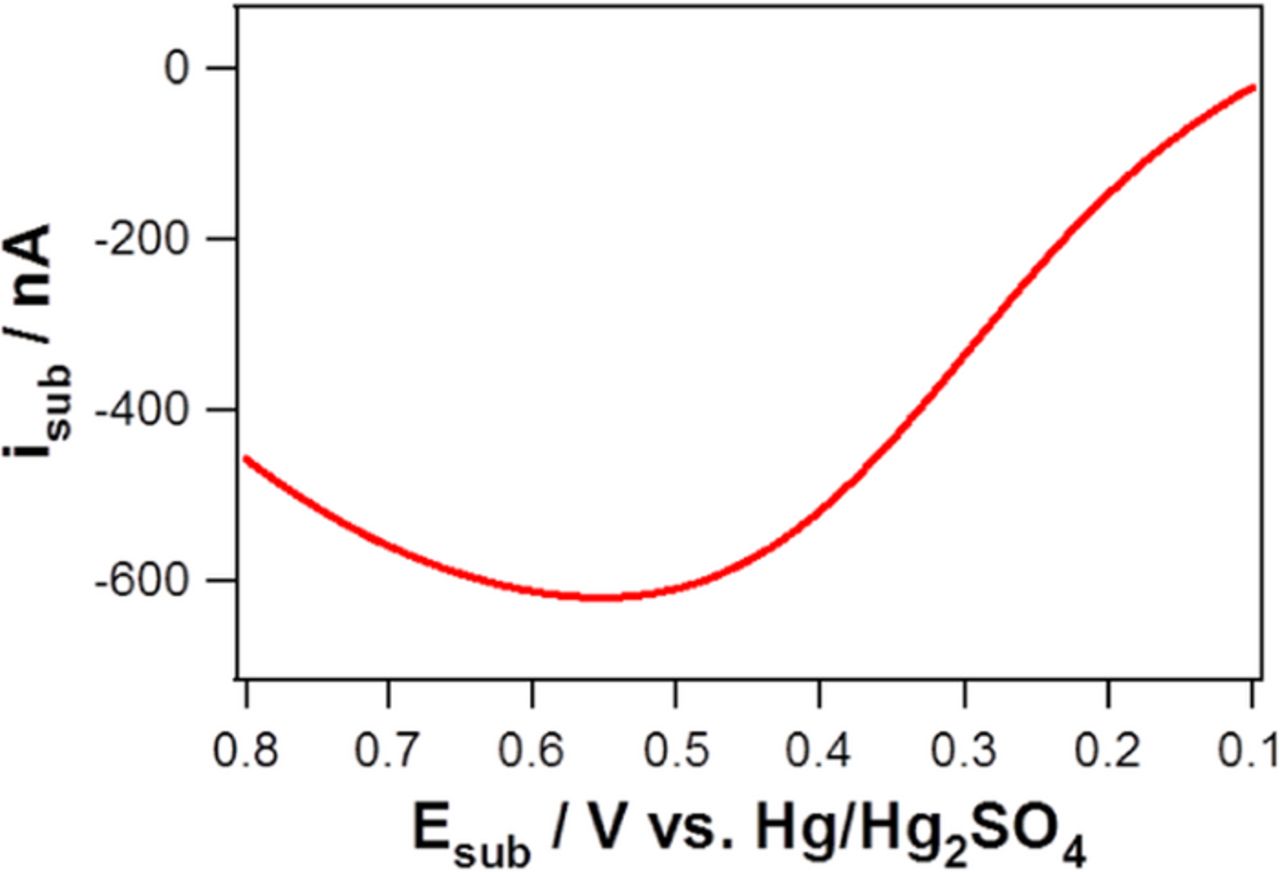
Figure 5. Linear sweep voltammogram for H2O2 oxidation in a solution of 2 mM H2O2/0.1 M H2SO4 at a Pt substrate electrode (76-μm diameter) with a scan rate of 2 mV s−1.
Figure 6 shows the experimental results of ORR obtained with SECM in TG-SC mode. Unlike the collection efficiency experiments carried out with Ru(NH3)62+/3+, ORR current responses varied at different porous Pt tip structures. This implies ORR is a sluggish reaction and a different portion of porous Pt films is utilized at different porous structures deposited within recessed pores of tips. In Figure 6a, the apparent ORR onset potentials were observed to be dependent on the types of tip electrodes. In fact, npPt-I showed the most positive onset potential followed by npPt-II and then by npPt-III while bare Pt disk exhibited the most negative onset potential with a considerable difference from the other three npPts. This observed tendency of the ORR onset potential is possibly attributed to confinement effect.3 In the kinetic-controlled region including onset potential, the residence time of a reactant, O2, at/near the electrode surface is a critical factor governing the ORR efficiency.39 Therefore, nanoscale pores (∼2-nm interstices) of npPt-I provides more chances for capturing O2 near the catalyst surface, resulting in a more positive ORR onset potential. The co-presence of nanoscale- and microscale-pores in npPt-II and npPt-III caused the less positive onset potential by less effective confinement effect. Predicted negligible confinement effect of bare-Pt disk leaded to the highly negative ORR onset potential.
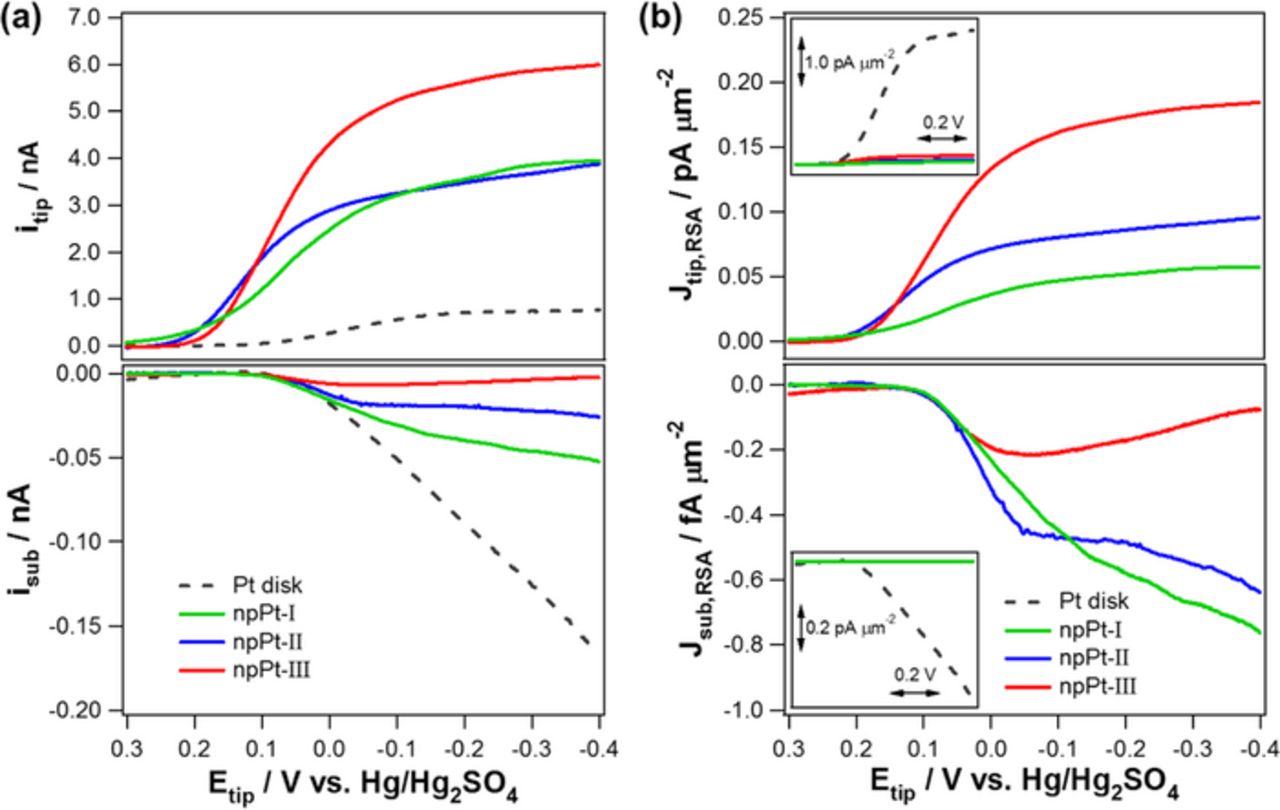
Figure 6. (a) SECM experimental results for ORR in TG-SC mode. The experiments were carried out in an O2-saturated 0.1 M H2SO4 solution with a variety of tip microelectrodes: Pt disk, npPt-I, npPt-II, and npPt-III. The tip potential was scanned from +0.3 V to −0.4 V with a scan rate of 2 mV s−1. Possible production of H2O2 was collected simultaneously at a Pt disk substrate electrode (76-μm diameter) to which +0.56 V vs. Hg/Hg2SO4 was applied. All the tip electrodes have the identical geometric diameter of 10 μm and RG were 6–8. Tip-substrate distance (d), 10 μm. (b) ORR current densities (JRSA) were obtained via the current normalization with respect to the corresponding tip electrode RSA. The insets show the ORR and H2O2 quantification current densities of various tip electrodes including a bare Pt disk (dashed line).
As the applied potentials became more negative from the onset potentials, ORR currents increased and eventually reached to the mass-transfer controlled steady-state levels for all the four different tip electrodes. The magnitudes of ORR limiting currents had the order of npPt-III > npPt-I ∼npPt-II ≫ bare Pt. The greatest ORR current of npPt-III could be explained with two factors: (1) utilization of greater electrode area or deeper section of the recessed tip and (2) higher n value. To understand the effect of electrode area, ORR curves were normalized to RSAs of the corresponding tip electrodes (Figure 6b). The obtained tip current density (Jtip,RSA, ORR current per unit RSA) decreased in the order of npPt-III > npPt-II > npPt-I for the porous Pt series. This implies that the greatest portion of the overall Pt RSA can be utilized at the Pt film possessing both micro- and nano-porosity, that is at npPt-III. In contrast, relatively smaller portion of the overall RSA of npPt-I may participate in electron transfer resulting lower current density with respect to the overall RSA. In particular, npPt-III with larger microscale pores uses its surface more efficiently for ORR, allowing facilitated O2 influx within the film via the microscale-pores (vide infra, Figure 8).
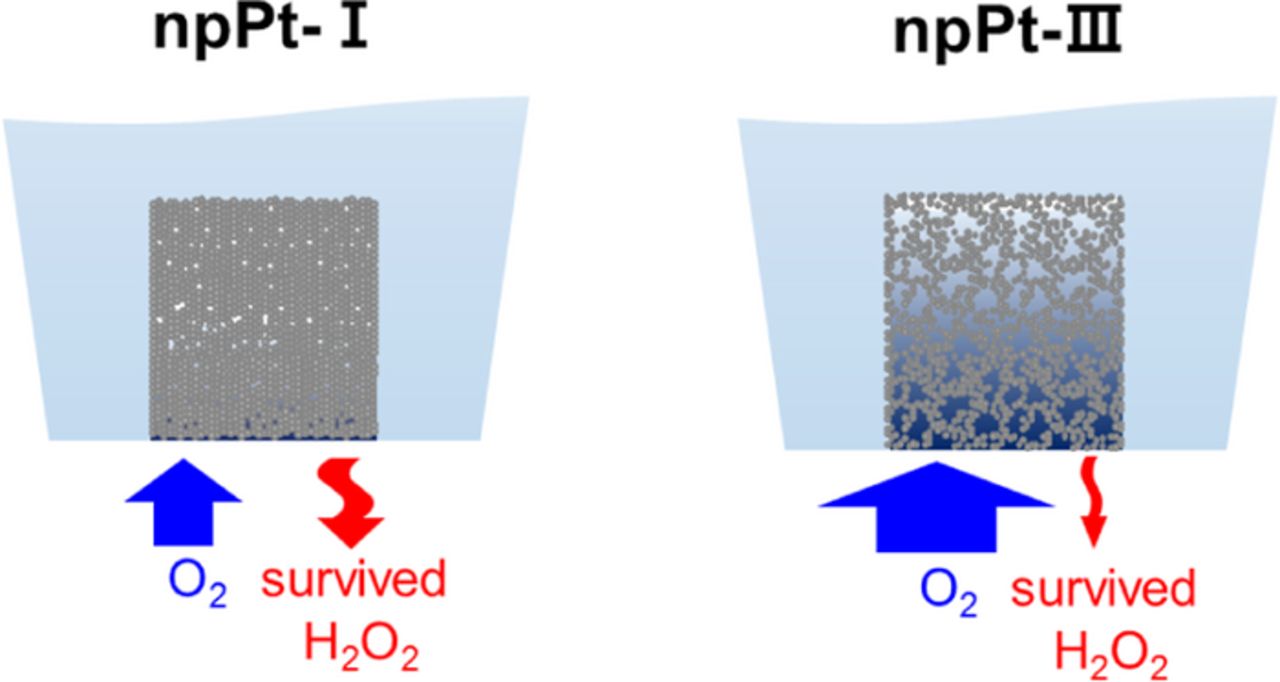
Figure 8. Schematic diagram of O2 influx and H2O2 outflux predicted through small pores (npPt-I) and rather large pores (npPt-III) within porous Pt films. Note that the vertical scale is more elongated compared to the real aspect ratio of a tip electrode for presentation clarity.
The surface area utilized during ORR (i.e. the used depth of the recessed tip) seems to influence the n value (Figure 7). The effect of Pt film porosity on the n values could be interpreted by inspecting the substrate current responding to H2O2 re-oxidation along with the corresponding tip current of Figure 6a. In fact, the n values of the various tip electrodes were calculated using Eq. 3.23
![Equation ([3])](https://content.cld.iop.org/journals/1945-7111/162/10/H792/revision1/jes_162_10_H792eqn3.jpg)
where itip is a tip current, isubs is a substrate current, and CE is a collection efficiency which is 100% in current TG-SC mode.
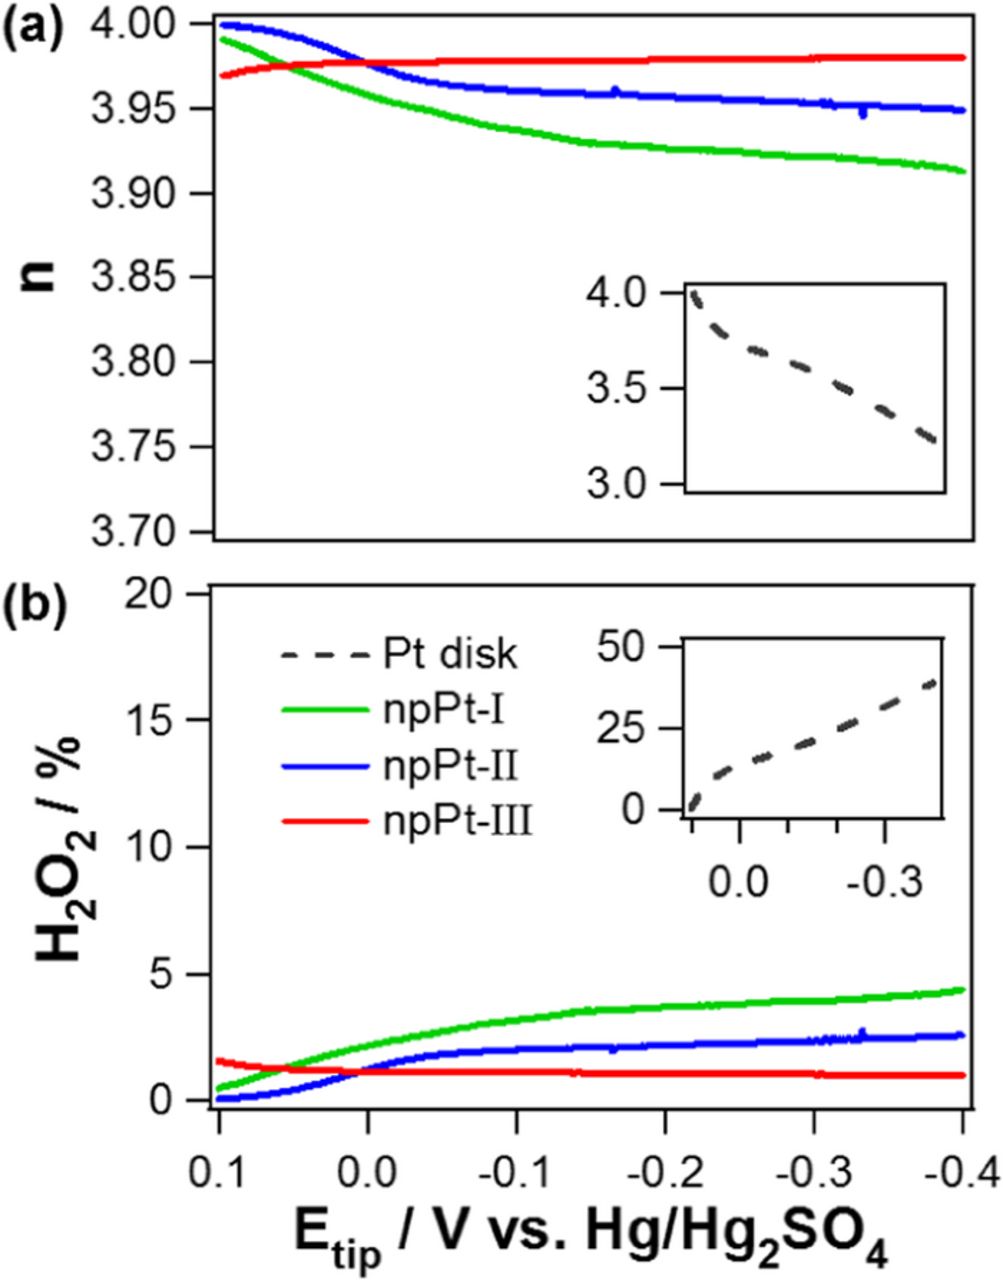
Figure 7. Number of electrons transferred (n) and percentage of H2O2 generated during ORR at various tip electrodes (npPt-I, npPt-II, npPt-III, and Pt disk) with their geometric diameter of 10 μm.
The calculated n values as a function of potential is shown in Figure 7a. A bare Pt micro-disk has significantly low n value, down to ∼3.2 at −0.4 V. This low n value could be ascribed to the fast diffusion rate of generated intermediate H2O2 at a microelectrode as previously reported.40 The n values at the nanoporous Pt series were nearly 4. A closer investigation of the data reveals that n values of npPt-I and npPt-II decrease slightly as the potential becomes more negative while npPt-III maintains high n value, ∼4, quite constantly for the examined potential range. This indicates the most efficient ORR at npPt-III with the smallest generation of 2 e-transfer product, H2O2. The slightly decreased n values of npPt-I and npPt-II in a more negative potential region are possibly ascribed to the following reasons: The influx of ORR reactant, O2, is limited within a rather shallow depth of the Pt films due to the presence of only small pores, and therefore, the 2 e-transfer product can be swept away from the electrode surface prior to further reduction because of too high mass transport rate in this negative potential range (i.e., too much overpotential paid). Further study is, however, required for a better understanding of this observation.
This n value can be evaluated in a different way by counting percentage of generated H2O2 during ORR using the Equation 419 as shown in Figure 7b.
![Equation ([4])](https://content.cld.iop.org/journals/1945-7111/162/10/H792/revision1/jes_162_10_H792eqn4.jpg)
In a good agreement with the results of n value, ORR at bare Pt disk UME generates the largest amount of H2O2. This amount decreases in the order of npPt-I > npPt-II > npPt-III, suggesting the highest ORR activity of npPt-III.
Figure 8 illustrates the predicted mass transport behaviors of O2 and H2O2 for npPt-I and npPt-III. Due to the presence of only small pores, the influx of O2 is restricted through the Pt film and only the shallow Pt layer is utilized for ORR,41 while the generated H2O2 can easily escape from the npPt-I structure. In case of npPt-III, however, larger microscale pores facilitate the influx of O2,5 and the Pt films down to much deeper layers can participate in ORR. In the meantime, the generated H2O2 has a greater chance to be further reduced to water in npPt-III structure, showing higher ORR limiting current, lower H2O2 generation, and greater n value close to 4.42
ORR activity of nanoporous Pt series is summarized as follows. In the kinetic controlled region, the confinement effect is a critical factor for ORR and therefore, npPt-I having only nanoscale pores with the largest RSA shows the most positive apparent onset potential. On the other hand, in the mass-transport controlled region, the actual electrode surface area utilized for ORR (i.e., travel depth of O2 through catalyst film) is important, and therefore npPt-III facilitating O2 influx exhibits the highest ORR limiting current with the smallest generation of 2 e-transfer product.
Conclusions
SECM in TG-SC mode was used to investigate the ORR catalytic activity and mechanism depending on the local porous structures of Pt, the most commonly used ORR catalyst. Porous Pt films with three different degrees of porosities were successfully electrodeposited on recessed pores of Pt disk UME (10-μm diameter) using electroplating solutions containing Pt precursor and surfactant forming reverse micelle template at the different mixing ratios with/without lead acetate. The study of ORR with SECM in TG-SC mode provides ∼100% collection efficiency for the intermediate, H2O2, allowing the more accurate analysis of the ORR mechanism. In fact, npPt-I having only nanoscale pores with the largest RSA is advantageous to confine O2 molecules within the Pt film, exhibiting the most positive ORR onset potential in the kinetic controlled region. In contrast, npPt-III shows the highest limiting current density in the mass-transport controlled region that is leaded by more efficient utilization of the electrode surface for ORR via the facilitated O2 influx through the microscale pores. In addition, the deeper travel depth of O2 through npPt-III was a double-edged advantage, increasing n value (i.e., the lowest production of survived 2-e transfer product H2O2). Conclusively, it is suggested that the fine regulation of pore sizes of nanoporous electrocatalysts is rather important to optimize their electrocatalytic activities than the simple enlargement of the catalytic surface areas.
Acknowledgments
This work was financially supported by the National Research Foundation of Korea (NRF) funded by the Ministry of Science, ICT and Future Planning (2014R1A2A2A05003769 for YL) and (2014R1A2A2A01005479 for CL).