
Abstract
The paper presents a new method of non-linear electrochemical impedance spectroscopy (NLEIS), which allows fast and non-destructive evaluation of the corrosion rate and determination of the Tafel coefficients values for a corrosion system under investigation. This method employs amplitude modulation of the ac perturbation signal. The study demonstrated that it was possible to obtain impedance characteristic as a function of the perturbation signal amplitude based only on a single measurement. The investigations were carried out on carbon steel exposed to 1M KCl solution, which is a model corrosion system with cathodic control. The values of corrosion current and Tafel coefficients values for the corrosion reaction were determined using the dependence between the charge transfer resistance and the amplitude of the perturbation signal.
Export citation and abstract BibTeX RIS
Electrochemical impedance spectroscopy (EIS) is the fundamental technique, which has been used in various electrochemical studies for decades. Its popularity is related to the fact that, among a few other research methods, it allows detection and evaluation of the basic components of a corrosion process, such as charge transfer, reagent transport, adsorption etc., in a single measurement cycle.1–6
Nevertheless, EIS also has some serious limitations. These result from the fact that proper execution of impedance measurement and obtaining of reliable results require maintenance of the stationarity and linearity of the tested object.2–4,6–8 The stationarity issue concerns various corrosion systems exhibiting high dynamics. In this case, rapid changes occur at the electrode and in the space around it. They are connected with changes of composition at the electrode surface or in the neighbouring electrolyte, which is directly reflected in dynamic impedance variations of such system.8–11 A solution to this problem is provided through the application of a multisinusoidal perturbation signal and analysis of time-restricted section of the perturbation and response signals.3,4,12,13 This approach, at the expense of information loss in the low-frequency region, enables time-efficient measurement as well as the monitoring of impedance changes over time or as a function of other independent variable.12,14–16 Recently, this type of impedance measurement has been gaining more and more popularity.
Due to non-linear nature of the electrochemical corrosion phenomena, application of the ac signal to such systems results in polyharmonic response. All components of that response are a function of the perturbation signal amplitude.3,7,17–22 This phenomenon extremely complicates impedance analysis, and thus a procedure based on utilization of a small perturbation signal amplitude is commonly used. Such an amplitude does not exceed a dozen or so millivolts and makes the technique non-destructive for the system under investigation In addition, the investigated electrochemical process can be treated as a linear system. Both aforementioned operations greatly simplify impedance analysis, making the technique easy and common in use, but they also entail loss of the information about the most important parameter – the corrosion current.
Impedance analysis taking into account the influence of the perturbation signal amplitude (non-linear electrochemical impedance spectroscopy – NLEIS) allows determination of inaccessible so far information about a corrosion process including the corrosion rate and Tafel coefficients.1,7,17–21 Unfortunately, such analysis requires implementation of not one but a whole series of impedance measurements, which makes it impossible to maintain the stationarity condition. Moreover, application of too high ac perturbation amplitude can result in irreversible changes of the investigated system. This is the main reason for the marginal utilization of the NLEIS technique.
In this study, the authors present a solution to that problem. Adequate modification of the perturbation signal resulted in a reduction of the time necessary for NLEIS measurement completion. It increases the chance to maintain stationarity condition during the measurement. Moreover, appropriate method of signal analysis allows determination of the corrosion rate based only on a single impedance measurement. The method's principles and potentialities were demonstrated using the example of a simple corrosion system operating under cathodic control.
Description of the Method
The current-voltage characteristics of a corrosion system can be generally described by the following relationship:
![Equation ([1])](https://content.cld.iop.org/journals/1945-7111/166/15/C559/revision1/d0001.gif)
where: I – current, icorr – corrosion current, ΔE = E − Ecorr – polarization (difference of the actual (E) potential and the corrosion potential (Ecorr)),  ,
,  , βa – Tafel slope of the anodic partial process, βc - Tafel slope of the cathodic partial process. Equation 1 is the principle of many electrochemical methods, such as linear polarization resistance and Tafel polarization,1,23,24 impedance spectroscopy3,17 or harmonic analysis.7,19–21,25,26 The impedance characteristics demonstrate how the system behaves upon the ac perturbation signal. The system under investigation can be excited with the ac sinusoidal signal:
![Equation ([2])](https://content.cld.iop.org/journals/1945-7111/166/15/C559/revision1/d0002.gif)
where: ΔE0 – amplitude of ac perturbation, ω – angular frequency, t – time. The response current signal from the corrosion system (ΔI) will take the following form:
![Equation ([3])](https://content.cld.iop.org/journals/1945-7111/166/15/C559/revision1/d0003.gif)
Non-linear nature of corrosion systems results in a polyharmonic response signal containing current components characterized by the frequencies that are multiples of the perturbation signal frequency:7,22,26
![Equation ([4])](https://content.cld.iop.org/journals/1945-7111/166/15/C559/revision1/d0004.gif)
where: ΔIn (n = 0, 1, 2, 3 ...) – current harmonic components. In the case of classical impedance measurement, only the response signal component ΔI1 at the frequency consistent with the perturbation signal frequency is analysed. For the measurement performed at the corrosion potential, the response signal can be represented as the following series expansion:
![Equation ([5])](https://content.cld.iop.org/journals/1945-7111/166/15/C559/revision1/d0005.gif)
The classical method of impedance measurement assumes the linearity of the investigated system. Implementation of this assumption is achieved via a small amplitude application of the perturbation signal. In this case, only the first expression of the above series 5 is taken into account, which leads to the Stearn-Geary equation:23,27
![Equation ([6])](https://content.cld.iop.org/journals/1945-7111/166/15/C559/revision1/d0006.gif)
![Equation ([7])](https://content.cld.iop.org/journals/1945-7111/166/15/C559/revision1/d0007.gif)
where: Rp – the polarization resistance
It should be emphasized that this type of impedance measurement, based on the assumption of system's linearity, allows only to presume how dynamics of the process looks like because it does not directly provide any numerical values. The charge transfer resistance obtained as a result of impedance spectrum analysis is a function of three unknowns – Tafel coefficients βa, and βc and the corrosion current. Obtaining the corrosion current requires knowledge of ba and bc values, which is associated with the execution of an additional destructive measurement, namely Tafel polarization.
An obvious solution to this problem is application of higher perturbation amplitude and to include system's non-linearity in the analysis. Hence, the current response signal ΔI1 should be analysed taking into account the subsequent components of the Equation 5. In this approach, the charge transfer resistance can be expressed as:
![Equation ([8])](https://content.cld.iop.org/journals/1945-7111/166/15/C559/revision1/d0008.gif)
where: Rct – the charge transfer resistance
It is evident that value of the charge transfer resistance is a function of the perturbation signal amplitude (Rct)− 1 = f(ΔE0) and that including at least the first three components of the series provides full information about the corrosion process, without any additional measurements.
The above considerations concern the system where the anodic and cathodic processes are under activation control. Such a situation occurs for rapid phenomena, such as corrosion in acids. In aqueous electrolytes, in majority of cases the electrochemical corrosion rate depends on the cathodic reaction of oxygen reduction. The limited solubility and diffusion rate of this gas in aqueous electrolytes result in oxygen concentration gradient between the electrode surface and the bulk of solution. Consequently, the corrosion rate is much lower than in the case of the activation-controlled corrosion systems. Taking into account activation character of the anodic reaction and mixed character of the cathodic one, the Equation 1 can be presented in the following form:28–30
![Equation ([9])](https://content.cld.iop.org/journals/1945-7111/166/15/C559/revision1/d0009.gif)
where CS0 is the initial concentration of oxygen and  corresponds to the oxygen concentration at the corrosion potential. Based on the Nernst diffusion layer theory,31 the concentration components in the above equation can be eliminated by implementation of the diffusion limited current for cathodic reaction (il):
![Equation ([10])](https://content.cld.iop.org/journals/1945-7111/166/15/C559/revision1/d0010.gif)
Equation 10 can be simplified to the dependence illustrated by the Equation 1, if the diffusion limited current is higher than the corrosion current. However, when the diffusion limited current and the corrosion current are equal then a popular, simplified form of the equation is achieved, which represents the corrosion system with cathodic diffusion control:1,18–20,26
![Equation ([11])](https://content.cld.iop.org/journals/1945-7111/166/15/C559/revision1/d0011.gif)
In this case the charge transfer resistance will depend exclusively on the corrosion current, anodic Tafel coefficient and amplitude of the ac perturbation signal:
![Equation ([12])](https://content.cld.iop.org/journals/1945-7111/166/15/C559/revision1/d0012.gif)
Impedance measurement carried out by the classical frequency response analysis (FRA) method is based on perturbation of the investigated system with the signals of a given and constant value of amplitude and frequency applied in sequence (Eq. 2). The impedance values are obtained by appropriate correlation of the perturbation signal and phase-shifted response signal.2–4,6,17 In this case, analysis of the amplitude influence on the charge transfer resistance is an extremely time-consuming process, which requires execution of many impedance measurements at different perturbation signal amplitudes.4,6,32–34 Accordingly, the stationarity condition is practically impossible to achieve.
An approach based on perturbation of the investigated system with the signal schematically presented in Figure 1 can be an alternative, which allows acquisition of the amplitude-dependent impedance characteristic based only on a single measurement. It provides shortening of the measurement time and thus offers the possibility to investigate a wide range of electrochemical systems, preserving the stationarity requirement.
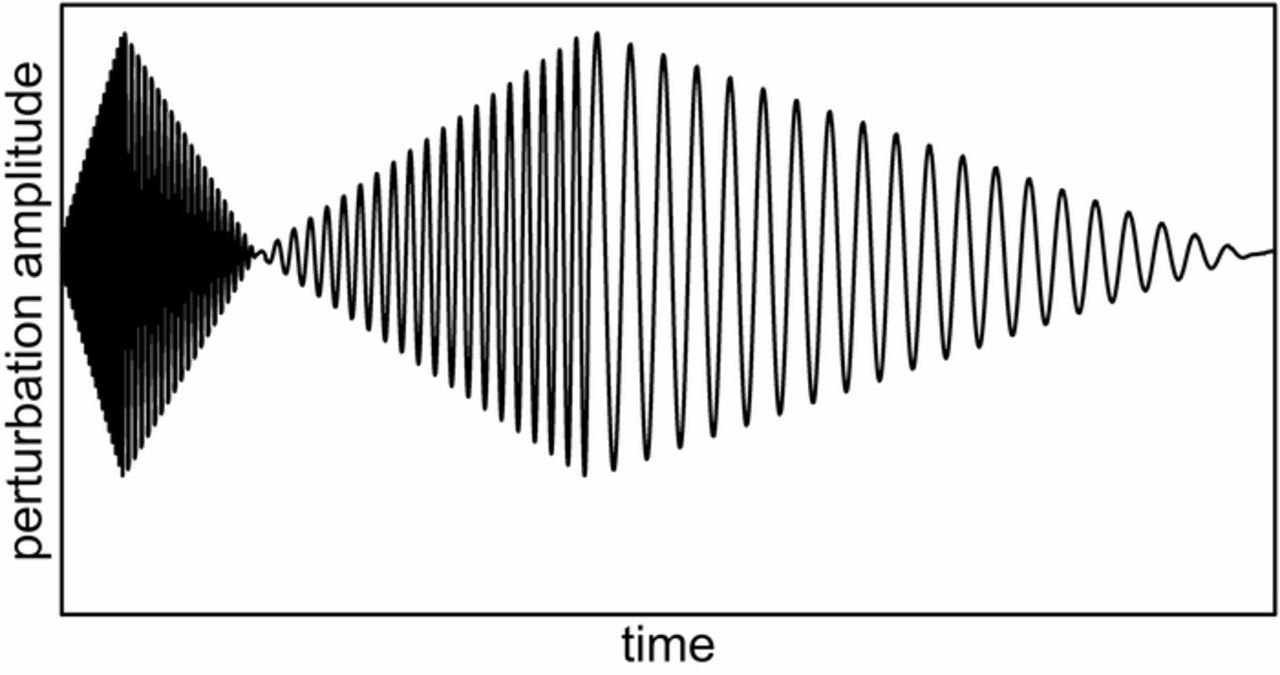
Figure 1. Scheme of the perturbation signal used in presented approach to non-linear impedance measurement.
In the case illustrated in Figure 1, the expression describing the single frequency component of the perturbation signal takes the following form:
![Equation ([13])](https://content.cld.iop.org/journals/1945-7111/166/15/C559/revision1/d0013.gif)
where E0 is the minimum value of the perturbation signal amplitude, Ef is the maximum value of the perturbation signal amplitude, Tn is the total duration of perturbation using the single frequency component and ωn is the angular frequency of the single frequency component. Additionally, successive components are characterized by an opposite direction of amplitude change in order to minimize the chronoamperometric effect at the point of frequency switch.
Obtaining dependence between the impedance and ac perturbation signal amplitude requires appropriate analysis of the voltage and current waveforms. As the perturbation signal amplitude is defined in time domain (Eq. 13), the best solution is to use an appropriate short-time Fourier transform. The highest accuracy of results can be obtained by utilizing the transform with a rectangular window, the size of which is a multiple of the period of the analysed signal. This operation is schematically shown in Figure 2.
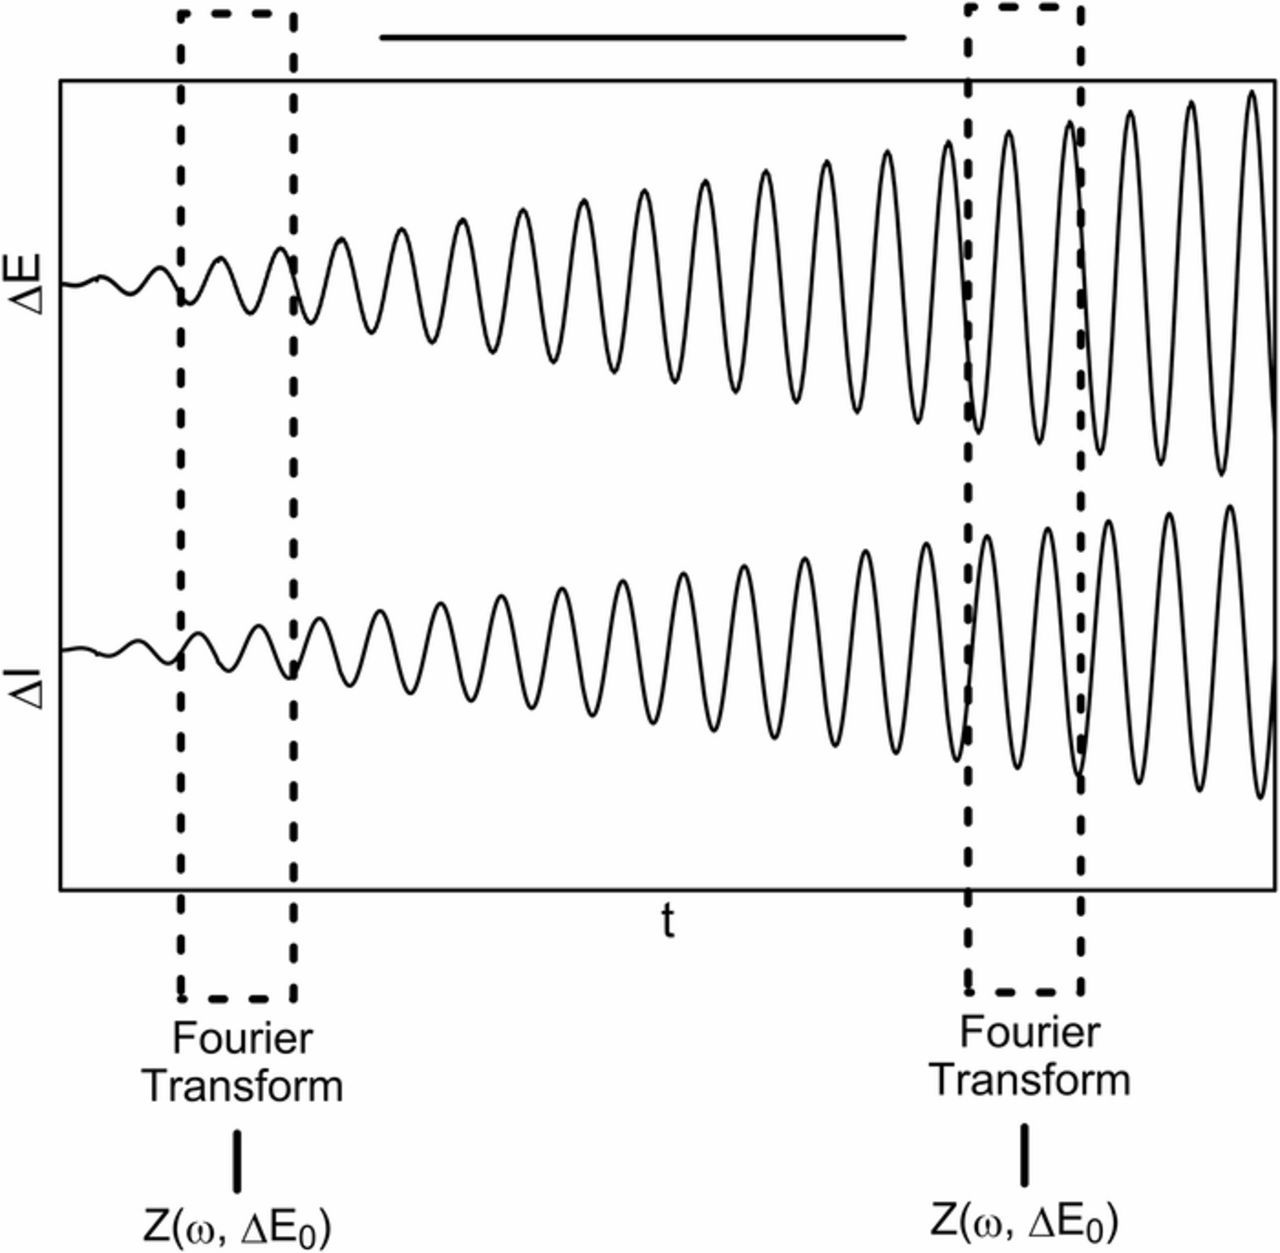
Figure 2. Proposed approach toward the analysis of voltage and current waveforms.
The fragments of the perturbation and response signals are cut out from the voltage and current waveforms and then subjected to the Fourier transform. This allows obtaining of the impedance for each given magnitude of the perturbation signal amplitude. Repetition of that operation in subsequent time locations provides a set of impedance values for different perturbation amplitudes. Amplitude resolution of obtained results (ΔER) depends on applied amplitude range (Ef-E0), generated frequency ω, its duration time T and the number of signal periods n subjected to local Fourier transform:
![Equation ([14])](https://content.cld.iop.org/journals/1945-7111/166/15/C559/revision1/d0014.gif)
Equation 14 shows that these parameters are closely interrelated. The shortening of signal duration time or application of a lower frequency perturbation signal will result in deterioration of the amplitude resolution of results. Moreover, it will also have negative impact on obtained results due to increasing non-stationarity of the signal inside the fragment subjected to Fourier transform. In order to avoid these negative effects, it is necessary to provide as high ΔER resolution as possible.
Experimental
Potential of the new method were demonstrated on the example of a corrosion system under cathodic control. It consisted of a carbon steel electrode in 1M KCl solution. This system is frequently selected for presentation and verification of new measurement techniques.18,22 Slow changes occurring within the examined corrosion system made it possible to eliminate the non-stationarity issue and to compare the new method with classical EIS and polarization measurements.
The investigations were carried out on carbon steel in the form of a disk with the surface area of 0.5cm2. The sample was immobilized in epoxy resin. The composition of the steel was indicated using the Brukner's S1 Titan XRF analyser and it is shown in Table I. Before measurements, the surface was wet ground using a set of silicon carbide abrasive papers with gradation up to 2500 grit, washed with deionized water and acetone and placed in an electrochemical cell. The 1M KCl solution was used as an electrolyte. Electrochemical measurements were made after 24h of exposure in the electrolyte at 30°C using a three-electrode arrangement with a saturated calomel electrode as the reference electrode and platinized titanium mesh as the auxiliary electrode.
Table I. Composition of the carbon steel.
| Element | Composition |
|---|---|
| Fe | 99.29% |
| Mn | 0.49% |
| Ni | 0.07% |
| Cu | 0.06% |
| Cr | 0.02% |
The first measurements were performed using the new NLEIS method. Potentiostatic control was maintained via the Autolab PGSTAT302N. The ac perturbation signal was composed of a sequence of sine waves with the frequencies in the range from 10 Hz to 10 mHz. Each sine wave consisted of 20 full periods. The amplitude of each frequency component increased linearly in order to reach 130 mV at the end of the last sine period. The analysis was carried out on the fragments containing a single period of the perturbation signal. The total perturbation time equalled 63 minutes. Generation of the perturbation signal and acquisition of both current and voltage waveforms were carried out using the National Instruments PCI4461 measurement card. Control and analysis were performed by dedicated software written in the LabView environment. Immediately after these measurements, classical non-linear impedance examinations were conducted with the Gamry Reference 600. Impedance spectra were recorded in the frequency range from 10 Hz to 10 mHz, for 6 amplitudes of the perturbation from 7mV - 130mV range. Each of these 6 classical measurements lasted 12.5 minutes. Finally, the linear polarization test (Tafel polarization) was carried out in the range of ±250 mV and for the potential scan rate of 1 mV/s. The spectra were analysed with the ZSimpWin software. Fitting of the data to suitable functions and the process of measurement errors determination involved the MATLAB software.
Results and Discussion
Corrosion of steel in a neutral salt solution is a typical example of a reaction, the rate of which is determined by the cathodic process of oxygen reduction.32,35,36 The nature of anodic and cathodic processes is shown on the Tafel polarization curve (Fig. 3).
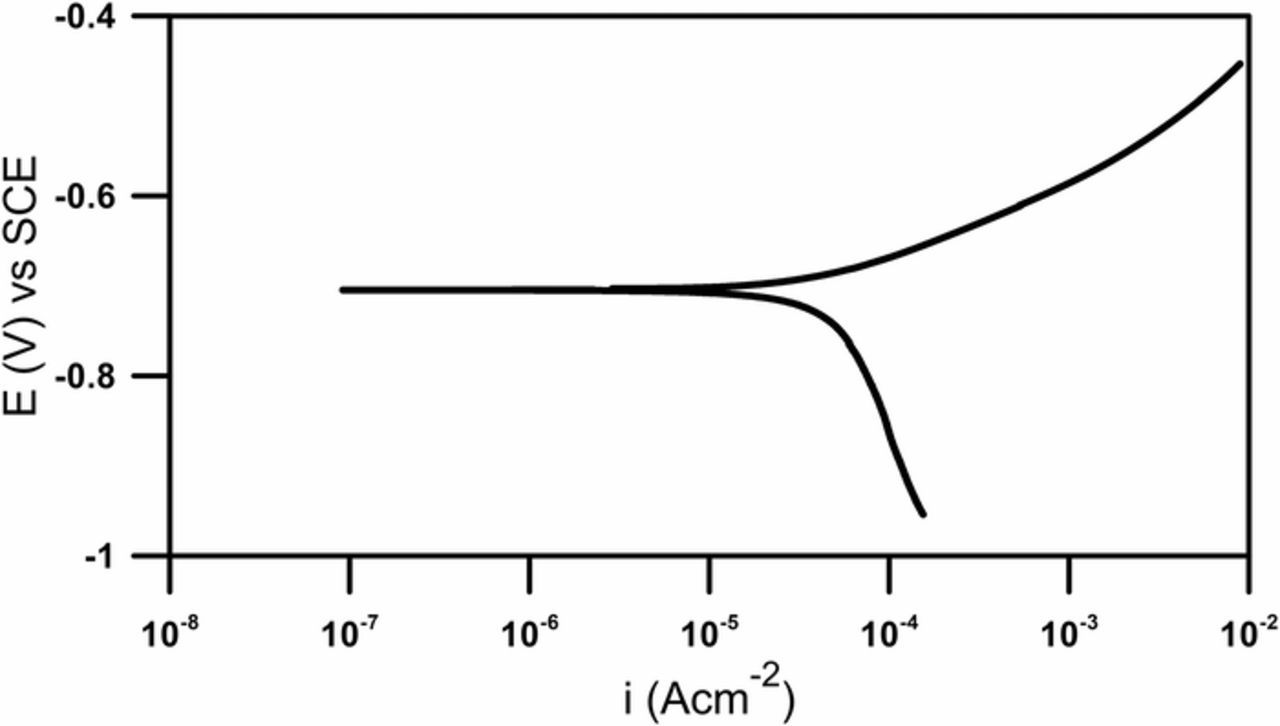
Figure 3. Polarization curve in Tafel range obtained for the investigated corrosion system.
The cathodic part exhibits a very steep slope resulting from the slow, corrosion rate-controlling the reduction process. The anodic part is characterized by a low slope corresponding to undisturbed iron oxidation. Deep anodic polarization is required to obtain the values of the corrosion current as well as the βa and βc coefficients. Such polarization causes irreversible changes in the system under investigation. Utilization of the ac perturbation signal with gradually increasing amplitude makes it possible to avoid irreversible changes on the electrode, provided that the final amplitude is not too high. In the analysed case, after execution of the impedance experiment there were no signs, such as corrosion potential drift, which would suggest significant changes on the electrode. Moreover, employed ac perturbation signal enables the acquisition of impedance characteristics versus changing potential.
Figure 4 shows selected impedance spectra obtained with the new method. The spectra are a result of perturbation with an amplitude-modulated voltage signal and analysis of current response for the fundamental frequency.
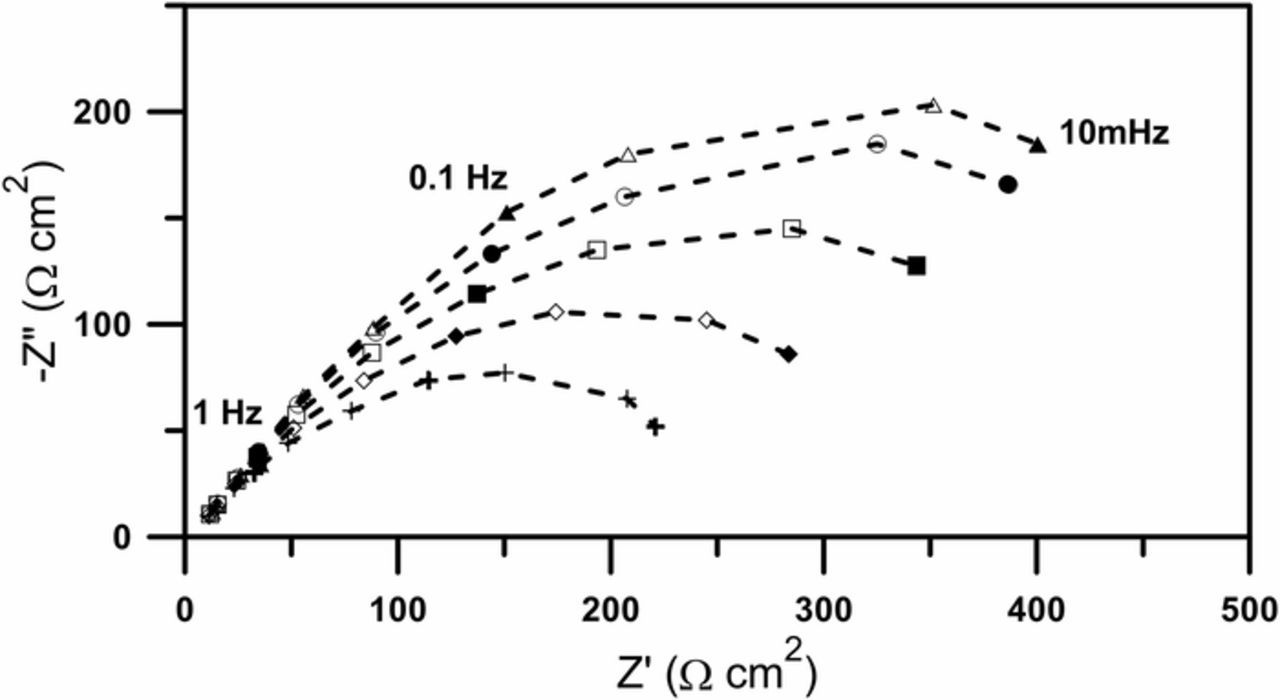
Figure 4. Selected impedance spectra obtained using the amplitude-modulated perturbation signal, recorded as a function of the perturbation amplitude. Amplitudes: (+) 120mV, (◊) 92mV, (□) 65mV, (◯) 38mV, (Δ) 10mV.
Each individual spectrum plotted in the Nyquist projection has the shape of a depressed semi-circle, the size of which decreases with increasing amplitude, therefore the spectra can be analysed using the simple equivalent circuit R(QR), where the constant phase element is connected in parallel with the charge transfer resistance. Fitting results are illustrated in Fig. 5.
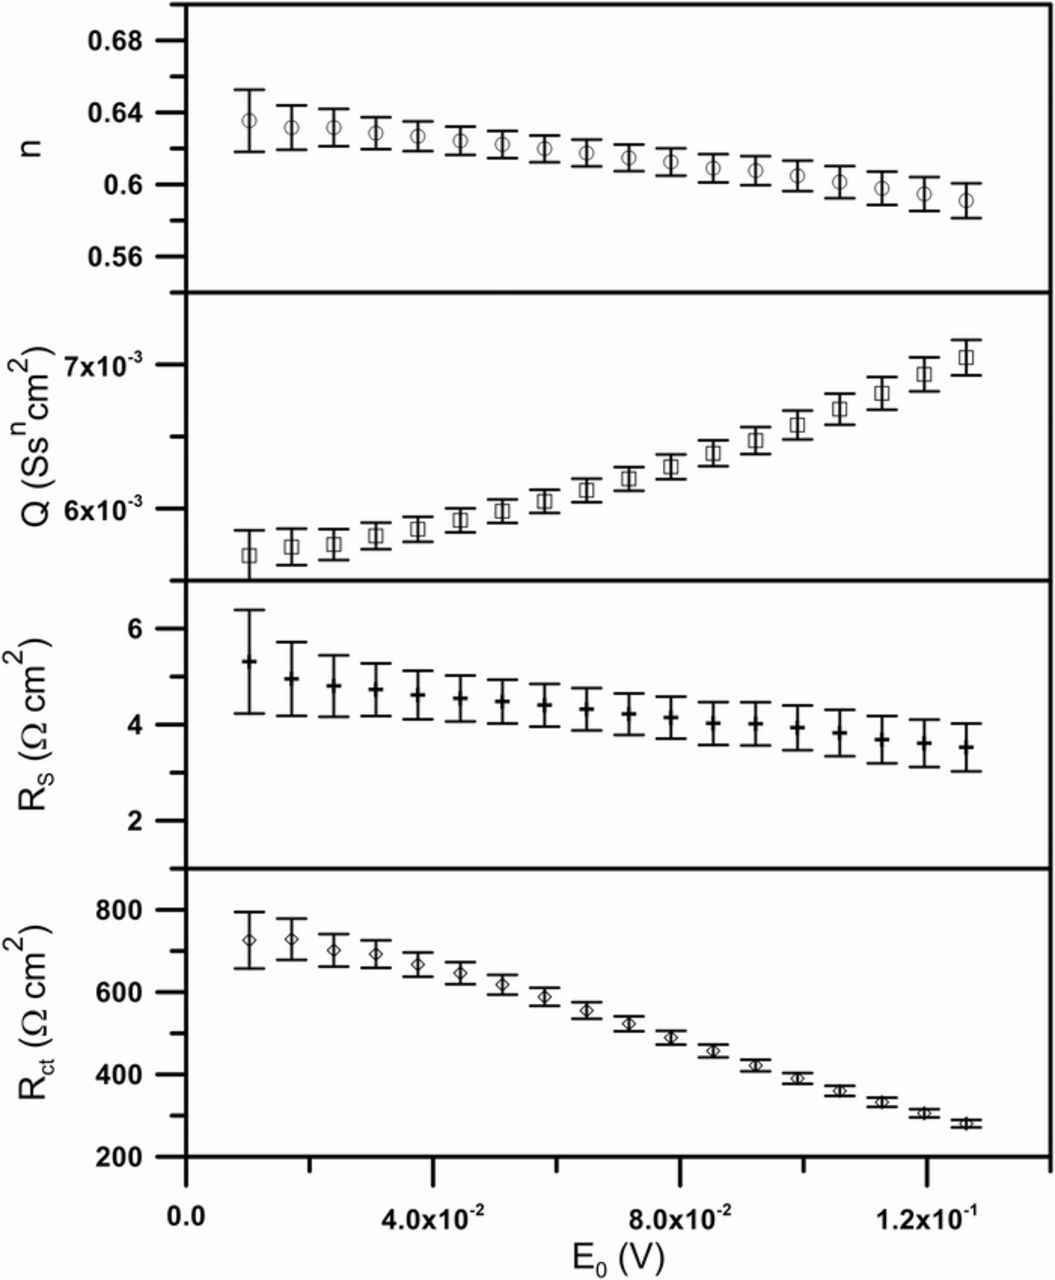
Figure 5. Fitting results of the electrical parameters.
A dependence between values of obtained parameters and magnitude of perturbation amplitude is evident. It is especially pronounced for charge transfer resistance and constant phase element. Small value of the electrolyte resistance (less than 10 Ω) resulted from the fact that the amplitude of a given ac perturbation signal can be considered as the effective value of perturbation, and thus there is no need to introduce correction related to a voltage drop on ohmic resistance.20,26,37
Fig. 6 shows changes of Rct−1 with square of instantaneous perturbation amplitude E2 obtained with the new method as well as with classical NLEIS measurements for different amplitudes.
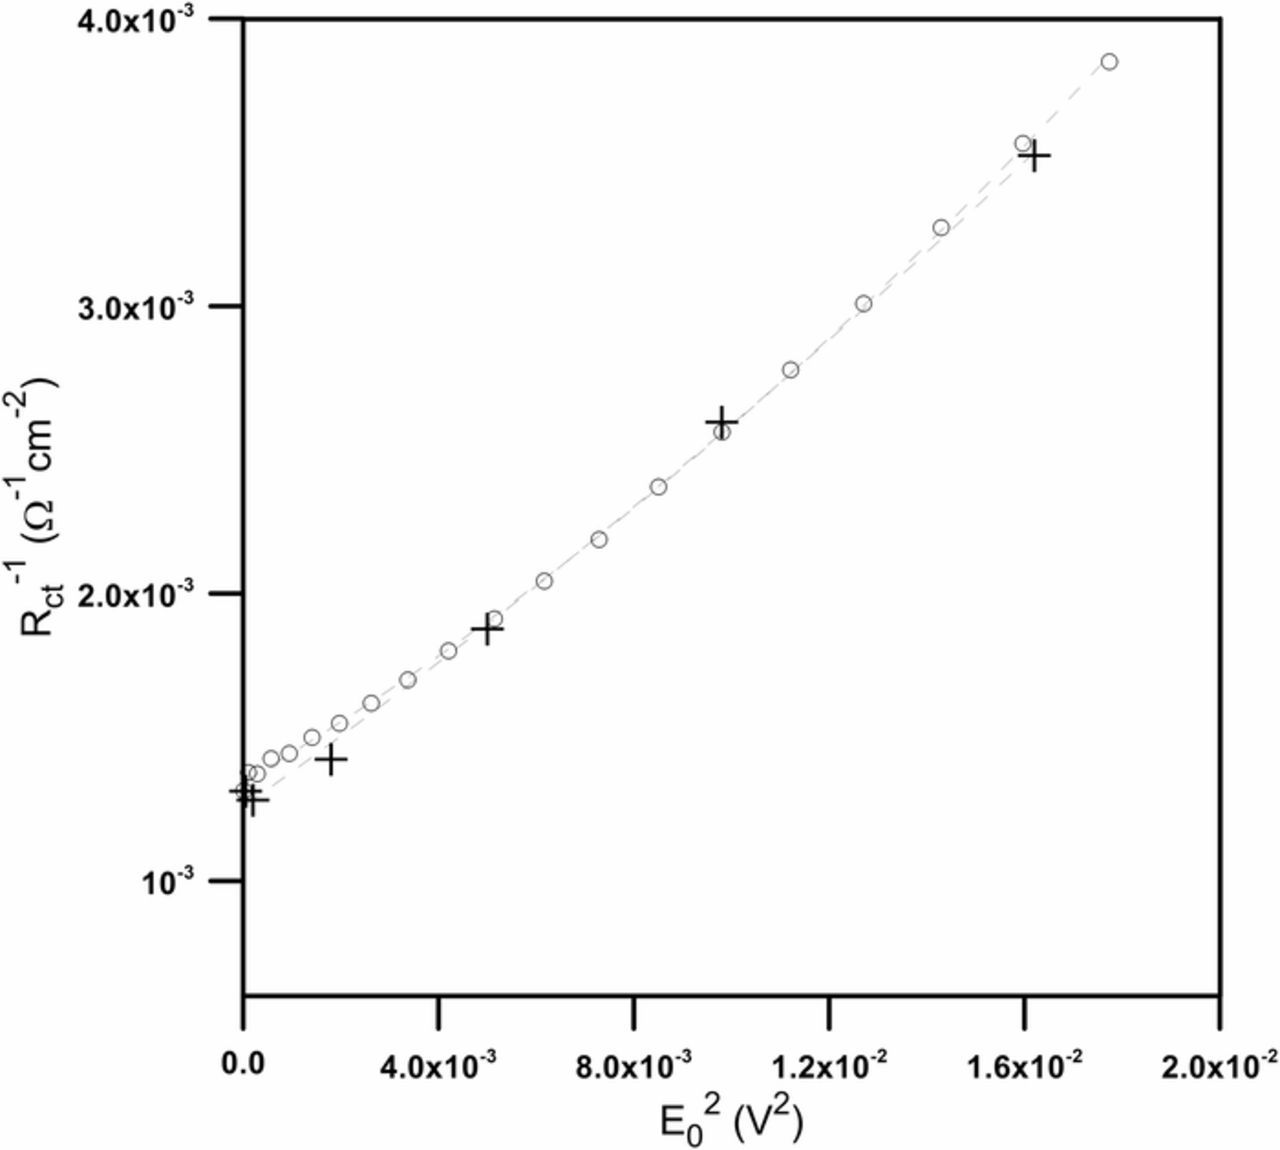
Figure 6. Calculated change of inverse of the charge transfer resistance as a function of the square of the ac perturbation signal amplitude: (○) – new method, (+) – classical NLEIS.
The values obtained with the proposed method form continuous, almost linear course. As far as the classical NLEIS results are concerned, it is difficult to determine the character of the changes due to the limited number of data points acquired. Assuming that obtained results obey the first three components of the Equation 8, a fitting of the second degree polynomial was performed in order to extract corrosion current and Tafel coefficients (Table II). In the case of the classical NLEIS, the fitting results did not belong to the real numbers set so they were not presented in the table. For the new method, the error of Bc is almost three times bigger than the value of the parameter itself. The problems encountered with the model assuming mixed control of the reaction, almost linear changes depicted in Figure 6 and the diffusion character of the cathodic reaction suggested a linear function fitting based on the first two components of the Equation 12 (Table II). The fitting was limited to the values for low magnitude of the ac perturbation signal, not exceeding 50 mV.
Table II. Extrapolated corrosion rates and Tafel slopes.
| Method | icorr (μA cm−2) | βa (mV) | βc (V) |
|---|---|---|---|
| Tafel extrapolation | 48.20 ± 0.32 | 93.01 ± 0.01 | 0.51 ± 0.02 |
| NLEIS (new method) mixed control | 53.12 ± 6.00 | 93.73 ± 2.92 | 2.46 ± 6.70 |
| NLEIS (new method) diffusion control | 53.76 ± 1.74 | 91.70 ± 2.49 | ∞ |
| NLEIS (classical) diffusion control | 46.20 ± 3.98 | 84.11 ± 5.34 | ∞ |
The corrosion current values obtained with the different techniques were similar. The Tafel coefficients of the anodic process were also in good agreement. Such a situation concerns the results acquired for both activation as well as diffusion control assumptions. Discrepancies occured only for the cathodic Tafel coefficient. However, its value was so high, as compared to the anodic coefficient, that it did not significantly influence on the corrosion current magnitude.
Impedance analysis allowed acquisition of changes not only of the charge transfer resistance but also of the double layer capacitance versus the amplitude of the perturbation signal. By applying the surface distribution model proposed by Hirschorn et al.,38 it was possible to calculate the effective double-layer capacitance (Fig. 7).
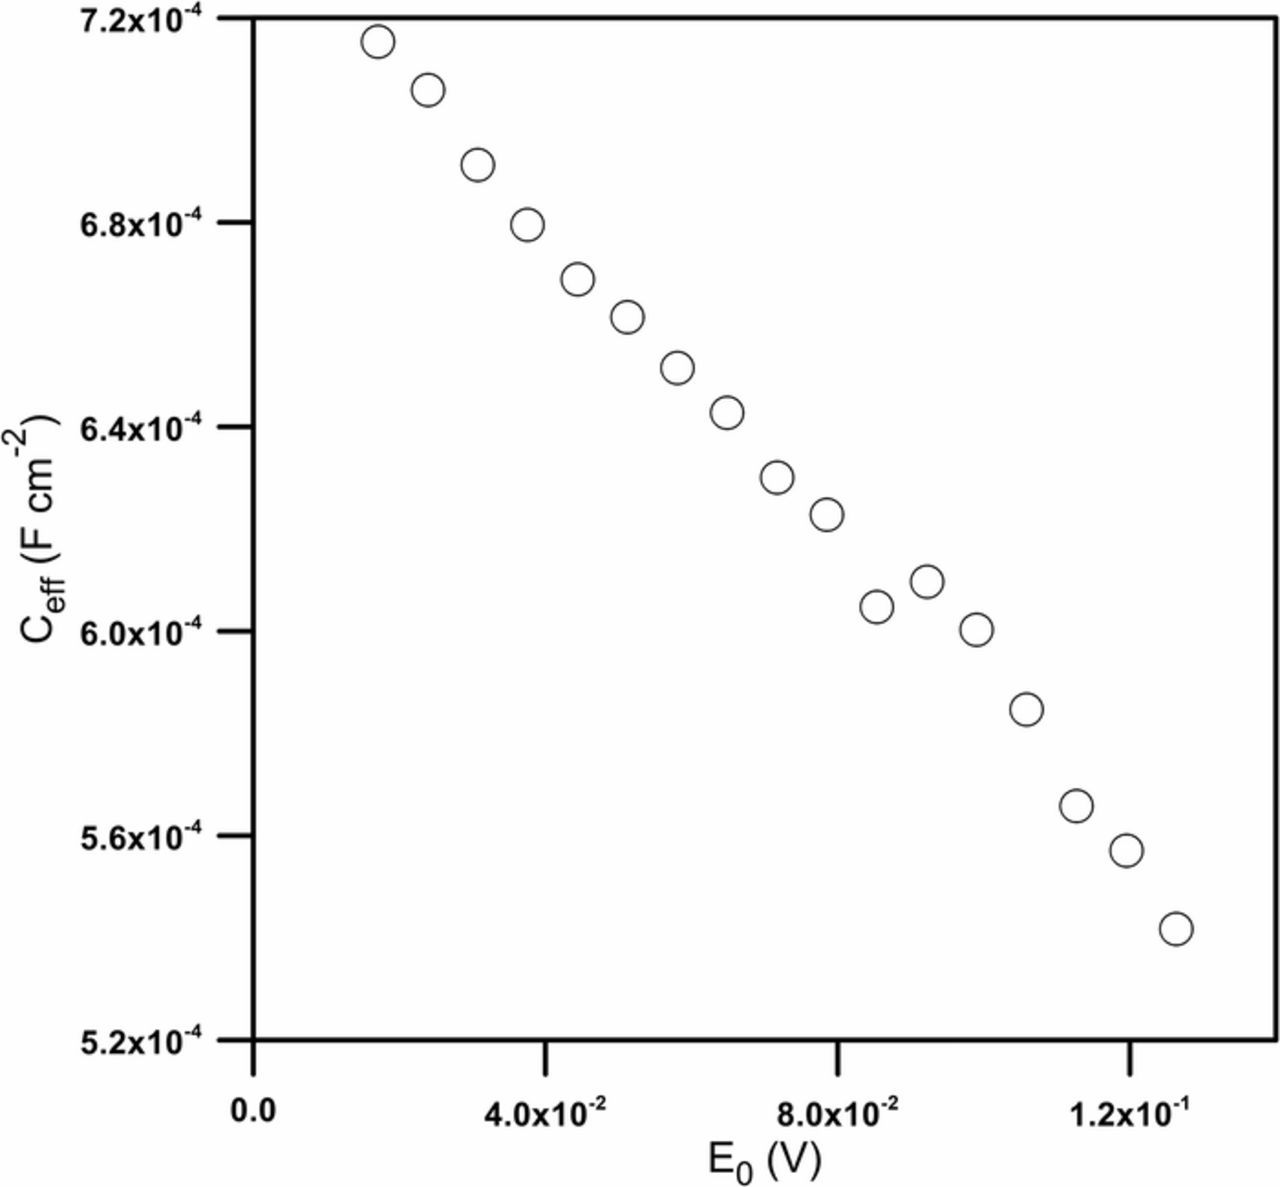
Figure 7. Changes of the effective double-layer capacitance (Ceff) as a function of the perturbation signal amplitude.
A strong decrease in capacitance with an increase in the amplitude can be noticed. Such changes are the evidence of the significant influence of the ac perturbation signal employed in impedance measurements on the double electrical layer capacitance of the investigated electrode surface.
Conclusions
Although EIS is a very useful tool in corrosion measurements, unfortunately, the results are unequivocally influenced by the perturbation signal amplitude. This influence concerns charge transfer resistance as well as double layer capacitance. A solution to the problem is the application of NLEIS. Moreover, this variant of the impedance spectroscopy technique enables the determination of the corrosion current and Tafel coefficients based exclusively on ac measurements. Utilization of only the ac perturbation signal makes the proposed approach non-destructive, as opposed to the classical polarization method.
The classical NLEIS problem of time-consuming measurement repetitions in the determination of dependence between impedance and perturbation signal amplitude has been shown as a reason for the marginal interest in NLEIS. However, this problem could be overcome by implementation of a method using amplitude modulation. Such an approach provides the basic parameters characterising the corrosion process in a single, relatively short measurement run. Based on the results obtained for carbon steel in 1 M KCl solution, it was proven that with corrosion systems strongly influenced by depolariser diffusion, it was possible to apply small amplitude changes, not exceeding 50 mV, in order to obtain the corrosion current and anodic Tafel coefficients.
ORCID
P. Slepski 0000-0001-7856-3098
M. Szocinski 0000-0002-7988-5037
J. Majcherczak 0000-0003-1431-3596
H. Gerengi 0000-0002-9663-4264
K. Darowicki 0000-0002-5457-5008