
Abstract
To elucidate the deterioration mechanism of valve regulated lead-acid battery (VRLA) under high-rate partial-state-of-charge (HRPSoC) duty, the cyclic performance and the direct-current internal resistance (DCIR) of VRLA with addition of a granular carbon additive, (Vulcan 72, VC 72) in the negative active materials (NAMs) are investigated specifically. The DCIR during the whole charging process rises linearly up to a threshold value due to consecutive formation of lead sulfate. According to Percolation theory, the relationship between compositions of negative plates and charging DCIR is clarified. The charging DCIR behaviors are changed via addition of VC 72. Granular carbon particles in nanometer size distribute uniformly in the NAMs, and the reduction of Pb2+ ions to Pb is directly found to occur on the surfaces of both metallic lead and carbon particles. Granular carbon particles provide more active sites for the electrodeposition and nucleation of PbSO4 during the discharging process, while in the charging process, those carbon particles provide conductive pathways for electrons exchange between insulating PbSO4. The modified microstructure of the NAMs suppresses the generation of irreversible lead sulfate and delays the rapid growth of the charging DCIR under HRPSoC duty, therefore extending the service life by 3 times.
Export citation and abstract BibTeX RIS
Lead-acid batteries (LABs) are one of the most widely used secondary batteries because of raw materials accessibility, low cost, and maturity of recycling infrastructure.1 During discharge, both the positive plate (PbO2) and the negative plate (metallic Pb) are converted into lead sulfate (PbSO4).2 Valve regulated lead-acid (VRLA) batteries are modified versions of the LABs with improved storage time and reduced maintaining requirements. In typical applications such as SLI (starting, lighting, ignition) battery, telecommunication, standby battery and electric bicycle, LABs usually suffer from grid corrosion and crumbling of positive active materials (PAMs).3
Recently, VRLA batteries are being used as motive power batteries in hybrid electric vehicles (HEVs). However, this application is impeded by the shortcomings of low energy density and relatively short service life. Improving capacity and cycle performance is vital to ensure that VRLA batteries remain as competitive alternative for future HEVs. Through utilization of lightweight grids,4 synthesized additives,5 or novel leady oxide,6 the energy density of LABs can be slightly improved. As for the cycle life, the key problem is the progressive irreversible sulfation. Under the so-called "high-rate partial-state-of-charge (HRPSoC)" duty in HEVs application,7 the battery will be discharged and charged at high current density with incomplete charging. The negative active materials (NAMs) have low specific surface area, resulting in high electric current density and low charging acceptance, which make the battery suffer from progressive sulfation more seriously.8 Therefore, a large quantity of PbSO4 particles in the negative plate will not be converted to metallic Pb when the fundamental charging processes are partially impeded in the NAMs under HRPSoC duty, which is often called as irreversible sulfation.9 The accumulation of irreversible lead sulfate significantly reduces the effective surface-area, hence impairs the cyclic performance of the battery.10
In the presence of insulating lead sulfate, the specific electric conductivity of active materials might drop sharply and the internal resistance of electrode would rise correspondingly for batteries under deep charge/discharge.11–13 A mathematical model has been developed to elucidate the role of electrode resistance in flooded LABs, a type of LABs.14 The utilization of various fibers as additives to reduce internal resistance under the HRPSoC duty has also been explored.15 These researches focused on the changes of the internal resistance, however, the relationships among the internal resistance, cycle life, and sulfation of negative plates under the HRPSoC duty have not been reported. We assume that there is a correlation between the internal resistance and formation of lead sulfate, the combination of precise description of internal resistance and characterization of negative plate might help to provide insights on deterioration mechanisms of the VRLA batteries under the HRPSoC duty. In fact, it has been reported that the internal resistance remained nearly unchanged in the case of partial discharging under high currents because the internal resistance mainly originated from the conversion of insulating PbSO4 to metallic Pb.12 So our studies were focused on the internal resistance during charging, which is often referred to as the charging direct-current internal resistance (DCIR).16–19
To modify the charging DCIR of the VRLA batteries, the addition of carbon additives is a common route. Virtually, several types of carbon additives have been incorporated into negative plates over past few years, including carbon blacks,20 activated carbon,21 graphite,22 carbon fibers,23 boron carbon nitride,24 graphene25,26 and carbon nanotubes.27–30 Addition of carbon restricts the progress of plate sulfation, which eventually terminates the service life of the battery in the HRPSoC duty.31 Effects of these carbon additives on the negative plates are generally attributed to super-capacitor effects, steric hindrance, enhanced electric conductivity, and electro-osmotic pump.32 The super-capacitor effect is usually attributed to the high surface area or functional groups on the surface of the carbon additives, such as activated carbon,33 while the electro-osmotic pump has been reported from utilization of graphite.34 The steric hindrance exists when there is a contact between active materials and carbon.35 As for the electric conductivity, despite some modifications on the surface, the electric conductivity might follow the following sequence: graphite > carbon blacks > activated carbon.36 Therefore, carbon blacks might be a good choice to promote the electric conductivity of the NAMs and minimize the impact of other effects.
Based on the reported results in literatures on carbon blacks, Vulcan XC 72 (referred to as VC 72 here after) was selected as the granular carbon additive in this study. It has been utilized in many types of batteries, including lithium-air,37 metal-air38 and redox flow batteries.39 VC 72 has a specific surface area of approximately 250 m2 g−1, much less than that of typical activated carbon, so its capacitance is almost negligible.40 In addition, the average particle size of VC 72 is much smaller than that of activated carbon,40 so it might be readily embedded into the bulk of the NAMs if electrochemical reactions occurred on its surface.41
In this study, a series dosages of VC 72 were utilized to dope the NAMs of the negative plates. The HRPSoC cycle performances and the charging DCIR behaviors were evaluated in detail. A mathematical relationship between the charging DCIR and the HRPSoC cycle life was established for the first time. Combined with characterization of the NAMs, the correlation between sulfation and the charging DCIR was also discussed. A mechanism of granular carbon particles as an additive to promote the HRPSoC cycle life by affecting the charging DCIR through modification of microstructure was proposed. The schematic of this study is shown in Fig. S1.
Experimental
Materials and chemicals
VC 72 was purchased from Cabot Co., USA (some physical characteristics of VC 72 are tabulated in Table S1). Leady oxide (LO) was used to prepare the NAMs; and the degree of oxidation of the LO was 89.1 wt%. The composition of LO are listed in Table S2–S3. The grid for the negative plate was Pb-Ca alloy. To investigate the performance of the negative plates, commercial positive plates were used. Some common additives, barium sulfate, sodium lignosulphonate, and polyester fiber were also used in the preparation of the negative plates, and their dosages were 0.5, 0.25, 0.1 wt% vs. LO, respectively. All the LO, grids, positive plates and additives were supplied by Changguang Co. Ltd (Wuhan, China).
Battery assembling and testing
Eight dosages of VC 72 (0, 0.2, 0.5, 0.8, 1.0, 1.2, 1.5, 1.8 wt% vs. LO) were introduced into the NAMs, denoted as C-0, C-0.2, C-0.5, C-0.8, C-1.0, C-1.2, C-1.5, and C-1.8, respectively.
LO, sulfuric acid (1.4 sp.gr.; 8 wt%), deionized water (13.5 wt%), barium sulfate, sodium lignosulphonate, polyester fiber and VC 72 were all homogeneously mixed through stirring for 20 minutes to fabricate the NAMs pastes. Each grid of 35 × 60 × 1.2 mm3 was densely coated with 27.5 g of the NAMs paste to form a negative plate. After an identical curing (as shown in Supporting Information) and formation procedure (as shown in Table S4), all the ripe negative plates were sent to a local battery plant for battery assembling.
Each testing battery consisted of one negative plate and two positive plates, separated by an absorbent glass mat (AGM) separator. The schematic and specific parameters of testing battery are shown in Fig. S2. The performance of the testing batteries, including initial capacity at different electric current density (C/20, C/10, C/5, 0.5 C, 1 C, 2 C), the charging DCIR, and HRPSoC cycle life, were all acquired using a Neware battery test system (CT-4008-5V6A-S1). Based on Ohm's law, the voltage of the battery would increase linearly during charging. Under HRPSoC duty, the charging current (I) is fixed. Once the initial voltage (V0) and termination voltage (V1) were recorded, the charging DCIR (R) could be then defined as R = V1-V0/I.16 A typical simulated HRPSoC cycle program consisted of the following steps:7 a testing battery was firstly discharged to 50% of its initial capacity at 1 C and then cycled as follows: (i) charged at 2 C rate for 60 s, (ii) hold for 60 s, (iii) discharged at 2 C rate for 60 s, then (iv) hold for another 60 s. The discharging and charging cutoff potential were set as 1.7 and 2.83 V, respectively. Once the battery reached cutoff voltage, it means that the battery couldn't work normally under HRPSoC duty unless full recharged. At this point, a "set" is finished, and the accomplished cycle numbers were recorded as the cycle life of this "set". Each battery experienced five consecutive sets of HRPSoC cycle test to evaluate its reliability and performance.
Characterization of VC 72 and the NAMs
The Raman spectra of VC 72 were acquired using LabRAM HR800 (Horiba Jobinyvon, France) with a Nd-YAG laser beam (wavelength = 532 nm). The electric conductivity of VC 72 was measured using a conductivity meter (Rooko FT-300I, China). The X-ray diffraction (XRD) patterns of the NAMs were collected utilizing X'Pert PRO XRD (Philips, PAN Analytical B.V., Holland) in the 2θ ranging from 5 to 75°, with X-ray source of Cu-Kα radiation (λ = 0.15418 nm). The NAMs were scraped from negative plate and homogeneously ground into powder before and after HRPSoC cycle tests for XRD analysis. The morphologies of the NAMs of the negative plates and VC 72 were characterized by transmission electron microscopy (TEM) (Tecnai G2 20, FEI, Holland & JEM-2100, JEOL, Japan) and scanning electron microscopy (SEM) (Sirion 200 SEM, FEI, Holland). The NAMs powders were uniformly distributed in ethanol and deposited on carbon grid for TEM analysis. The negative plates were cut into small pieces, and the surface morphology of negative plates before cycle tests were characterized. For a better observation of lead sulfate crystals, both surface and cross-section of negative plates after cycle tests were characterized, as shown in Fig. S3.
Results and Discussion
Evaluation of battery performance after the addition of VC 72
After the battery assembly, all the testing batteries were first subjected to charging/discharging cycles at different rates, ranging from C/20 to 2 C, and the capacities are shown in Fig. 1a. There are 2 testing batteries in each group, they showed similar performance under HRPSoC duty, therefore, only one battery was selected for analysis in each group. It can be observed that a lower VC 72 dosage (<0.5 wt%) in the NAMs enhanced the initial capacity at all rates, while the capacities decreased slightly at higher dosages, and battery exhibited maximum capacity with 0.2 wt% of VC 72. The nominal capacities of all batteries ranged from 3.1 to 3.6 Ah (or from 113 mAh g−1 to 131 mAh g−1). With a theoretical value of 240 mAh g−1, the calculated utilization efficiencies were all greater than 46.9%. The subtle capacity reduction from C-0.8 to C-1.8 might be related to the modified pore system of the NAMs, induced by the agglomeration of redundant carbon particles.33 The capacity decreased as electric current increased, which could be further explained by Peukert equation:
![Equation ([1])](https://content.cld.iop.org/journals/1945-7111/165/9/A1753/revision1/d0001.gif)
where C is the capacity, Ah; I is the electric current, A; and K and n are empirical constants. Peukert plots in the double Napierian logarithm are presented in Fig. 1b, which enables the linearization fitting of curves in Fig. 1a. The constants n, usually referred to as the coefficient, could be calculated from Fig. 1b. The value of n increases as the battery efficiency decreases; and the typical n value of LABs is 1.3.42 So the capacity (C) would decrease conspicuously as electric current (I) increased based on Eq. 1 (Figs. 1a–1b).

Figure 1. Battery performance: (a) initial capacities, (b) the corresponding Peukert dependence, (c) the discharge voltage curve during the first HRPSoC cycle set, and (d) the lifespan of each cycle set.
The consequence of 20 h rate capacity (initial capacity) and the calculated value of n are presented in Table I. The n values ranged from 1.25 to 1.36, similar to the typical value of LABs. It implies that the correlation between the electric current density and the capacity is relatively independent of carbon dosages.
Table I. Initial capacities (20 h rate) and values of n of testing battery with different dosage of VC 72.
| Sample number | Initial capacity/Ah | n |
|---|---|---|
| C-0 | 3.67 | 1.25 |
| C-0.2 | 3.79 | 1.27 |
| C-0.5 | 3.73 | 1.27 |
| C-0.8 | 3.27 | 1.32 |
| C-1.0 | 3.54 | 1.29 |
| C-1.2 | 3.38 | 1.32 |
| C-1.5 | 3.15 | 1.36 |
| C-1.8 | 3.23 | 1.33 |
The discharging potential during the first set of HRPSoC cycle is presented in Fig. 1c. With the presence of certain amounts of VC 72 in the NAMs, the HRPSoC cycle life was extended. Specifically, battery C-1.2 accomplished 16706 HRPSoC cycles before reaching the cutoff potential, which is five times longer than that of the control testing battery (C-0) in the first cycle set. A similar phenomenon could be observed in all cycle sets (Fig. 1d). With the VC 72 dosage in the NAMs ranging from 0 to 1.2 wt%, batteries accomplished increasing numbers of cycles as the VC 72 dosages increased, followed by slightly declined cycleability with further increases of VC 72 (1.2-1.8 wt%). After all five sets of HRPSoC cycles, battery C-1.2 completed the maximum number of cycles, 51624 specifically, while battery C-0 accomplished only 15586 cycles. The enhancement of HRPSoC performance brought by VC 72 is even better than some kind of activated carbon or graphene.29 The discharging capacity of every cycle was 0.0667 Ah, so the total discharging capacity of battery C-1.2 was nearly 3300 Ah. The HRPSoC cycle life of VRLA batteries has been prolonged significantly with the addition of VC 72.
Analysis of the charging DCIR
To analyze the effect of VC 72 on the cycle life of VRLA batteries, the charging DCIR behaviors during each cycle were investigated. Since battery C-1.2 has the longest cycle life, a comparison of the charging DCIR behaviors between battery C-0 and C-1.2 is illustrated in Fig. 2. As shown in Figs. 2a–2e, the relationship of the charging DCIR vs. the cycle number could be linearly fitted in each cycle set, and the relationship could be described by the following equation:
![Equation ([2])](https://content.cld.iop.org/journals/1945-7111/165/9/A1753/revision1/d0002.gif)
where R is the charging DCIR (mΩ), N is the cycle number, k is the slope (ΔR/ΔN), which stands for increasing rate of the charging DCIR vs. cycle number (N), and R0 is the initial charging DCIR in each cycle set. The specific parameters of k and R0 during each cycle set are shown in Table II. During the first four sets, the charging DCIR of the control battery C-0 increased rapidly, in comparison with those of battery C-1.2. However, the variation of two increasing rates became insignificant in the 5th set.

Figure 2. The charging DCIR behaviors of batteries C-0 and C-1.2 in each cycle set: (a) 1st set, (b) 2nd set, (c) 3rd set, (d) 4th set, and (e) 5th set; (f) the charging DCIR of batteries with different dosages of VC 72 at the end of each cycle set.
Table II. Linear relationship between the charging DCIR (R) and cycle number (N) (R = k N + R0,where R is charging DCIR (mΩ), N is cycle number, and k is the slope (ΔR/ΔN)).
| C-0 | C-1.2 | |||||
|---|---|---|---|---|---|---|
| Cycle Set | k/×10−3 | R0/mΩ | R2 | k/×10−3 | R0/mΩ | R2 |
| 1 | 3.00 | 25.72 | 0.73 | 1.91 | 17.59 | 0.94 |
| 2 | 4.94 | 27.12 | 0.91 | 2.47 | 23.67 | 0.99 |
| 3 | 6.30 | 27.22 | 0.94 | 2.84 | 25.16 | 0.98 |
| 4 | 5.40 | 30.13 | 0.98 | 3.26 | 30.39 | 0.97 |
| 5 | 4.64 | 32.52 | 0.95 | 4.38 | 31.69 | 0.99 |
It is worth mentioning that, the values of the charging DCIR at the end of each testing set were almost the same after the 1st set. For battery C-0, the charging DCIR reached approximately 45 mΩ when the HRPSoC cycle life terminated, compared with the charging DCIR of 55 mΩ for battery C-1.2. The charging DCIR behaviors at the end of each set of all testing batteries followed a similar trend as presented in Fig. 2f. Typically, a battery failed when its charging DCIR reached the same maximum limit during different cycle sets. Since the charging DCIR varied linearly with cycles under HRPSoC duty, the service life (N) could be reliably predicted by monitoring the variation of DCIR.
It can be concluded that presence of VC 72 in the NAMs contributed to hindering the rapid increase of the charging DCIR as shown in Figs. 2a–2e. Meanwhile, the charging DCIR at the end of each cycle set also changed with different dosages of VC 72 as illustrated in Fig. 2f.
The phenomenon that the charging DCIR increased continuously and reached a maximum limit upon failure might be explained by the Percolation theory. The specific electric conductivity (σ) of the NAMs could be described as:11
![Equation ([3])](https://content.cld.iop.org/journals/1945-7111/165/9/A1753/revision1/d0003.gif)
where x1 is the volume fraction (%) of the conductive phase (metallic Pb); xc is the critical volume fraction (%), and b is a numeric exponent.43 The critical volume fraction could be defined as:
![Equation ([4])](https://content.cld.iop.org/journals/1945-7111/165/9/A1753/revision1/d0004.gif)
where dc is a constant, and f is the filling rate, which depends on the compositions of the NAMs.44 Both the volume fraction of the conductive phase (x1) and the filling rate (f) could be defined as follow:11
![Equation ([5])](https://content.cld.iop.org/journals/1945-7111/165/9/A1753/revision1/d0005.gif)
![Equation ([6])](https://content.cld.iop.org/journals/1945-7111/165/9/A1753/revision1/d0006.gif)
![Equation ([7])](https://content.cld.iop.org/journals/1945-7111/165/9/A1753/revision1/d0007.gif)
where V1 is the volume of the conductive phase (%), V2 is the volume of the insulating phase (%), r is the conversion rate of the NAMs (i.e., the volume ratio of the insulating phase to the whole electrode, as shown in Eq. 7), f0 is the initial filling rate, and C is a constant determined by the molar volumes of different phases.
The specific electric conductivity (σ) could be deduced from Eqs. 3–7, as presented in Eq. 8:
![Equation ([8])](https://content.cld.iop.org/journals/1945-7111/165/9/A1753/revision1/d0008.gif)
where the parameters of f0, b, dc are listed in Table S5.12 We assumed that negative plate was almost all metallic lead before cycle test, i.e., r = 0, thus the specific electric conductivity (σ) equals to that of metallic lead(σ1), and internal resistance (R) is inversely proportional to the specific electric conductivity (σ):
![Equation ([9])](https://content.cld.iop.org/journals/1945-7111/165/9/A1753/revision1/d0009.gif)
![Equation ([10])](https://content.cld.iop.org/journals/1945-7111/165/9/A1753/revision1/d0010.gif)
However, the addition of VC 72 changed this value of testing battery as shown in Table II, and the value of R0of C-0 and C-1.2 are 25.72 and 17.59 mΩ, respectively, indicating a variation of parameter dc for battery C-1.2. The specific parameters of battery C-0 and C-1.2 are shown in Table S6. Combining Eqs. 8–10, the ratio of maximum limit of Rmax(C-0)/Rmax(C-1.2) was calculated to be 0.85, and the corresponding conversion rate of testing battery C-0 and C-1.2 were nearly 0.75 and 0.82, respectively. The measured maximum limit value of Rmax(C-0)/Rmax(C-1.2) was approximately 0.82 (i.e., 45/55), in accordance with theoretical values.
Based on the above analysis, the specific electric conductivity (σ) can be regarded as a function of the conversion rate (r) of the NAMs. With higher volume fraction of insulating phase of PbSO4 (V2), the conversion rate (r) would increase, and the specific electric conductivity (σ) of the NAMs decreased correspondingly. Therefore, the charging DCIR would rise with an increase of volume fraction of PbSO4. When the content of lead sulfate reached a threshold, for example, the conversion rate reached 0.75 for battery C-0 or 0.82 for battery C-1.2, the ratio of active mass became insufficient for the proceeding of discharging reaction,14 and the testing battery would reach the cutoff potential at this point. A battery was then fully recharged before the next set of cycle test. After being recharged, most of lead sulfate would be transformed to conductive metallic lead that resulted in a decrease of the charging DCIR.
The Eq. 8 helps to establish a quantitative correlation between the inner compositions of negative plate and charging DCIR, by which HRPSoC cycle life can be predicted and the deterioration process through battery testing can be described. An optimal dosage of VC 72 in the NAMs could provide a favorable effect to enhance electric conductivity during charging, thus hindering the rapid increase of the charging DCIR. This effect was most likely related to alleviation of sulfation.
Characterizations of VC 72 and the negative plates
The morphology and structure of VC 72 were characterized by SEM, Raman, and XRD, as shown in Fig. S4. The morphology (Fig. S4(a)) and size distribution of VC 72 (Fig. S4(b)) indicate that VC 72 particles are spherical in nanometer size (∼20 nm), which might provide nuclei for formation of PbSO4 crystals and conductive pathway for electron exchange. As shown in the Raman spectrum (Fig. S4(c)), the peaks located at 1355 and 1580 cm−1 are correlated with the disordered (D) band and the graphitic (G) band, respectively; and the ratio of integrated intensity (ID/IG) was 0.73. A relatively low integrated Raman intensity ratio of the D and G bands implies an increasing amount of graphene clusters in the structure, attributing to the improved electric conductivity of VC 72.45 The electric conductivity of VC 72 was measured to be 3.0 mS mm−1. As shown in Fig. S4(d), only two broad peaks at 25° and 43° are observed in the XRD pattern, with no other miscellaneous peaks, indicating no other impurity is discernible. The main peak at 25° is associated with lattice plane (1 1 0) with an interplanar spacing of 0.367 nm.
All the negative plates were subjected to phase and morphology characterizations before the battery tests. The XRD patterns of the NAMs in the formed negative plates with different dosages of VC 72 are shown in Fig. 3. In the absence or low dosages of VC 72, the NAMs consisted of metallic lead alone. With the VC 72 dosages increased to higher than 0.5 wt%, the phases of the NAMs stayed constant, comprising major crystalline phase of metallic lead and a small amount of lead oxide. The generation of lead oxide could be attributed to the impeded transport of ions.33

Figure 3. XRD patterns of the NAMs in the formed negative plates before cycle test: (a) C-0, (b) C-0.2, (c) C-0.5, (d) C-0.8, (e) C-1.0, (f) C-1.2, (g) C-1.5, and (h) C-1.8.
The surface morphologies of the NAMs of the negative plates in each testing battery are shown in Fig. 4. From the SEM images of lower VC 72 dosages (<1 wt%, Figs. 4a–4d), spongy morphologies could be observed. While when VC 72 dosages increased to higher than 1 wt%, cubic particles were substituted by interconnected granules (Figs. 4e–4h). Besides, particles of more uniform in shape and size could be observed in Figs. 4d–4f, which are favorable for promoting battery cycle performance.

Figure 4. SEM images of the NAMs in the formed negative plates with different dosages of VC 72 before cycle test: (a) C-0, (b) C-0.2, (c) C-0.5, (d) C-0.8, (e) C-1.0, (f) C-1.2, (g) C-1.5, and (h) C-1.8.
After all five sets of HRPSoC tests, all the batteries were fully recharged, and then disassembled before subsequent analysis. The XRD patterns of the disassembled negative plates are illustrated in Fig. 5. Metallic lead, lead sulfate, and lead oxide were identified as the main crystalline phases in the NAMs, while no XRD peaks matched with carbon due to its low mass percentage. It is worth mentioning that, when the VC 72 dosages were between 0 to 0.5 wt% (Figs. 5a–5c), lead sulfate was identified as the major crystalline phase. It indicates that most of the lead sulfate existed as irreversible phase. At higher VC 72 dosages (0.8 to 1.8 wt%), metallic lead was the major phase, indicating that most of lead sulfate existed as reversible phase and could be converted to metallic lead after being fully recharged.

Figure 5. XRD patterns of the NAMs in the negative plates after all five sets of HRPSoC cycle test: (a) C-0, (b) C-0.2, (c) C-0.5, (d) C-0.8, (e) C-1.0, (f) C-1.2, (g) C-1.5, and (h) C-1.8 in fully recharged state.
The morphologies of surface and cross-section of each negative plate are shown in Fig. S5 and Fig. 6. No evident differences could be observed among the surfaces of all the plates (Figs. S5(a-h)), a dense layer on the surface of negative plates could be found. So the internal morphologies of each plates were characterized. The internal structure of the negative plates was completely transformed with the addition of VC 72. In the absence of VC 72, dendritic crystals of several micrometers in diameter was observed (Fig. 6a). When the VC 72 dosage increased to 0.2-0.5 wt%, the dendritic crystals were gradually transferred to a cubic shape (Figs. 6b–6c). With the further increase of VC 72 dosage (>0.8 wt%), the cubic crystals could no longer be found. Instead, numerous tiny grains, uniformly distributed around the larger amorphous agglomerates, could be observed in Figs. 6d–6h. The size distribution of different NAMs of each testing battery are shown in Fig. S6. With the increase dosage of VC 72 from 0 to 1.2 wt%, the particle size becomes smaller, than it gets larger with further increase of VC 72. This trend is in consistence with SEM images. It has been reported that lead sulfate crystals with large particle sizes were more strenuous to be converted to metallic lead.46 Thus, the generation of irreversible sulfate appear to be alleviated effectively with excessive dosages of VC 72.

Figure 6. SEM images of the NAMs in the cross-section of negative plates after all five sets of HRPSoC cycle test with different dosages of VC 72: (a) C-0, (b) C-0.2, (c) C-0.5, (d) C-0.8, (e) C-1.0, (f) C-1.2, (g) C-1.5, and (h) C-1.8 in fully recharged state.
The EDS mapping of batteries C-0 and C-1.2 in fully recharged state after all five sets of HRPSoC cycle test are presented in Fig. 7 to confirm the postulation from morphology analyses. As shown in Fig. 7a, Pb and S are the dominant elements in negative plate of C-0, with nearly no C discernible. Combined with XRD and SEM analysis in Fig. 5a and Fig. 6a, the crystal could be identified as lead sulfate. In contrast, both Pb and C elements were homogeneously dispersed in negative plate of C-1.2, while S element was almost invisible as shown in Fig. 7b. From the XRD and SEM analysis in Fig. 5f and Fig. 6f, the Pb element mainly existed as metallic lead. Furthermore, the dosage of VC 72 in the NAMs is only 1.2 wt%. It indicated that the small amount of VC 72 particles were uniformly dispersed in the metallic Pb grains. The unique morphology of metallic lead combined with uniform distribution of carbon particles could be beneficial for hindering the rapid growth of lead nuclei due to steric hindrance.47,48

Figure 7. The EDS mapping images of the negative plates after all five sets of HRPSoC cycle test: (a) C-0 and (b) C-1.2 in fully recharged state.
To elucidate the roles of granular carbon particles precisely, transmission electron microscope (TEM) and high-resolution transmission electron microscope (HRTEM) analyses for the NAMs of batteries C-0 and C-1.2 in fully recharged state were also conducted after all five sets of HRPSoC cycle tests (Fig. 8). Battery C-0 exhibited a dendritic structure of a few micrometers in size (Fig. 8a), similar to that in SEM image (Fig. 6a). However, carbon grains were incorporated into the lead bulk, and filled the gaps between lead skeleton (Fig. 8b), thus providing electric pathways for electrons. As shown in the HRTEM image (Figs. 8c–8d), some particles of tens of nanometers in size were embedded in the lead bulk, and the interplanar spacing of them was measured to be approximately 0.366 nm, which is consistent with the (1 1 0) lattice plane of VC 72 as seen in the XRD pattern (Fig. S4(d)), and in agreement with the particle size of VC 72 (around 20 nm) in the SEM image of VC 72 (Fig. S4(a)). Based on the TEM and HRTEM analysis, it can be inferred that some granular carbon particles in nano sizes would be completely covered by lead, as shown in Fig. 8d. While the other part of carbon particles might aggregate among the lead bulk, as shown in the box area of Fig. 8b. Meanwhile, some carbon particles were separated from the lead bulk as pointed in Fig. 8c.
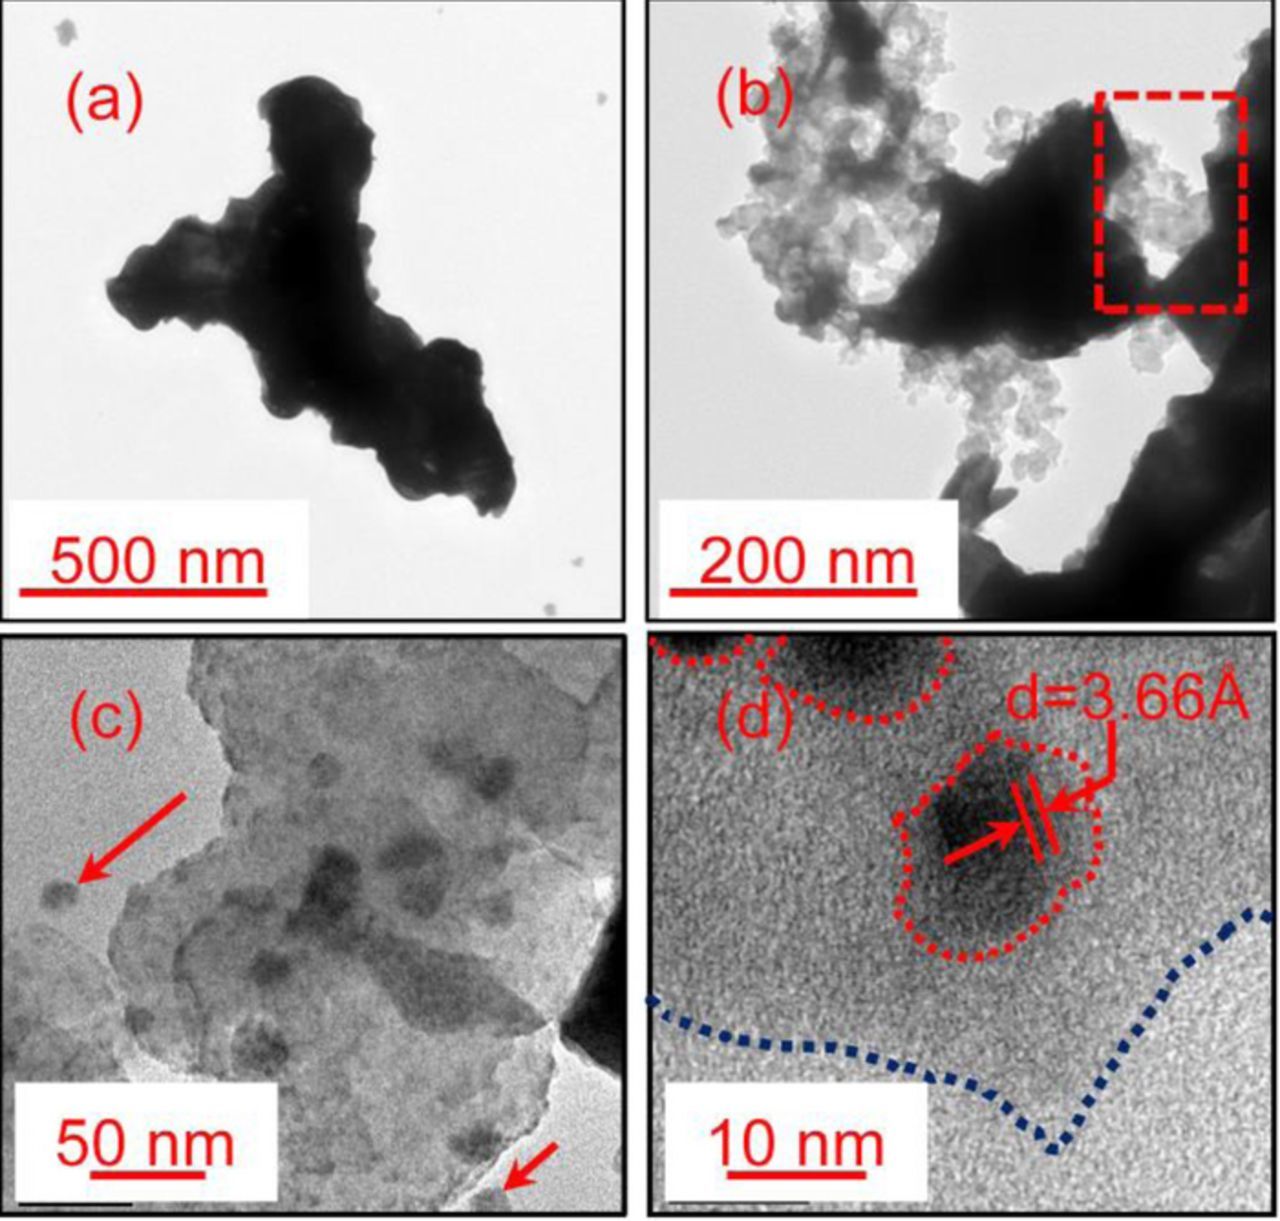
Figure 8. TEM images of negative plates after all five sets of HRPSoC cycle test ((a) C-0, (b) C-1.2), and the corresponding HRTEM images of C-1.2 (c-d) in fully recharged state.
As reported in the previous literatures, the reduction of Pb2+ ions to Pb occurred on the surfaces of both carbon and the lead skeleton.33,47 When Pb or PbSO4 was deposited on the surface of VC 72, nano carbon particles acted as nucleation seeds for the growth of them.41 With the proceeding of this process during battery cycling, some granular carbon particles would then be covered by metallic lead or lead sulfate (Fig. 8c). To the best of our knowledge, this is the first report that carbon particles has been directly detected to be embedded in the lead bulk during HRPSoC duty in LABs. However, when carbon particles were embedded in or separated from the lead bulk, they could no longer perform as the electron pathway.49 In summary, the addition of VC 72 has definitely altered the inner structure of the negative plates, thus impeding the formation of large lead sulfate crystals.
Relationship between microstructure and the charging DCIR
Since there is a close correlation between electric resistance and the formation of lead sulfate, the charging DCIR behavior (Fig. 2) could be discussed in detail with characterizations of negative plates, as shown schematically in Fig. S7.
Two points can be concluded from Fig. 2. The first is the increasing rate of the charging DCIR, and the second is the value of the charging DCIR at the end of each cycle. As long as a battery is operating under HRPSoC duty, the generation of lead sulfate is inevitable due to partial charging as shown in Fig. S7. Consequently, the charging DCIR of all testing batteries would increase with the cycles of battery, but may show difference in the increasing rate, as shown in Fig. 2. In the absence of VC 72, metallic lead was converted into large lead sulfate crystals, which were more difficult to be reduced to metallic Pb compared with smaller crystals.46 Therefore, the accumulation rate of lead sulfate became accelerated, and the charging DCIR was directly determined by the degree of sulfation as demonstrated in Eq. 8. Via the addition of granular carbon particles in the NAMs, the formation of large lead sulfate crystals could be inhibited, so as the rapid increase of the charging DCIR. However, this effect would be weakened in the last few cycle sets due to the fact that some carbon particles were separated from the lead bulk while some embedded in the lead bulk.
On the other hand, the degree of sulfation of each negative plate was close at the same level of charging DCIR.11 In the absence of carbon particles, the NAMs were occupied by large insulating lead sulfate crystal, hence the paths for electric current were blocked, leading to premature failure. However, the conductive carbon particles could provide extra electric current channels between insulating lead sulfate particles, which enable the reduction of Pb2+ ions to Pb to occur. Consequently, battery C-1.2 could still operate normally at a higher charging DCIR with the help of carbon particles.
Although the above mechanism is deduced from granular carbon additives, it can also be applied for the other conductive particles (for example, semiconductor oxide) with a similar morphology, which could produce similar advantageous effects when used as additives in the NAMs as confirmed by some previous studies.50,51
Conclusions
The deterioration mechanism of VRLA under HRPSoC duty was elucidated in this investigation. The charging DCIR increased linearly during HRPSoC cycle until the termination of cycle life when it reached the maximum limit. And the cycle life could be precisely predicted from the variation of DCIR values.
The key process that restricted the HRPSoC cycle life was the accumulation of lead sulfate during incomplete charging. Increasing percentage of insulating PbSO4 would directly lead to increased charging DCIR. Without granular carbon particles in the NAMs, the conversion rate reached approximately 0.75 upon failure. In contrast, it increased to 0.82 with the addition of carbon additive (VC 72), revealing a higher utilization efficiency of the NAMs.
Consequently, battery C-1.2 showed a higher charging DCIR maximum limit (55 mΩ) compared with that of battery C-0 (45 mΩ). Meanwhile, carbon particles distributed uniformly around metallic lead, inhibiting the formation of irreversible lead sulfate crystals and provide extra pathways for electron transport. Through the preferential effect on the microstructure of the NAMs, granular carbon particles slowed down the increasing rate of charging DCIR during HRPSoC duty, and the cycle life was prolonged by 3 times with only 1.2 wt% of VC 72 additives in the NAMs.
Acknowledgments
The authors acknowledge the funding support from the National Science-technology Support Plan Projects (2014BAC03B02), project of Innovative and Inter disciplinary Team, HUST(2015ZDTD027) and the Selected Certificate of Yellow Crane Talents (special) Program. The author would also like to thank the Analytical and Testing Center of Huazhong University of Science and Technology for materials characterization.
ORCID
Jiakuan Yang 0000-0002-1936-5646