
Abstract
We report the use of X-ray diffraction in combination with computed tomography to provide quantitative information of a coin cell Li-ion battery and a commercial Ni/MH AAA battery for the first time. This technique allows for structural information to be garnered and opens up the possibility of tracking nanostructural changes in operandi. In the case of the cylindrically wound, standard AAA Ni/MH cell, we were able to map all the different phases in the complex geometry, including anode, cathode, current collector and casing, as well as amorphous phases such as the binder and separator. In the case of a Li-ion coin cell battery, we show how the X-ray diffraction tomography data can be used to map crystal texture of the LiCoO2 particles over the cathode film. Our results reveal that the LiCoO2 microparticles show a high degree of preferred orientation, but that this effect is not homogenous over the film, which may affect the electrochemical properties.
Export citation and abstract BibTeX RIS

This is an open access article distributed under the terms of the Creative Commons Attribution 4.0 License (CC BY, http://creativecommons.org/licenses/by/4.0/), which permits unrestricted reuse of the work in any medium, provided the original work is properly cited.
The design of future energy storage materials relies on an intimate understanding of structural changes occurring as the system operates. While the design of methods for in situ observation of changes in materials is difficult, a number of techniques exist which provide vital information on the physical and chemical transformations occurring in, for example, electrode materials in Li-ion batteries. In situ X-ray diffraction (XRD),1–4 X-ray absorption spectroscopy (XAS),2,5,6 X-ray transmission microscopy,3,7 and Mössbauer spectroscopy8 have allowed for local electronic and atomic structure determination for a range of candidate materials for Li-ion battery electrodes. However, the continued development of in situ characterization tools is crucial for improving our understanding of the mechanisms governing the performance of batteries.
Recently, dynamic X-ray computed tomography (CT) techniques have emerged as an excellent tool for studying microstructural changes and building up a quantitative picture on the scale of particle size.9–12 For example, Woo and coworkers have used synchrotron radiation X-ray tomographic microscopy to observe the complex conversion reactions occurring in SnO2 electrodes, where phase evolution and particle cracking in individual 30 μm-sized particles were observed.13 Wang et al. have also shown that recently developed synchrotron X-ray nanotomography can be applied to tin anodes.14,15 For Li-ion battery research and for smaller commercial applications, coin or button cells are the preferred geometries, and many commercial batteries have a complex spiral wound geometry. However, to date, the CT methods reported have required the design and construction of specialized battery cells. Studies of chemical and structural changes in commercial devices, using spatially resolved, quantitative, non-destructive characterization methods are highly desirable, as this would provide a method to study electrode reactions in situ as realistically as possible. To this end we set out to develop the capability of applying the recently described XRD-CT9 and computed tomography atomic pair distribution function (ctPDF)16 methods to a Li-ion battery in the commercially applied coin cell, and a Ni/MH battery in its commercial spiral wound AAA configuration. XRD-CT gives quantitative structural information on crystalline components, and ct-PDF on nanocomponents, in a spatially resolved way with resolutions on the scale of a few tens of micrometers. Applying these methods to commercial batteries is non-trivial because of the relatively large size of the devices, and the presence of strongly scattering components such as steel casings and rare-earth components in the Ni/MH case. Despite the challenges, we were able successfully to reconstruct diffraction patterns in real-space revealing information about the chemical and structural state of the battery components with a resolution of 50 micrometers. For example, we find that crystal texture, an important factor in electrochemical performance, varies with position in the LiCoO2 cathode in the Li-ion coin cell battery. Unfortunately, the data were not of sufficient quality to Fourier transform reliably to obtain PDFs allowing us to study nanostructure. This will require better statistics on the data and more effort in fine-tuning the CT reconstruction algorithm. Nonetheless, the results and observations reported here pave the way for in operando studies of cycling commercial batteries, which will provide a quantitative picture of structural changes occurring in individual components, and their spatial distribution, under realistic conditions.
Experimental
Battery preparation
A commercial, multi-cycled discharged battery cell from SANIK was used for XRD-CT measurements of a cylindrical Ni/MH battery cell. An AG3 coin cell was prepared with LiCoO2 (2.55 mg) as the positive electrode material, together with a SuperP carbon additive (22.09%) and a PVDF binder (7.86%) cast onto an Al foil substrate. The LiCoO2/SuperP/PVDF layer is 80 to 96 μm and the Al foil on which is sits is 15 μm. The electrolyte consisted of a 1 M LiPF6 in an EC:DMC mixture. Scanning electron microscopy (SEM) images of the LiCoO2 particles are shown in Figure 1.
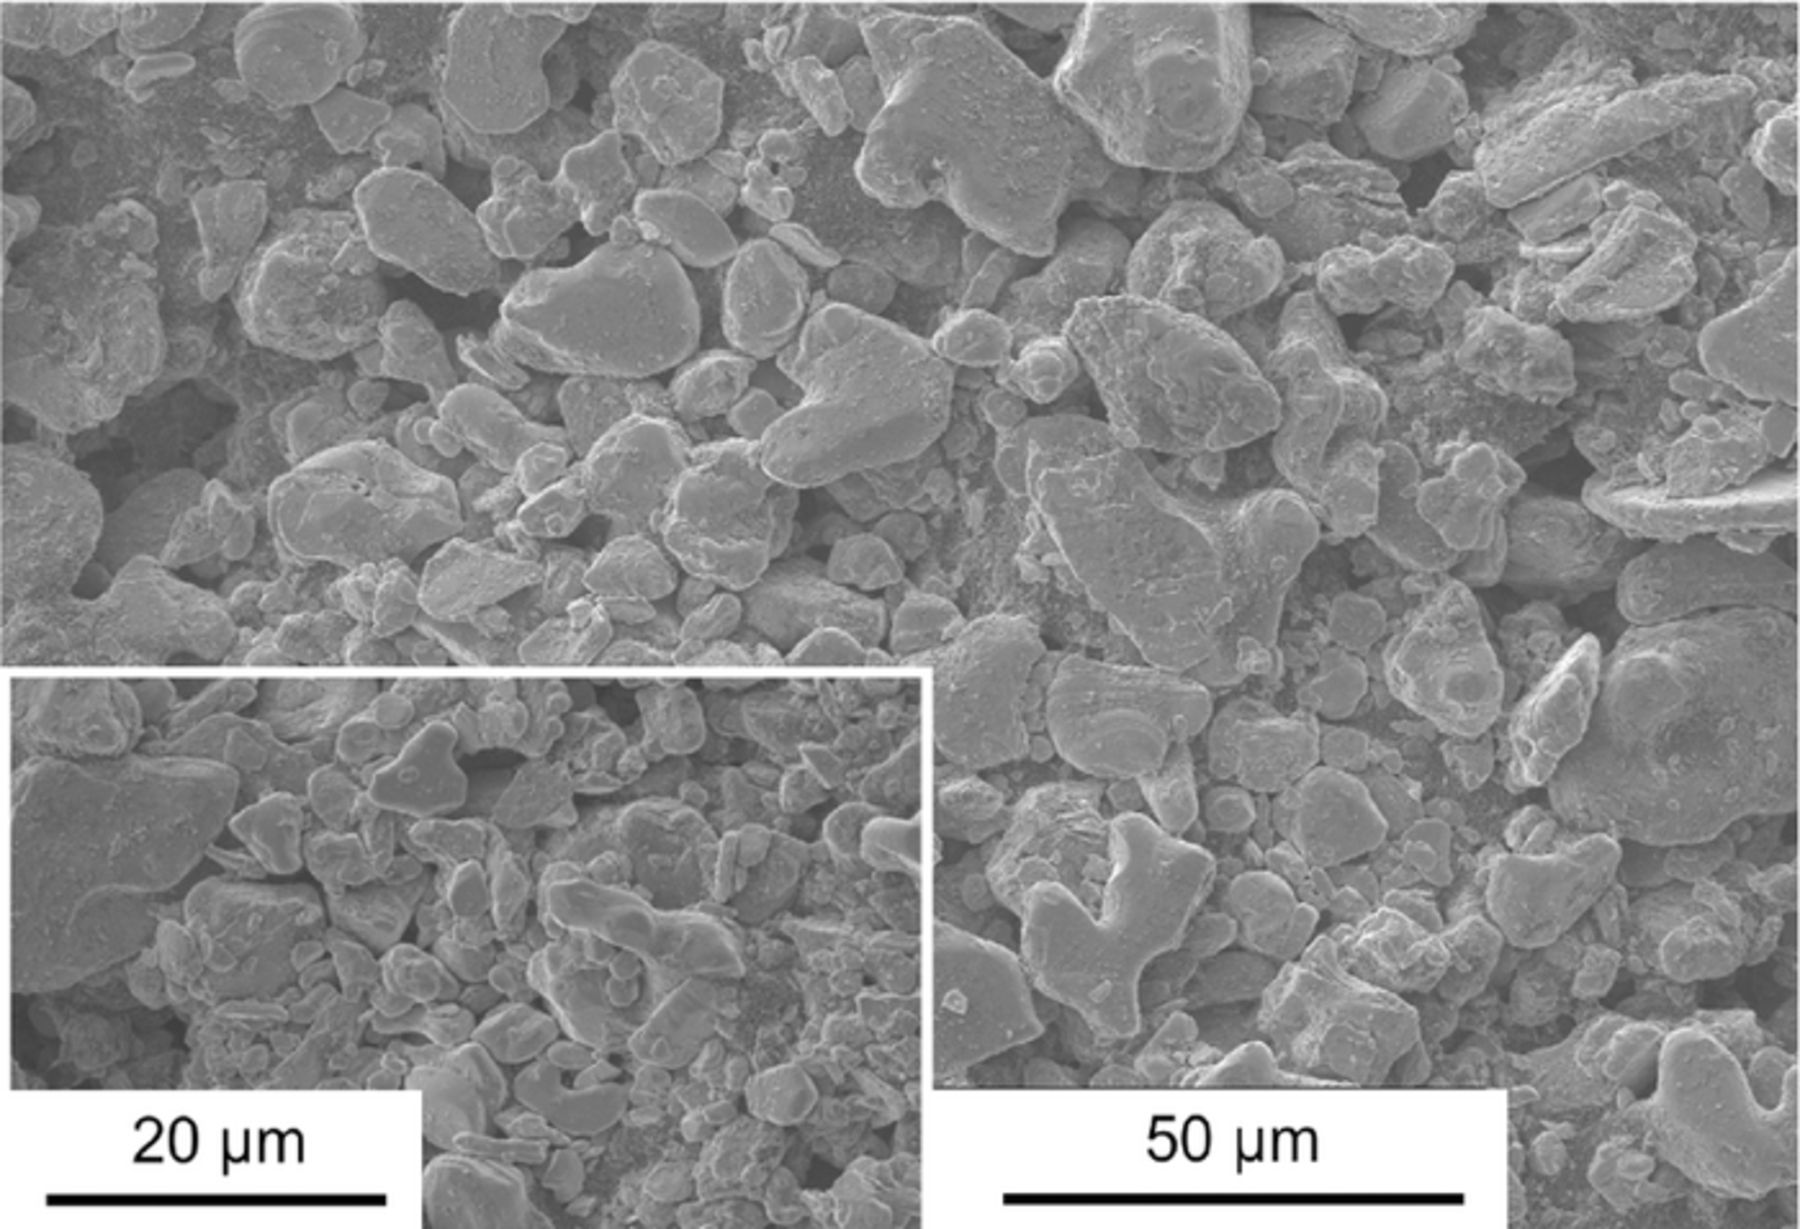
Figure 1. SEM micrographs of the LiCoO2 particles used as the positive electrode for the coin cell geometry. Images at different magnifications reveal large particle sizes with no apparent preferred orientation.
Beamline information and sample mounting
The diffraction tomography experiments were performed at ID15A at the European Synchrotron Radiation Facility, ESRF. X-rays were produced using an undulator insertion device with a gap of 6.25 mm and focused using a set of aluminum and beryllium refractive X-ray lenses (a so-called transfocator). Monochromatic E = 69.95 keV X-rays were selected using a bent Laue Geometry double crystal monochromator yielding a bandwidth of ca. 300 eV. The high X-ray energy lowers the risk of beam damage to the sample from the long X-ray exposures. The focused spot size at the sample position was 50 μm vertical and 120 μm horizontal. The horizontal beam size was then reduced using a set of horizontal slits, and the final beam size was 50 by 50 μm2. Debye-Scherrer (transmission) geometry was employed with diffracted X-rays recorded on a Perkin Elmer 1621 CN3 ES flat panel digital detector. A thick walled brass tube terminating in a 1 mm pinhole was placed in front of the sample to reduce air scattering. The batteries were mounted and aligned on a rotation stage, which in turn was mounted to a linear stage (with travel perpendicular to the beam in the horizontal plane). A small tungsten beam stop of diameter 2 mm was placed a few centimeters behind the sample. For all experiments, a tomographic data set was obtained by completing a series of line scans covering an angular range from 0 to 180. Line scans were performed at steps of 50 μm to obtain a 50 μm2 pixel size in the reconstructed image. We typically collected 200 diffraction patterns in an approximately 10 mm line scan using 120 different projections.
Data reconstruction
The diffraction patterns were corrected for the detector dark current signal and normalized by the X-ray incident intensity; then corrected for the beam polarization and detector geometry. The 2D diffraction patterns were azimuthally integrated to obtain diffracted intensities as a function of the exchanged momentum q. For each q value a sinogram was produced, i.e. a representation of the diffracted intensity as a function of the beam position and sample orientation. Tomographic reconstructed images were obtained applying the filtered back projection algorithm.17
Results and Discussion
Ni/MH battery
We first applied the XRD-CT method to a Ni/MH battery, to demonstrate the effectiveness of this method in identifying individual components of a complex system.18,19 These cylindrical commercial cells contain a positive electrode Ni(OH)2, separator and a metallic alloy negative electrode, which are wound tightly in a spiral arrangement and contained in a steel casing.20 A discharged cylindrical AAA-Ni/MH battery from SANIK was placed vertically in the beam and a horizontal CT scan was collected. The reconstructed CT data gave us full scattering patterns from each individual pixel in the horizontal scan, allowing us to spatially map scattering intensities from different points in Q-space. Examples of the reconstructed diffraction patterns are shown in Figure 2 from two different spots in the battery. Bragg peaks from the crystalline phases present can clearly be resolved.
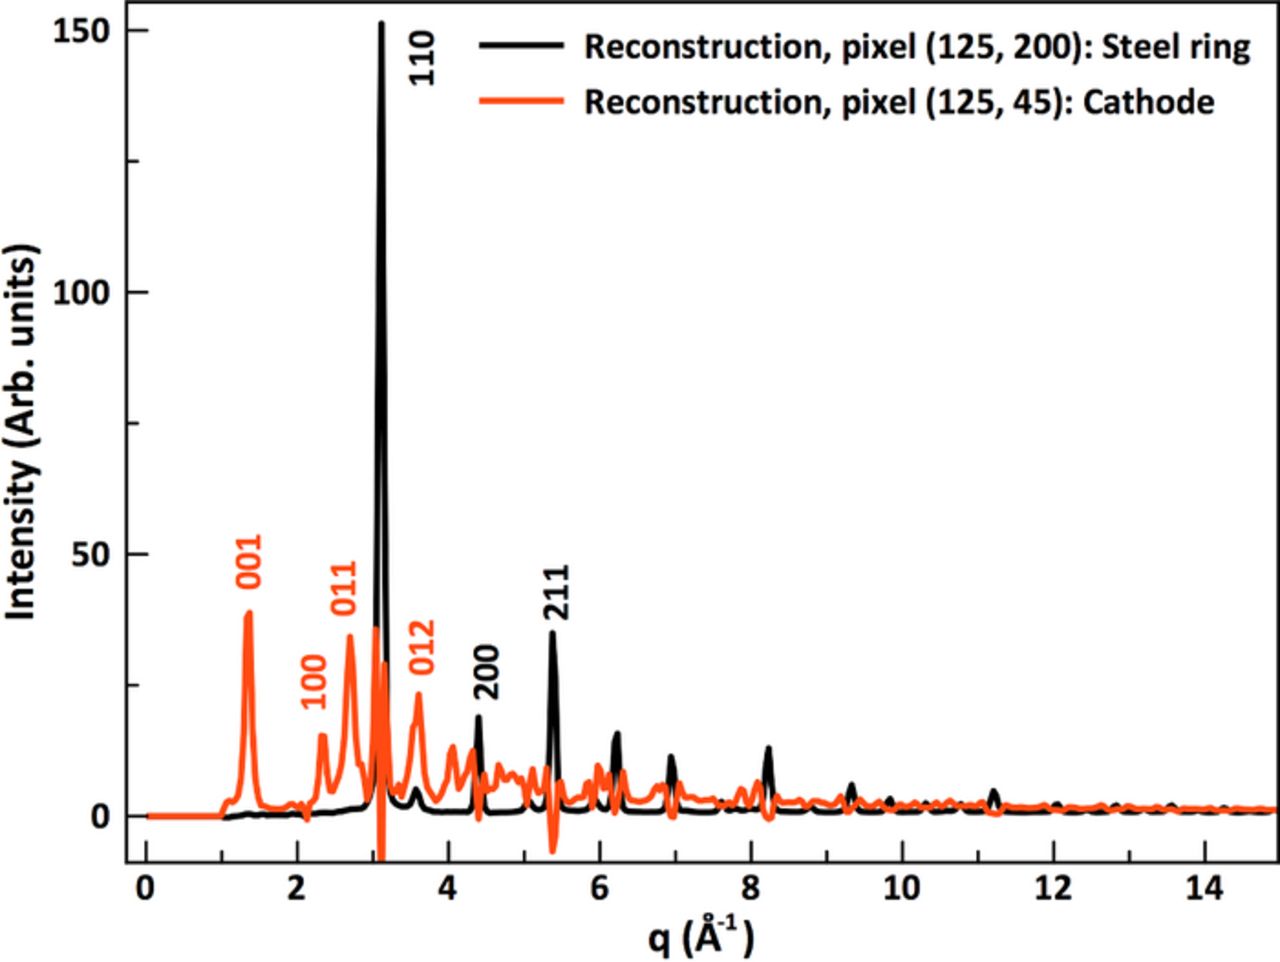
Figure 2. Examples of reconstructed diffraction patterns from two different positions in the battery. For clarity, only the low q-region of the data is shown. The black line shows a reconstruction from the edge of the Ni/MH battery, showing diffraction from steel. The red line shows a pattern obtained from the cathode (with clear Bragg peaks from Ni(OH)2). Reconstruction errors are seen in the cathode pattern at the steel peak positions.
Figure 3a (i) shows a map of the intensity summed in the Q-range 20 to 23 Å−1. In this range, most of the scattering is incoherent and the intensity represents the general scattering power of the sample proportional to the electron density in the various phases. While this does not provide any structural information, it maps the distribution of scattering density of materials in the battery. The plot shows a highly complex structure with the spiral construction clearly observed, contained in an outer casing. By studying the scattering patterns in pixels at different positions, phase identification is possible. The discharged cathode consists of Ni(OH)2, which has a characteristic intense Bragg peak at 1.3 Å−1. A map of the intensity at this Q-point is seen in Figure 3a(ii), which highlights the spiral structure of the electrode. The intensity drop off toward the center of the device probably reflects an uncorrected absorption effect from rare-earth elements present in the anode rather than a real change in the density of the positive electrode, but the diffraction patterns confirm that the crystalline material present in the cathode is Ni(OH)2 throughout the electrode from the edge to the middle of the battery. To study the discharged anode phase we focus on a characteristic Bragg peak at Q = 1.64 Å−1. The intensity map [Figure 3a(iii)] shows a thick, continuous layer of the anode at the battery edge. Interestingly, we also see a much thinner double layer of the same phase present in the spiral construction indicating the anode phase is present as a surface coating on two opposite sides of a substrate. The battery casing is made of steel with a characteristic Bragg peak at 3.09 Å−1, the intensity map of which is plotted in Figure 3a(iv). The steel can is clearly seen as a very intense thick ring surrounding the battery. However, features from steel are also seen within the battery in the form of a dotted line from a perforated metal foil, which serves as a substrate and current collector for the negative anode.20 The remaining, major components in the battery are amorphous phases, which are harder to characterize with conventional diffraction, as they show no long-range order or characteristic Bragg peaks. However, relatively intense diffuse scattering from these materials is seen in the Q-range below 2 Å−1. Figure 3a(v) shows a map of the intensity at q = 1.7 Å−1, where no Bragg peaks from any of the crystalline phases are present. The highest intensity in this map arises from the two layers of Kapton foil used to hold the battery in place in the beam. A third homogeneous polymer layer seen surrounding the battery arises from the plastic foil label on the battery. Dominating amorphous components are also seen within the spiral construction of the battery, which can be attributed to the separator and the binder used in the preparation of the cathode film.21

Figure 3. Data collected for cycled Ni-MH cell: (i) summed intensity in the q-range 20 to 23 Å−1; (ii) intensity at q = 1.36 Å−1, representing the cathode phase; (iii) intensity at q = 1.64 Å−1, representing the anode phase; (iv) intensity at q = 3.09 Å−1, representing steel; (v) intensity at q = 1.40 Å−1, representing any amorphous component. (b) Schematic of coin cell assembly. (c) Data collected for coin cell with scans through layers 1 to 4 (i.e. from bottom of cathode to separator). A1–A4: Map of intensity at q = 3.08 Å−1, indicating diffraction from steel. B1–B4: Intensity at q = 1.33 Å−1, showing diffraction from LiCoO2 in layer 1–4. C1–C4: Intensity at q = 1.74 Å−1.
Li-ion coin cell battery
After having demonstrated the strength of the technique for phase mapping in the complex AAA battery, we employed the XRD-CT technique to obtain information on phase identification and structural information of a coin cell containing LiCoO2 as the positive electrode. The coin cell construction is seen in Figure 3b. Data from five slices perpendicular to the axis of the battery were obtained, four of which are shown in Figure 3c, going from the bottom of the cathode (scan 1) to the separator (scan 4). The fifth layer is identical to the fourth. Figure 3c:A[1–4] shows maps of the intensity at Q = 3.09 Å−1 in each of the bottom four layers, clearly picking up the circular steel casing surrounding the battery, with no other steel components observed. The cathode, LiCoO2, has its most intense Bragg peak (hkl = 003) at Q = 1.33 Å−1. Intensity maps from this Q-value are seen for the four layers in Figure 3c:B[1–4], which show that LiCoO2 is present in only the three lower layers. The cathode film diameter is smaller than that of the cell casing and is seen as a disc in the center of the battery. The intensity distribution furthermore shows that the cathode film is slightly tilted within the casing, as only parts of it are seen in the 1st and 3rd layer. Finally, the intensity from the LiCoO2 003 Bragg peak is not homogenous over the cathode film as seen by intensity speckles, as discussed further below.
Figure 3c:C[1–4] shows the intensity at Q = 1.74 Å−1, where there are no Bragg contributions from any of the phases. Instead, this represents the point with the most intense diffuse scattering from the amorphous separator, as well as from the surrounding Kapton tube present in all the scans. Figure 3c:C4 shows homogenous scattering from the separator, which fills the battery casing. In the lower three layers, the separator is seen to surround the cathode film thereby isolating it from the Li metal anode. When assembling the battery, the flexible separator has been pressed down onto the cathode film to ensure close contact between the different components. Due to tilting of the film, the separator is seen to cover half the cathode in scan 3, whereas it is only seen weakly in the lower left corner in the first scan [Figure 3c:C1], suggesting that it does not press uniformly all the way to the bottom of the casing. Figure 3c:C1 also shows scattering intensity in a ring surrounding the separator and cathode, arising from the polymer O-ring in the casing.
We now investigate in greater detail the speckled pattern that is evident in the intensity map of the cathode in Figure 3c[B1-B3]. We can rule out CT reconstruction errors for this pattern, since no such speckled pattern is seen in the steel or the separator, which suggests that it has a physical origin. The most obvious possibility is that it reflects a variation in LiCoO2 density from place to place in the cathode, but another possibility is that the cathode is crystallographically textured (i.e., has preferred orientation of crystallites) and the degree of preferred orientation varies from place to place, since this would also affect the intensity of the 003 Bragg peak. To assess which of these possibilities is more likely we made a comparison of the intensity map for the 003 peak and that of the integrated intensity in the high Q-region which, as we discussed above, is a measure of the density of the material. First, to get a more accurate determination of the 003 peak intensity map we fit it with a Gaussian peak to reduce noise fluctuations. A plot of the fitted intensity is shown in Figure 4a, where speckles of higher intensity are clearly observed to persist. Furthermore, a region with reduced average intensity is seen in the lower left of the cathode, as well as close to the middle of the film. On the other hand, the density map, obtained by plotting the intensity integrated in the Q-range 20 Å−1 to 23 Å−1, is shown in Figure 4b. The intensity distribution over the film replicates some of the features seen in Figure 4a, with high intensity in the edges of the cathode but with the least LiCoO2 seen in the bottom left corner, possibly due to tilting of the cathode film. However, the intensity in Figure 4b is smooth and the speckles clearly seen in the 003 peak intensity in Figure 4a are not present in this plot and can thus not be attributed to an inhomogeneous distribution of cathode material. It may thus be related to crystallographic texture in the cathode.
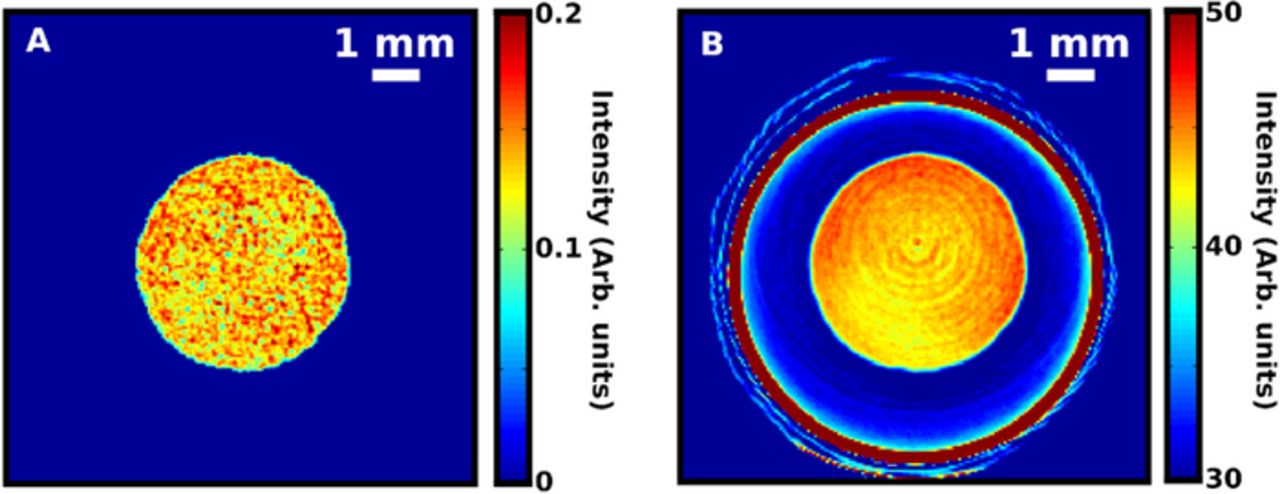
Figure 4. (a) Intensity of the LiCoO2 (003) peak, determined by fitting a Gaussian curve. (b) Summed intensity in the region 20 Å−1 to 23 Å−1, where no Bragg diffraction is observed.
The crystallographic orientation of individual cathode grains can greatly influence the Li ion transport processes in electrode materials.22 In the case of LiCoO2, where the lithium diffusion is two-dimensional, the optimized alignment of crystallographic planes can affect the resulting electrochemical performance.23,24 Therefore, investigation of the preferred orientation of the LiCoO2 particles in the film is of great interest. Here we describe an approach for quantifying texture as a function of position in the cathode by using CT to reconstruct a crystallographic texture map, texture-CT without imposing a structural model on the data. The intensity map of the 003 peak shown in Figure 4a is obtained by azimuthally integrating around the Debye-Scherrer rings in the 2D image of the diffraction pattern. However, if we consider the raw 2D data frames, the 003 peak does not show constant intensity as a function of azimuthal angle. This is shown in Figure 5a, which is a raw 2D frame obtained when scanning the center of the 2nd layer containing mostly LiCoO2. The azimuthal dependency of the 003 peak around the ring directly indicates strong preferred orientation effects of the LiCoO2 particles along the c-direction. This is not clear in SEM images (Figure 1) of the cathode material, where large, inhomogeneous particles are observed and not ordered platelets, which would usually give rise to strong preferred orientation. To analyze the crystallographic texture, the azimuthal dependency of the intensity was investigated. For each single 2D pattern, a narrow 2θ band centered on the 003 peak was integrated from 0.5° < 2θ < 1.7° and this intensity was plotted as a function of azimuthal angle. A CT reconstruction of these azimuthal intensity plots was then carried out, to obtain the azimuthal intensity distribution for each pixel in the image. An example of one of these plots is shown in Figure 5b. A sharply peaked azimuthal intensity distribution indicates a high degree of preferred crystallite orientation, whereas a flat line (infinitely wide peaks) would occur if the particles were completely randomly oriented. To map the crystallographic texture, the reconstructed azimuthal intensity distribution in each pixel was therefore fitted with a Gaussian function and the width mapped in Figure 5c. The highly textured areas (narrow peaks), are indicated by the green and yellow areas in the plot. The very edge of the cathode shows high values for the peak width (dark red color), but these are somewhat unreliable as the peak intensity itself is very low in these pixels at the edge of the cathode and the fitting not reliable. Nevertheless, the texture-CT image indicates that significant variations in the degree of preferred orientation are seen throughout the cathode film, showing that the crystallographic texture is quite inhomogeneous. To fully correlate the intensity speckles with the texture and amount of LiCoO2 on the cathode film, modeling of the LiCoO2 density, preferred orientation, as well as a further analysis of noise effects is needed. However, this is limited by the data quality and beyond the scope of the paper.

Figure 5. (a) Azimuthal intensity distribution in the 003 peak of a raw data frame. (b) Plot of reconstructed intensity versus azimuthal angle. The intensity has been fitted with a Gaussian function to determine the width of the peak. (c) Map of azimuthal peak width in the 2. layer. Narrow peak width values show high degree of preferred orientation, as seen by the yellow and green areas.
Conclusions
The use of XRD-CT for the study of Li-ion and Ni/MH battery components in situ presented here represents a step-change in how we can obtain quantitative data on complex systems with many different active components. We obtain a high level of structural and textural detail from the XRD-CT method, as well as observing details of the cell construction (such as the tilted cathode) without the need for a specialized battery cell design. We ascertain the nature of the cathode film within the battery cell in a non-destructive manner, revealing the power of this technique for gleaning complete structural information. Having demonstrated the feasibility of this method, we intend to continue with our studies to include ct-PDF capabilities and in operando measurements25 of functioning Li-ion battery electrodes to explore changes occurring on the nanoscale, which will go a long way in explaining spatially inhomogeneous structural differences taking place during cycling.
Acknowledgments
All authors thank the ESRF for beamtime allocation. S. A. C. and J. V. L. gratefully acknowledge funding support from the EPSRC (EP/K029290/1) and the allocation of a PhD scholarship from the University of Glasgow. B.C.M. and W.G.Z. gratefully acknowledge financial support through start-up funding provided by the Dana and David Dornsife College of Letters and Sciences at the University of Southern California. W.G.Z. also acknowledges the support by a fellowship within the Postdoc-Program of the German Academic Exchange Service (DAAD). K. M. Ø. J. acknowledges funding from the Villum Foundation Postdoc Program. S.J.L.B and X.Y acknowledge funding from Laboratory Directed Research and Development (LDRD) Program 12-007 (Complex Modeling) at Brookhaven National Laboratory, which is funded by the US Department of Energy Office of Basic Energy Sciences grant DE-AC02-98CH10886. Authors Kirsten M. Ø. Jensen and Xiaohao Yang contributed equally to this work.