Abstract
Regular durability testing of heavy duty fuel cell systems for transit bus application requires several thousand hours of operation, which is costly and time consuming. Alternatively, accelerated durability tests are able to generate failure modes observed in field operation in a compressed time period, by applying enhanced levels of stress. The objective of the present work is to design and validate an accelerated membrane durability test (AMDT) for heavy duty fuel cells under bus related conditions. The proposed AMDT generates bus relevant membrane failure modes in a few hundred hours, which is more than an order of magnitude faster than for regular duty cycle testing. Elevated voltage, temperature, and oxidant levels are used to accelerate membrane chemical stress, while relative humidity (RH) cycling is used to induce mechanical stress. RH cycling is found to significantly reduce membrane life-time compared to constant RH conditions. The role of a platinum band in the membrane is investigated and membranes with Pt bands demonstrate a considerable life-time extension under AMDT conditions, with minimal membrane degradation. Overall, this research serves to establish a benchmark AMDT that can rapidly and reliably evaluate membrane stability under simulated heavy duty fuel cell conditions.
Export citation and abstract BibTeX RIS

This is an open access article distributed under the terms of the Creative Commons Attribution Non-Commercial No Derivatives 4.0 License (CC BY-NC-ND, http://creativecommons.org/licenses/by-nc-nd/4.0/), which permits non-commercial reuse, distribution, and reproduction in any medium, provided the original work is not changed in any way and is properly cited. For permission for commercial reuse, please email: oa@electrochem.org.
According to the World Health Organization, air pollution claimed seven million lives around the world in 2012.1 A major portion of this pollution was caused by road vehicles. Due to their zero emission operation, fuel cell buses offer a solution to air pollution in urban areas. Heavy duty fuel cell powered bus fleets in London, Hamburg, Cologne, Oslo, Whistler, and California are displaying long-term stability and durability in the field. A 2016 power plant life-time target of 18,000 hours was set for transit buses by the United States Department of Energy.2 Lab testing of fuel cell bus components and systems for such extensive periods of time is not feasible due to the high cost and long time involved. Therefore, major fuel cell developers turn to accelerated durability tests (ADTs) to estimate the durability of fuel cell systems and their components.
The membrane is a key component of fuel cells and is vital for fuel cell durability and performance. There are two main degradation mechanisms of perfluorosulfonic acid (PFSA) ionomer membranes under fuel cell operation:3 chemical and mechanical degradation. Chemical degradation of the membrane is caused by radical attack. Hydroxyl (HO•), hydroperoxyl (HOO•), and hydrogen (H•) radicals have been identified as potentially harmful to the membrane.4 Radicals can form in the catalyst layers or as a result of hydrogen peroxide decomposition in the presence of Fenton's reagents in the membrane.5–9 Hydrogen peroxide forms electrochemically as a by-product of the oxygen reduction reaction (ORR) and chemically when crossover oxygen and hydrogen meet at the cathode or anode.10–12 Polymer side chain degradation in chemically stabilized PFSA membranes is predominantly due to HO• radical attack on the first ether bond in the α-OCF2- group.13 Attack by H• may occur to a smaller extent at the tertiary carbon C−F bond on both the main and side chains, while attack by HO• occurs solely on the side chain.14 Cell voltages close to the open circuit voltage (OCV) are known to lead to high levels of chemical degradation, resulting in a gradual loss of membrane material, observed as general membrane thinning and fluoride release in the effluent water.15 Adequate humidification of the membrane is crucial for membrane durability, since fuel cell operation at dry conditions leads to increased membrane degradation.16,17 Chemical stabilization of PFSA polymer end groups18 and use of additives, such as cerium and manganese radical scavengers are potential methods to mitigate chemical degradation.19,20 Chemical membrane degradation has a strong impact on mechanical membrane properties21 due to molecular weight reduction.
The resulting mechanical stress from frequent swelling and shrinking of the constrained membrane in response to changes in water content results in membrane creep, fatigue,22 and the formation of pinholes, cracks, and tears on the surface or in the bulk of the membrane.23 Membrane stiffness and strength was found to decrease when exposed to humidity cycling at high temperatures.22,24–28 The mechanical endurance of membranes can be enhanced by physical reinforcement of the membrane using a porous polymer matrix, fibers, or inorganic reinforcement.29
Coupled chemical and mechanical stressors have however been found to exacerbate membrane degradation compared to chemical and mechanical degradation applied separately.30–33 The impact of combined chemical and mechanical degradation on membrane durability was investigated in our group under Ballard Power Systems' cyclic open circuit voltage (COCV) AST protocol.34 Results of mechanical testing showed a rapid reduction in CCM ductility and fracture strain together with a significant decrease in ultimate tensile strength (UTS) as a function of AST cycles.35 During combined chemical and mechanical membrane degradation, mechanical stress can affect chemically weak regions of the membrane first, since they tend to be the least resistant to humidity changes and therefore more prone to damage. The failure modes of combined chemical and mechanical membrane degradation include localized membrane thinning (divots), pinholes with rough edges, tears, and microcracks.
The effect of platinum in the membrane on membrane durability is subject to debate. Platinum is known to be unstable at high voltages, and can hence dissolve, migrate out of the catalyst layer, and deposit in the membrane.36,37 The partial pressure of crossover H2 from the anode is relevant for Pt band formation, because H2 reduces Pt ions to form metallic Pt in the membrane.38 The location of the Pt band is determined by the local mixed potential distribution.39–42 Many authors believe that Pt in the membrane increases membrane degradation.43–47 Synthetic methods of planting Pt in the membrane have been shown to have a detrimental effect on the membrane,48,49 where platinum ions can act as a Fenton's reaction promoter.50,51 However, in our group, field operated MEAs with a naturally grown metallic Pt band in the membrane were tested under COCV AST conditions, and vastly outperformed freshly manufactured membranes in terms of durability.52
The objective of the present work is to develop an Accelerated Membrane Durability Test (AMDT) protocol for heavy duty fuel cells based on the characteristic duty cycle of transit buses. In contrast to generalized screening methods such as the COCV AST, the proposed AMDT conditions are much milder, yielding more realistic application oriented results, in this case for heavy duty bus fuel cells. Due to its close resemblance to bus conditions, the AMDT will provide an accurate evaluation of membrane stability for fuel cell bus operation. Additionally, the role of humidity cycling and platinum in the membrane will be investigated under AMDT conditions. This work is expected to aid the fundamental understanding of membrane degradation under fuel cell bus conditions.
Experimental
Membrane electrode assembly (MEA) fabrication
Catalyzed gas diffusion electrodes (GDEs) were fabricated by coating a micro-porous layer made of polytetrafluoroethylene (PTFE) and carbon black on a non-woven carbon paper gas diffusion layer substrate, followed by coating a catalyst layer consisting of carbon-supported platinum catalyst and perfluorosulfonic acid ionomer.53 MEAs were prepared by hot-pressing a standard non-reinforced PFSA ionomer membrane with anode and cathode GDEs.
Stack assembly and test station
MEAs were used to build a 10 cell stack with graphitic bipolar plates having co-flow parallel straight channels. A pressurized bladder ensured uniform compression between MEAs and bipolar plates. External and internal gas leak tests were done before installation of the stack on a test station. AMDTs were run on Ballard Power Systems' fully automated standard test hardware. The stack was conditioned for 24 hours prior to the AMDT in order to equilibrate the membranes. The proposed AMDT test conditions are described in the following section.
Accelerated Membrane Durability Test (AMDT)
Baseline AMDT protocol
Since the 2010 Winter Olympics, 20 fuel cell transit buses powered by Ballard HD6 modules operated in Whistler Resort Community in British Columbia, Canada for four years. This was the largest fuel cell hybrid bus fleet in the world, which successfully endured temperatures between −12°C to 27°C, snowfall from November to May, and a very challenging terrain with frequent up and down hill driving. The development of the AMDT for heavy duty fuel cell vehicles is based on a thorough characterization of the Whistler HD6 duty cycle for key stressors, their levels, and occurrence. The protocol uses constant and time dependent bus fuel cell stressors at elevated levels. All stressor levels were carefully chosen to avoid failure mode artifacts.
Buses often idle at traffic lights, stop signs, or bus stops, leading to extended periods at elevated voltage, which is known to chemically degrade the membrane. The baseline AMDT therefore applies chemical stress by maintaining the stack voltage at 9 V, simulating bus idling conditions. Due to regular acceleration and deceleration, transit buses have a highly dynamic duty cycle, which results in frequent humidity fluctuations. In the Whistler fleet, the humidity mildly dropped during acceleration and then quickly returned back to a fully saturated state once the level of demanded load was reduced. The amplitude of changes in humidity was smaller than 10% RH and short in duration, meaning that the membrane may not have experienced excessive swelling or shrinking, although its repetitive nature could eventually cause mechanical degradation over time. The baseline AMDT achieves RH cycling by bypassing the cathode humidifier for 66 seconds every 10 minutes, causing the RH to gradually dip to approximately 60% RH at the cathode. The total membrane RH during the dry cycle is estimated to drop to 80% RH, since the anode remains fully humidified, still generating more aggressive fluctuations in RH than in the bus. The ratio of the membrane resistivity measured during the wet and dry cycle was used to estimate the RH during the dry cycle, based on the corresponding conductivity and water content levels known for 100% RH.54,55
Idling and changes in humidity naturally occur in close proximity during driving. Therefore the baseline AMDT uses chemical and mechanical stressors simultaneously, simulating the real bus operating conditions. Additionally, elevated temperature and oxygen concentration are known to increase the rates of both chemical and mechanical membrane degradation processes without altering the failure modes. Buses generally use oxygen from the air in the surrounding environment as oxidant, which contains 21% oxygen. Increased oxygen availability allows for increased formation of radicals. To ensure rapid membrane failure the temperature and oxygen partial pressure used in the AMDT are 85ºC and 45%, respectively, which are both elevated compared to bus conditions. Hydrogen and oxygen are used as reactant gases at flow rates of 5 and 10 slpm, respectively. These flows are intentionally high, considering the low load of only ∼ 1A, in order to ensure complete MEA surface coverage and avoid the formation of regions deficient of reactants. The backpressure is set to 0.1 barg, but generally fluctuates by around 0.03 barg during the test.
Complementary AMDT protocols
Complementary tests with certain adjustments to the baseline AMDT protocol were designed to investigate the state of degradation at leak initiation and the effects of RH cycling and platinum in the membrane (PITM) on membrane durability. The temperature and oxidant levels were kept at 85ºC and 45% O2, respectively, in all complementary testing. The early stage of membrane degradation was investigated in the initiation test, which applied the baseline AMDT conditions until initial hydrogen leaks across the membrane were detected by means of increased voltage fluctuation. Tests at 90% and 100% constant RH were performed to better understand the effect of RH cycling. The life-time difference between the tests at constant RH and the baseline AMDT is due to RH cycling, which is included in the baseline AMDT. The effect of PITM was studied using membranes with an artificially deposited Pt band tested under baseline AMDT conditions. Tests with PITM are considered to be more realistic, since a Pt band forms in membranes under bus operating conditions. The tests with PITM used a proprietary Ballard protocol to generate a Pt band in the membrane either before or during the baseline AMDT operation. The first test denoted by PITM-1 used Pt band generation prior to exposing the modified membranes to baseline AMDT conditions. The second test denoted by PITM-2 integrated the Pt band generation into the baseline AMDT protocol by running one Pt band generating cycle after every 6th RH cycle of the baseline AMDT. The baseline and complementary AMDT conditions are summarized in Table I.
Table I. Summary of the AMDT runs and obtained life-times.
| AMDT Name | Condition | Pt band protocol | Life-time (h) |
|---|---|---|---|
| Baseline | Baseline | - | 298 |
| Initiation | Baseline | - | 131 |
| 90% RH | 90% RH | - | 497 |
| 100% RH | 100% RH | - | 643 |
| PITM-1 | Baseline | Prior to AMDT | 405 |
| PITM-2 | Baseline | Integrated in AMDT | 662 |
Diagnostic Methods
External and internal gas leak tests were performed every 48 hours to assess the membrane condition. The stack was considered failed at an internal leak rate of 100 sccm, corresponding to the limiting leak rate through the membrane of 10 sccm per cell suggested by the US Department of Energy.56 After failure, the stack was disassembled followed by individual MEA leak test and analysis under an Infra-Red camera (Kaiser RTI T620 FLIR) to identify the approximate location and size of leaks. In the IR camera test, hydrogen was supplied under a firmly fixed MEA in a custom fixture and reacted with oxygen from air when allowed to leak through holes in the membrane. The resulting heat generation was captured by the IR camera.
The least and most damaged MEAs were further inspected by a Philips XL30 scanning electron microscope (SEM). Samples were prepared by casting MEAs in epoxy pucks, which were polished in a Struers TegraPol-11 polisher with 120–1200 grit silicon carbide paper, and then carbon coated with an Edwards Scancoat Six Sputter Coater. Micrographs were taken using a backscatter detector at 20 kV. The membrane thickness was measured in 12 different spots and the morphology of transfers was found in cross-sectional and surface images. Membrane thinning was considered present when the final membrane thickness was below three standard deviations of the initial thickness. The fluoride concentration was measured from effluent water and the total fluoride loss was calculated using a method described elsewhere.34
Ex-situ mechanical testing
Ex-situ mechanical testing was done on the beginning-of-life (BOL) and AMDT degraded membranes. Tensile tests were used to compare the mechanical properties of samples degraded by combined chemical and mechanical degradation (baseline AMDT), isolated chemical degradation (constant RH), and in the presence of PITM. To ensure consistency, MEAs were cut into rectangular shapes (25 × 2 mm) along the transverse direction using a plotter cutter machine. The gas diffusion layers (GDLs) were removed from the MEA and the remaining CCM was stored between glass slides at ambient conditions to keep the samples straight before testing. Tensile tests were conducted using a dynamic mechanical analyzer (TA Instruments Q800 DMA) equipped with an environmental chamber (TA Instruments DMA-RH accessory). Tensile test samples were loaded with a 5:1 gauge length to width aspect ratio to prevent introduction of edge stress concentration.24 The rest of the sample length was gripped by lower and upper clamps. The average membrane width and thickness was measured using an optical microscope for all samples and SEM for representative samples, respectively. The exact sample gauge length was measured by the DMA prior to the tensile test initiation. After equilibration at the desired conditions, tensile tests were conducted at room conditions (23°C and 50% RH) and fuel cell conditions (70°C and 90% RH) at a low strain rate (0.01 min−1) on BOL and AMDT degraded samples. The tensile test was continued until it either reached mechanical failure or the DMA maximum clamp travel length of around 26 mm (160% total elongation). The elastic modulus, ultimate tensile strength (UTS), and final strain were calculated from the stress – strain curves. The elastic modulus was determined from the maximum slope of a 5th order polynomial fit to the initial section between 0 and 0.5% strain.24 The UTS and final strain were calculated as the maximum tensile stress and total strain (elastic and plastic) tolerated by the CCM during the tensile test, respectively. Under each environmental condition and AMDT type, the average and standard deviation of three repetitive tests were calculated. The error bars on the curves represent ±2σ, which statistically covers 95% of inputs.
Results and Discussion
In order to accelerate membrane degradation, the baseline AMDT applied combined chemical and mechanical stress by using high voltage, temperature, oxygen concentration, and RH cycling. As a result, the life-time of membranes subjected to the baseline AMDT was reduced by more than an order of magnitude compared to real bus operating conditions. In contrast, the AMDT life-time was approximately twice as long as the average life-time obtained with the more aggressive COCV AST.34 Since the AMDT conditions were designed to closely resemble actual operating conditions, it successfully generated failure modes similar to those found under bus conditions. As expected there was a correlation between AMDT conditions and the length of the membrane life-time. RH cycling significantly reduced membrane life-time compared to constant RH conditions. A lower constant RH level also resulted in reduced membrane life-time compared to fully humidified conditions. PITM was found to visibly prolong membrane life-time under baseline AMDT conditions. A summary of the obtained membrane life-times at baseline conditions vs. complementary AMDT conditions is shown in Table I.
The baseline AMDT failed at 298 h due to coupled chemical-mechanical stress. In the absence of humidity cycling, the 90% and 100% constant RH AMDTs degraded the membrane in a purely chemical manner, resulting in longer membrane life-times than the baseline, 497 h and 643 h, respectively. This demonstrates that combined chemical and mechanical stress indeed enhances membrane degradation, not only by adding mechanical stress, but also due to the short periods of increased chemical degradation at low RH during the dry cycle. The difference in membrane life-time between the two tests at constant RH is evidence of a higher rate of chemical membrane degradation at lower RH due to increased rates of gas crossover and hydrogen peroxide formation,38,57–59 and thereby increased radical formation via Fenton's reaction. Although it is known that the membrane gas permeability decreases at lower RH,10 there is a counteracting effect whereby the oxygen concentration increases due to the reduced water vapor pressure at a fixed absolute pressure. In the present case, the water vapor pressure at 85°C is 0.58 bar at 100% RH and 0.52 bar at 90% RH. With a 45% oxygen concentration in the dry gas, the oxygen partial pressures at 100% and 90% RH are 0.25 and 0.27 bar, respectively, which represents an 11% increase at 90% RH. Membrane permeability depends on the gas diffusion coefficient, which changes with humidity. By lowering the RH from 100% to 90%, the oxygen diffusion coefficient decreases by around 7%.60 Therefore, the effect of increased oxygen partial pressure dominates over the effect of reduced permeability by roughly 4%, which actually leads to increased oxygen crossover to the anode. Mechanical stress during RH cycling appears to have gradually exacerbated the effect of chemical degradation,30 causing chemically weak areas of the membrane to become more vulnerable to tearing and cracking. The presence of a Pt band in the membrane showed significant life enhancing effects on membrane durability by vastly outperforming the baseline AMDT by lasting 405 h and 662 h with the two PITM application methods, offering evidence that Pt in the membrane is capable of mitigating membrane degradation.
Hydrogen leaks and voltage decay
Membrane holes were allowed to grow until the stack leak rate reached or exceeded 100 sccm in all AMDTs, except for the initiation AMDT, which was stopped at 131 h, when the first indicators of membrane damage occurred. Indicators of membrane damage include increased voltage fluctuations and voltage decay. The morphological changes present in the membrane prior to hole growth, which is mainly a thermal process, were studied in order to better understand the initial degradation process.
Each test displayed different membrane leak rate development characteristics over time, as shown in Figure 1. The baseline showed short initiation and leak growth times. Chemically degrading conditions at 90% constant RH may have resulted in a shorter initiation time, but allowed for a relatively long leak growth time, eventually exceeding the baseline life-time. The 100% constant RH test had the mildest conditions, and as expected, displayed longer initiation and leak growth periods compared to the baseline and 90% RH runs. This pattern suggests the action of mechanical stress due to RH cycling as an accelerator for membrane rupture and leak growth. The initiation and leak growth periods of the tests with PITM resemble those of the constant RH tests, despite being exposed to baseline AMDT conditions, including RH cycling. The longer leak growth times at constant RH and with PITM confirm that MEAs are able to operate for a relatively long time despite the presence of small leaks, when the conditions are favorable;59 i.e., low mechanical stress in the case of constant RH and low chemical stress in the case of PITM.
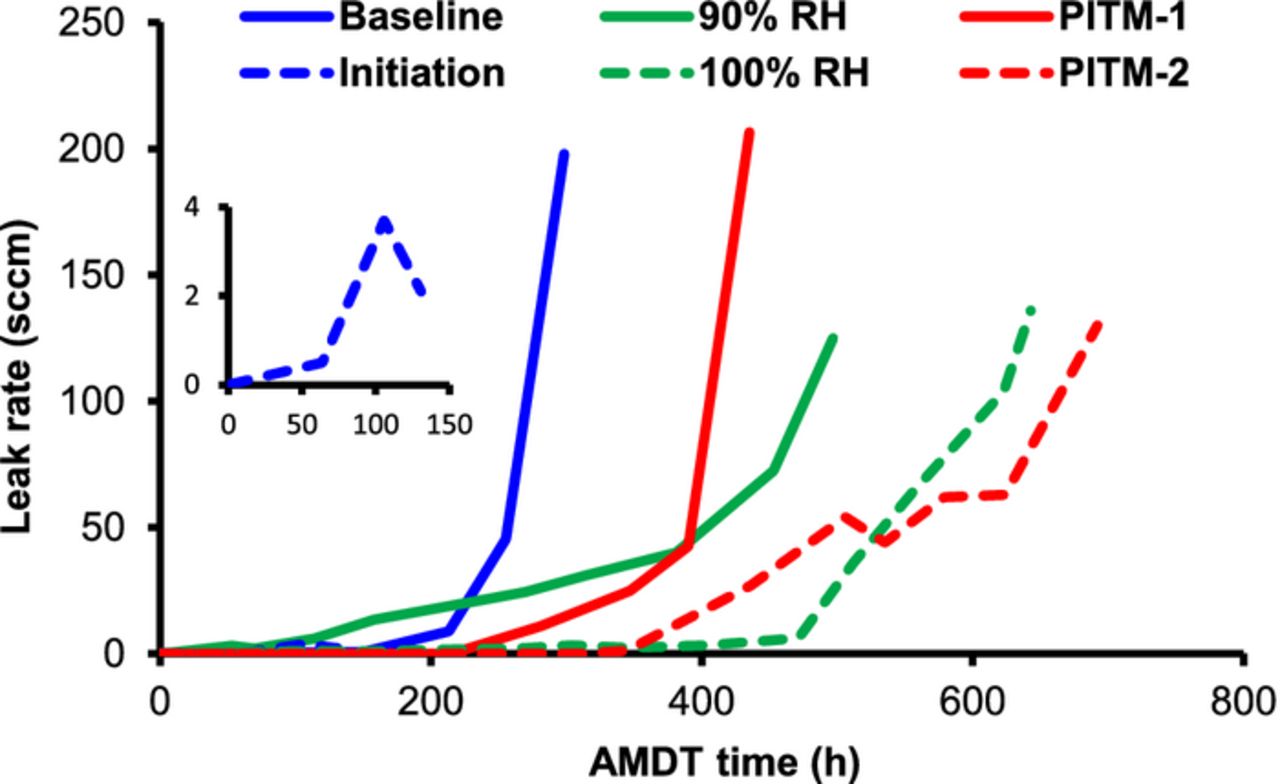
Figure 1. Hydrogen leak rate development during AMDT operation, showing slower leak growth at constant RH (green) and with PITM (red), compared to baseline (blue full). The initiation test (blue dashed) was stopped after leak initiation, in order to investigate the early stage of degradation.
The initiation AMDT was stopped at 131 h (Figure 1, insert) when the stack first started to exhibit increased voltage fluctuations and voltage decay, as shown in Figure 2. The initial voltage fluctuations in the beginning of the test may be due to different permeation rates of hydrogen through the healthy membranes during RH cycling. However, after the formation of leaks, the convective hydrogen flux to the cathode results in mixed potentials at the cathode, causing an increase in the amplitude of fluctuations, and the onset of voltage decay.
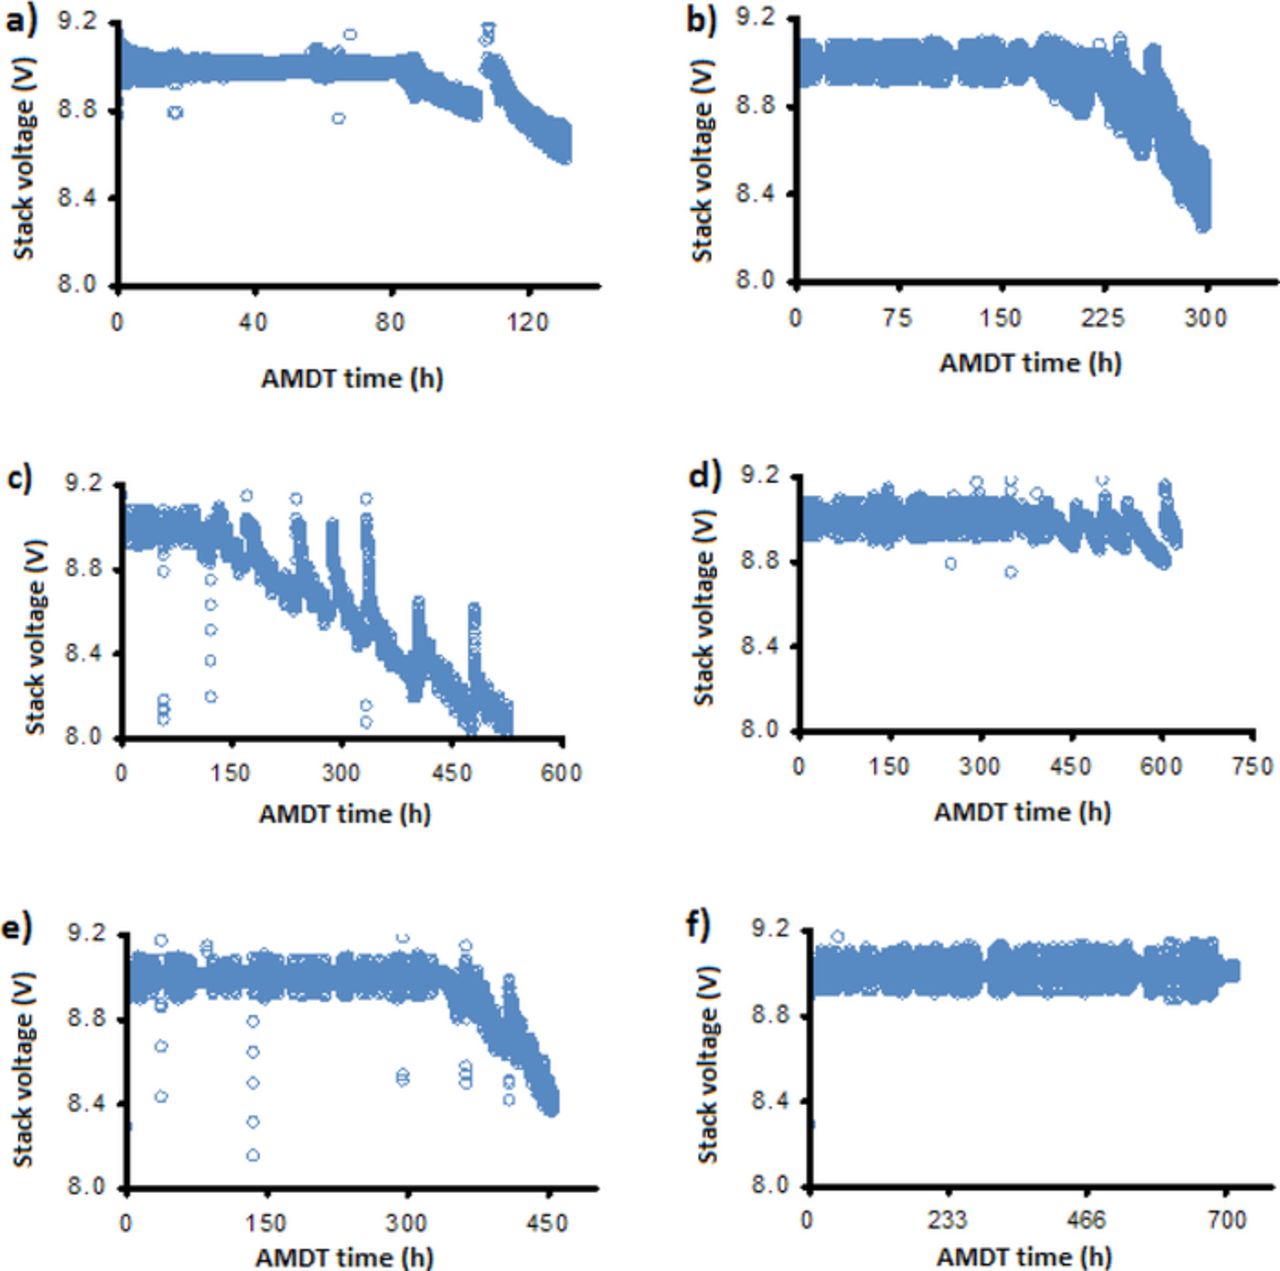
Figure 2. Voltage fluctuations and voltage decay of the various AMDT runs: a) initiation; b) baseline; c) 90% RH; d) 100% RH; e) PITM-1; and f) PITM-2.
The formation and growth of new transfers over time resulted in further voltage drops, which can be correlated to the measured leak rate development seen in Figure 1. The baseline, for instance, exhibits a major voltage drop around 200 h in Figure 2b, which can be seen as the final largest increase in leak rate in Figure 1. The initiation, baseline, and PITM-1 voltages dropped significantly from 9.0 V to around 8.6, 8.3, and 8.4 V, respectively. The 90% RH had the most severe final voltage drop, reaching 8.0 V. On the other hand, the 100% RH voltage and PITM-2 stayed mostly above 8.8 and 8.9 V, pointing to a very small amount of MEAs with holes, which was later confirmed.
Similarly, open circuit voltage (OCV) decay is related to hydrogen leaks caused by membrane degradation and is therefore a good indicator of membrane health. The OCV can also drop due to increased hydrogen crossover rates through local regions of thinned membrane. The measured OCV results are provided in Figure 3 for the various AMDT runs.
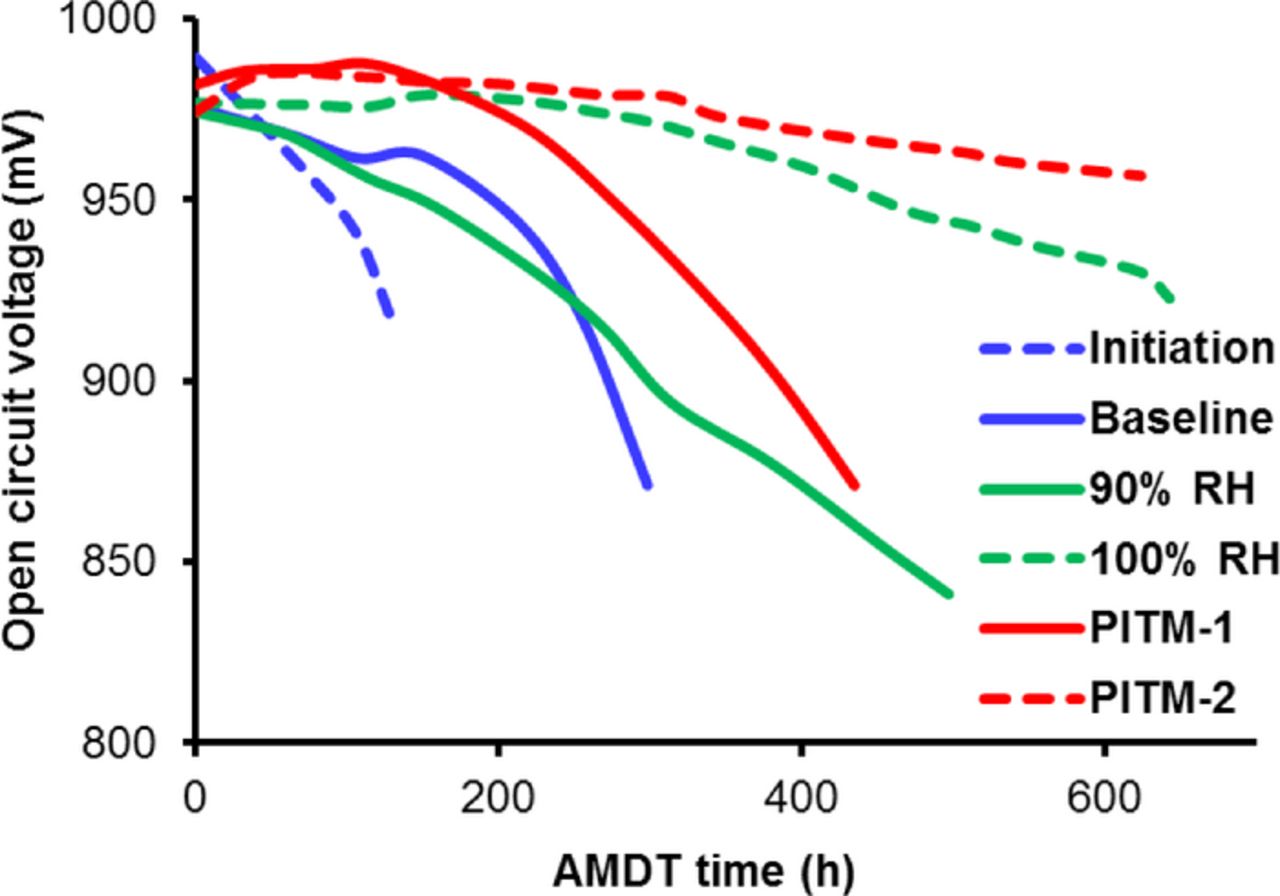
Figure 3. Open circuit cell voltage decay during AMDT operation, which is primarily a consequence of hydrogen leaks across the membranes.
The OCV decay curve can be separated into two parts. The first part represents the initiation time with as lower decay rate and the second part represents the leak growth phase with a much faster decay rate. As expected, the initiation and baseline AMDTs showed the fastest OCV decay, due to rapid leak formation and growth, causing all 10 cells to develop fairly large leaks in both cases. Interestingly, the 90% RH test showed an equally rapid decay rate as the first part of the baseline, indicating a similar level of membrane degradation to the baseline, suggesting that the initial phase of the baseline is dominated by chemical degradation. In later stages however, the effect of RH cycling gradually increased the degradation rate toward early failure for the baseline, while the 90% RH degradation rate remained constant during the entire testing period. At a later point in time the 90% RH OCV drop exceeded the OCV drop of the baseline, and similarly, all 10 cells were found to have developed leaks. The 100% RH test showed no signs of OCV decay in the first phase, in good agreement with its long initiation time, but once 3 out of 10 membranes developed leaks, the OCV decay rate mildly increased. The PITM tests experienced the lowest level of OCV decay rates and OCV drops, corresponding to long initiation times and few damaged cells. PITM-1 had 6 leaky membranes out of 10, while PITM-2 had only 2 leaky membranes despite having the longest test duration. This is a powerful indicator of the ability of the PITM to mitigate and reduce chemical degradation and thereby substantially extend the membrane stability and life-time.52
Performance loss
The performance of the AMDT stacks was periodically monitored by measuring polarization curves. Beginning of Life (BOL), Middle of Life (MOL), and End of Life (EOL) polarization curves are shown in Figure 4. The OCV decay observed here is consistent with the previous findings. The decay of the fuel cell performance is correlated to membrane degradation and observed consistently across all current densities. This decay can be attributed to increasing activation losses at MOL and EOL due to convective hydrogen crossover flux through the membrane.34 The voltage losses at non-zero current densities were however lower than at OCV; for instance, the baseline had a performance loss of about 30 mV compared to an OCV loss of 100 mV.
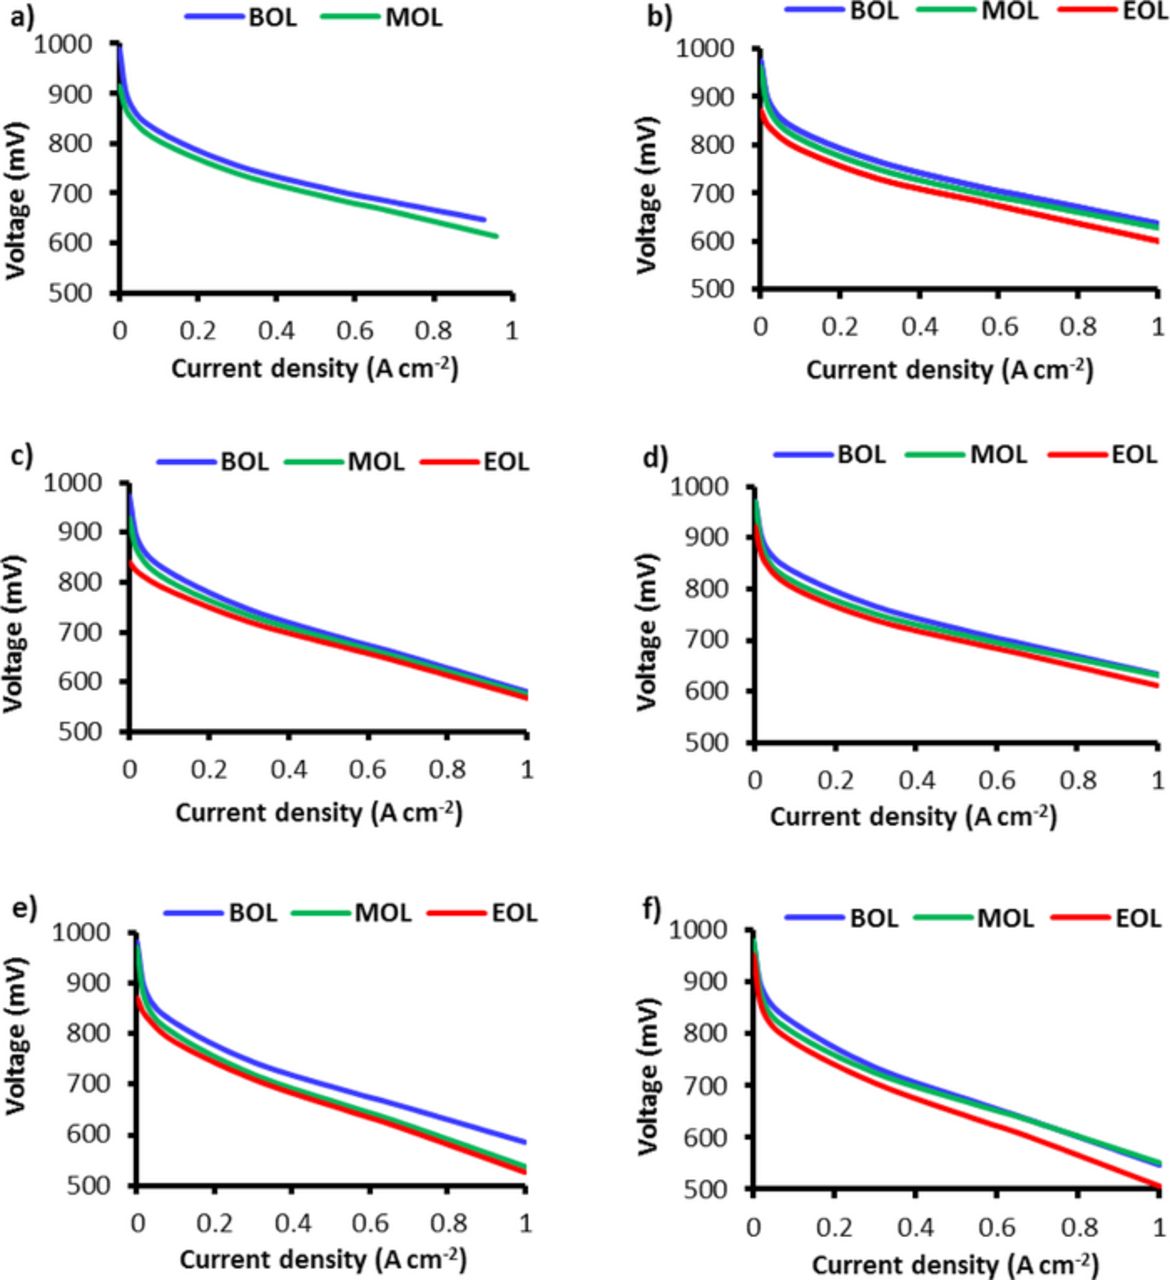
Figure 4. Polarization curve decay of the various AMDT runs: a) initiation; b) baseline; c) 90% RH; d) 100% RH; e) PITM-1; and f) PITM-2.
Membrane thinning and fluoride loss
Membrane thinning was prevalent in the AMDT degraded samples. Figure 5 shows the average membrane thickness loss in the different AMDT samples compared to the BOL membrane. It can be seen from Figure 5 that the baseline and constant RH samples experienced significant membrane thinning, while the membrane thickness in the PITM samples remained mostly unchanged. Membrane thinning is considered evidence of chemical degradation, which was effectively mitigated in the PITM samples. Although the constant RH samples exhibited more membrane thinning than the baseline, it should be mentioned that constant RH samples were exposed to AMDT stressors for a longer time before failure compared to the baseline samples; hence they experienced more chemical degradation, leading to general membrane thinning in all locations. The thinning level of the initiation sample was however similar to that of the baseline despite its shorter AMDT duration. Hence, the majority of the global chemical degradation is expected to occur during the initiation phase. The baseline membranes exhibited the most severe membrane thinning at the outlets, while membrane thinning was observed at both the inlets and outlets of the initiation membranes. The baseline AMDT thinning levels are roughly half of the COCV AST, which had a 48% membrane thickness loss in only half of the testing time.34 This is due to much milder AMDT conditions compared to AST conditions.
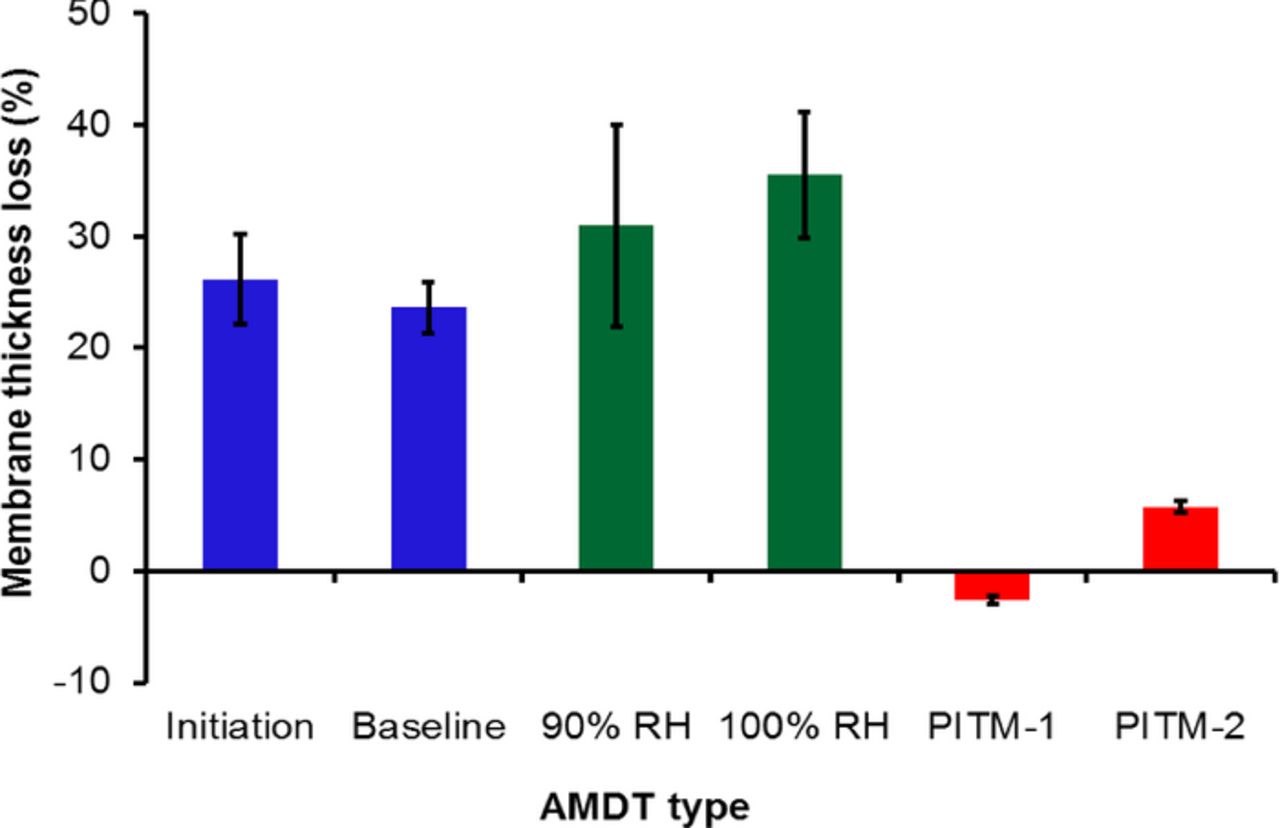
Figure 5. Membrane thinning (thickness loss, in % of original thickness) measured by SEM at the end of life of the various AMDT runs.
Fluoride release is another important indicator of chemical membrane degradation which was monitored periodically during the experiments. The cumulative fluoride release data in Figure 6 show that the AMDT fluoride loss was generally in good agreement with the thickness loss, which confirms the findings reported above. The relative rates of chemical membrane degradation can be assessed by comparing the slopes of the curves; the baseline had the highest rate followed by the 90% RH, 100% RH, PITM-1, and PITM-2 conditions, which is consistent with the relative severity of the chemical stressors in each case. The baseline thinning rate was approximately equal to its fluoride release. However, the constant RH runs showed higher thinning than fluoride release combined with a relatively large variability. The suppressed rate of fluoride removal from the degraded membranes in this case may be due to the absence of liquid water dynamics otherwise induced by RH cycling. The PITM runs showed very low fluoride release which is consistent with the thinning results. The effluent water of the initiation AMDT was not collected; hence there is no fluoride loss data available for this run.
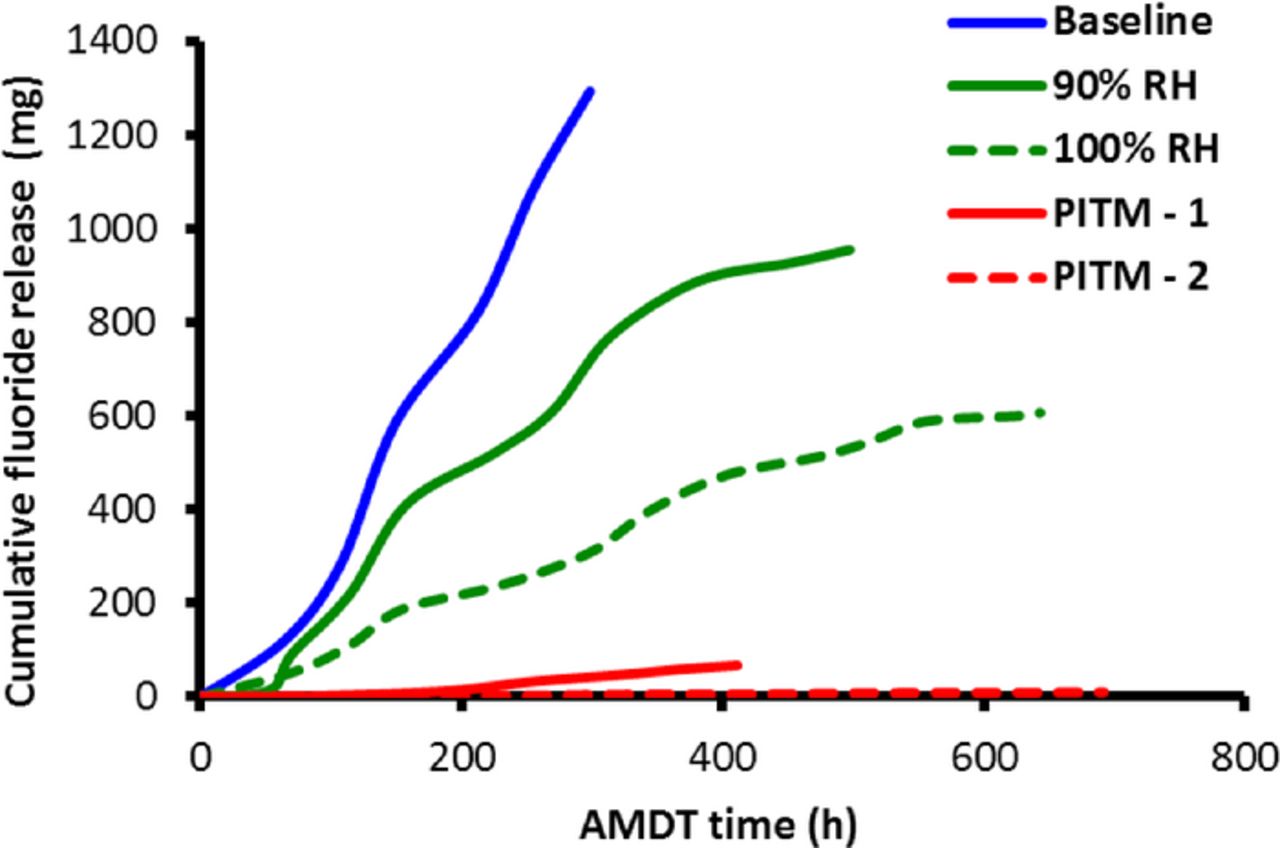
Figure 6. Cumulative fluoride release during AMDT operation, obtained from conductivity measurements on the effluent water from the stacks.
Failure analysis
Membrane holes and fracture sites are indicative of the regions exposed to the most aggressive levels of degradation. Figure 7 shows representative SEM images of the different failure modes observed in the AMDTs.
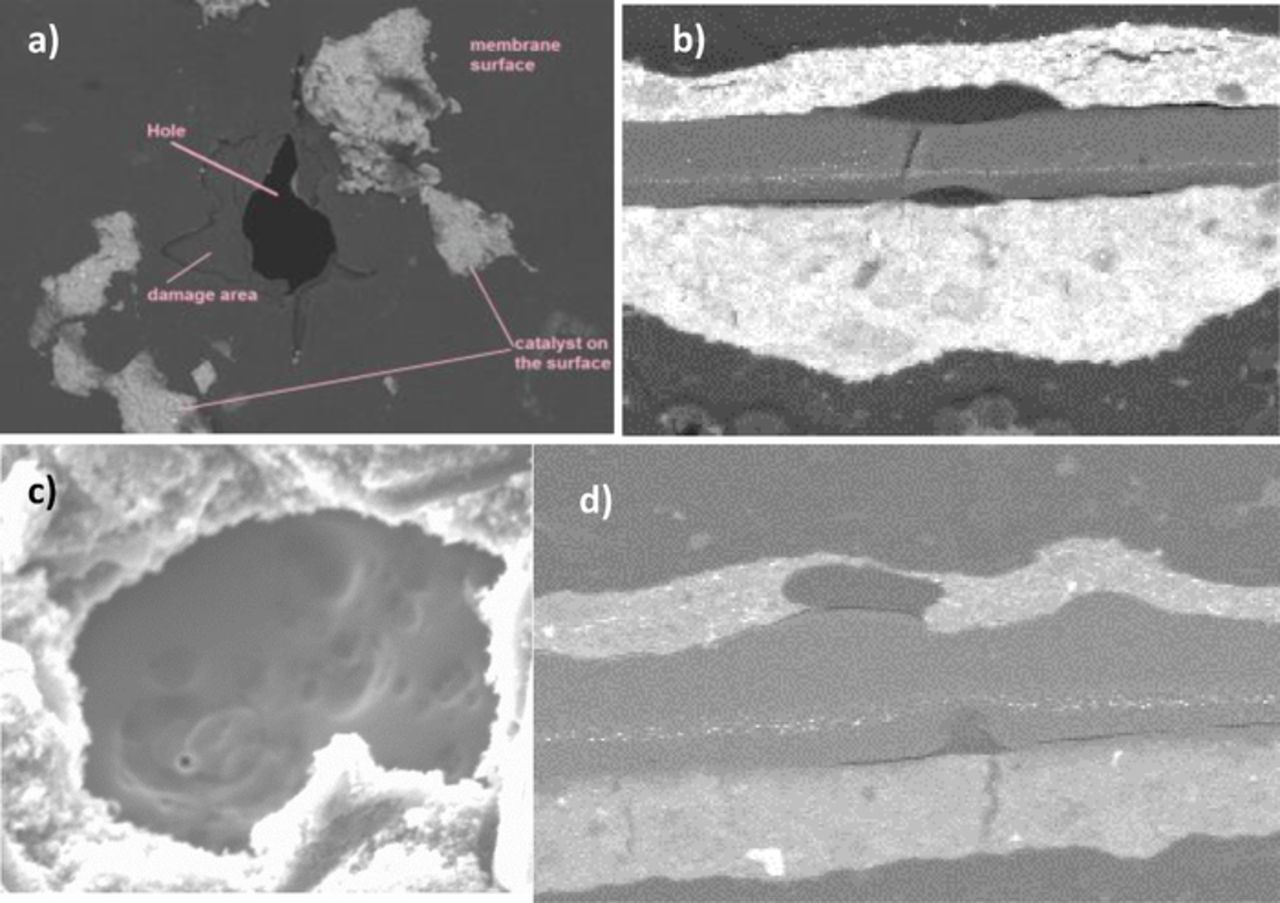
Figure 7. Representative SEM images of the membrane damage induced by AMDT operation: a) baseline; b) initiation; c) constant RH; and d) PITM AMDT runs.
The baseline AMDT generated membrane holes of 50–300 μm diameter with a hole count density of 2.9 holes per cm2. The mechanical stress during RH cycling of the baseline AMDT is assumed to be responsible for the rough character of transfers seen as cracks and tears around the holes, shown in the SEM micrograph in Figure 7a. The initiation leaks had an average diameter of 200 μm with 1.3 holes per cm2. The initiation MEAs exhibited divot and crack formation from both the anode and cathode sides (Figure 7b). The membranes also showed holes with rough edges similar to the baseline, as a result of combined chemical and mechanical degradation. Delamination between the membrane and catalyst layers was also commonly observed for both tests, presumably due to membrane degradation at the interfaces. Only one 40 μm hole was found in the 90% RH membranes (0.04 holes per cm2). The 100% RH membrane had an average hole diameter of 40 μm with 1.2 holes per cm2. The surfaces around the holes were smooth in both AMDTs at constant RH, with areas of chemically eroded membrane, seen in Figure 7c. Due to the absence of mechanical degradation there were almost no cracks or fractures and all damage appeared to be chemical in nature. Only one divot was found in PITM-1, and 0.68 holes per cm2 were identified. Only two cells failed due to large leaks in PITM-2 while the remaining eight cells were still in good condition. One divot and 0.33 holes per cm2 were found. The character of holes in PITM-1 and PITM-2 was of combined chemical and mechanical stress, where the surrounding areas were irregular with rips and tears, similar to the baseline and initiation tests. Divots appeared in local regions without a platinum band, indicating lower chemical degradation mitigation capabilities in these areas, such as those observed in Figure 7d. It is anticipated that divots formed in these areas would eventually grow to holes such as those observed in Figure 7a due to combined chemical and mechanical degradation. This suggests that while the Pt band is effective in mitigation of chemical degradation, a complete coverage is essential in order to avoid local degradation and damage.
Pt band location and concentration
The Pt concentration in the Pt band from inlet to outlet of the PITM membranes is shown in Figure 8. The membranes had the highest Pt concentration at the outlet and a lower concentration at the middle and inlet positions, in good agreement with the primary location of holes at the inlet. PITM-1 membranes displayed a wide Pt band located at a distance of 33% of the membrane thickness from the cathode interface, with Pt concentrations between 2,000 and 18,000 ppm in the band. In PITM-2, a Pt band was observed at a distance of 40% from the cathode, with Pt concentrations between 11,000 to 43,000 ppm. It is believed that the higher PITM concentration of PITM-2 was responsible for the life-time extension compared to PITM-1, in particular due to a better coverage at the inlet region where gaps in the Pt band were found to allow local chemical degradation. The Pt concentration in the band also appeared to decrease in regions adjacent to large catalyst layer delamination sites, in good agreement with the locations of transfers.
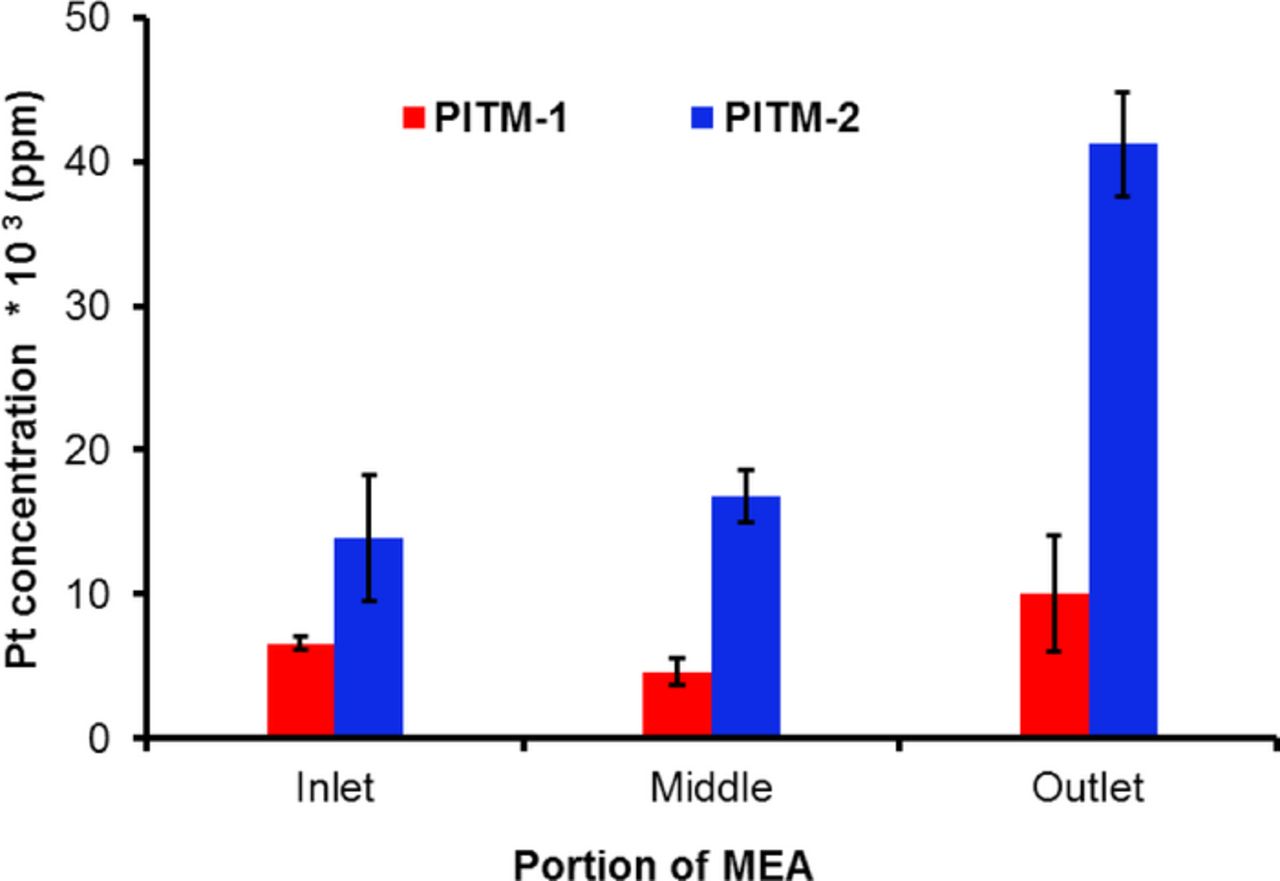
Figure 8. Pt concentration at the Pt band location in the membrane from inlet to outlet (at end of life) for the two AMDT runs with PITM.
Mechanical properties
Tensile tests were conducted for AMDT degraded (EOL) catalyst coated membranes (CCMs) as well as fresh (BOL) CCMs in order to evaluate the effect of different AMDT stressors on the mechanical properties. Figure 9 illustrates the representative stress – strain curves of different AMDT samples at room and fuel cell conditions. The first curve represents the BOL and the rest are AMDT degraded samples. At room conditions (Figure 9a), BOL samples stretched well until the maximum traveling length of the DMA (∼160% strain). Among all AMDT samples, only the PITM samples resembled the ductile behavior of the BOL sample, while the baseline AMDT and constant RH samples fractured quickly, right after passing their yield stress. It is suggested that polymer chain degradation and decrease in molecular weight resulting from chemical degradation reduces the chain entanglement and allows for easier chain detachment21 leading to a much lower fracture strain in the baseline and constant RH AMDTs.
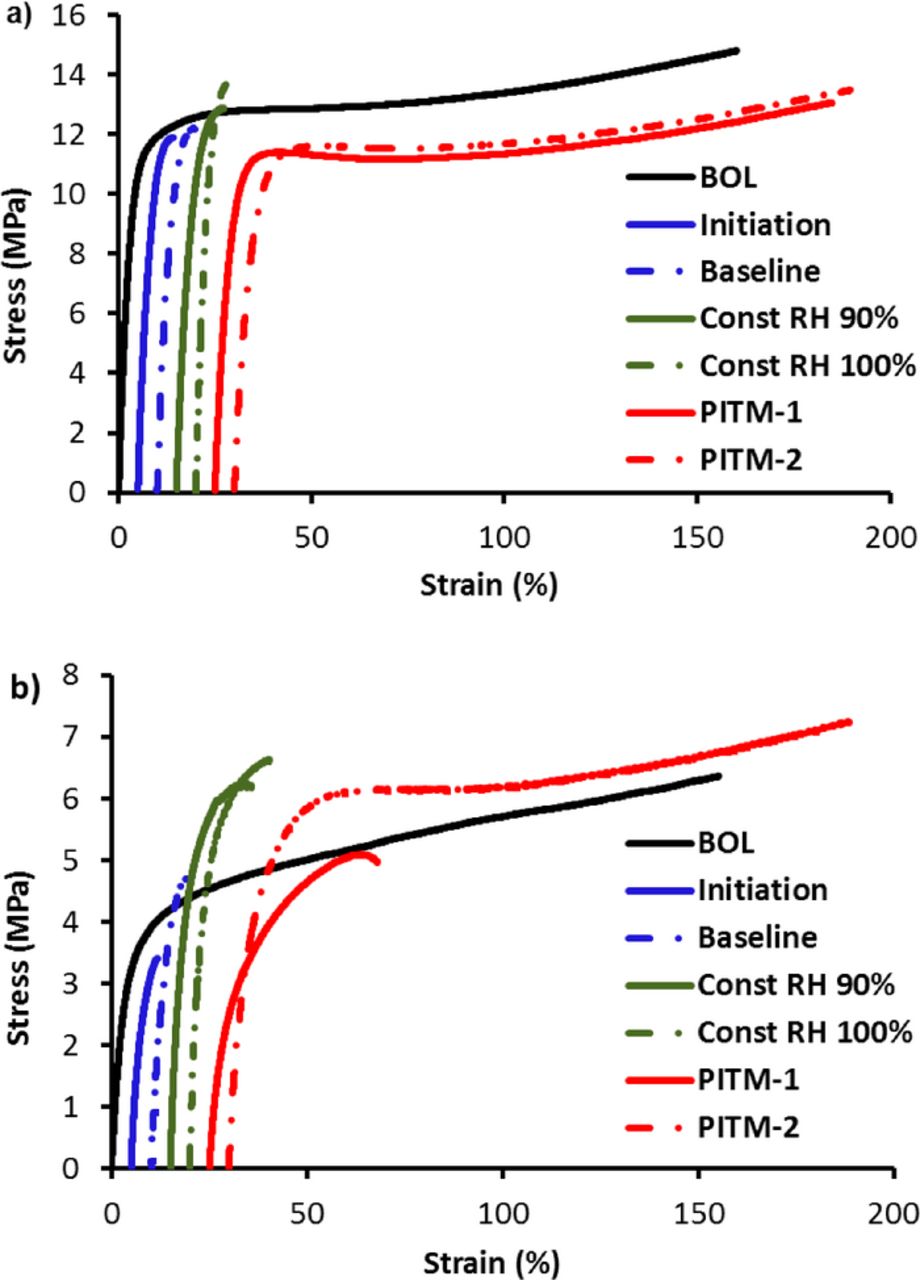
Figure 9. Tensile stress–strain curves of BOL and AMDT degraded catalyst coated membranes at (a) room conditions and (b) fuel cell conditions. The origin of the curves is shifted from zero strain to higher values for clarity.
At fuel cell conditions (Figure 9b), analogous to room conditions, BOL samples reached the DMA traveling length limit. On the other hand, the baseline AMDT and constant RH samples fractured at low strains after passing the elastic region. However, only the PITM-2 sample was able to endure the tensile test while the PITM-1 sample fractured at around 40% strain.
By comparing the plots in Figure 9, it can be summarized that chemical degradation had the strongest effect on the ductility of the EOL membranes since no brittleness was observed in the PITM samples, where chemical degradation was mitigated by introducing platinum into the membrane. Chemical degradation causes polymer chain disentanglement and membrane thinning in early stages of the AMDT which is accompanied by the formation of pinholes and divots prior to failure.
The two baseline AMDT samples exhibited similar tensile properties although the initiation AMDT was extracted from the stack well before failure. These results are evidence that chemical degradation in the first stages of the AMDT appears as polymer chain degradation and has the most crucial effect on membrane embrittlement during AMDT. This also indicates that the mechanical properties may primarily decay during the initiation phase, and that after hole formation, the hydrogen leaks generated may result in less severe conditions for chemical degradation and therefore limited further decay in mechanical properties. Another important observation is that once holes were formed, the mechanical properties remained the same, regardless of the size of the holes.
On the other hand, removal of mechanical degradation in constant RH AMDTs did not improve membrane ductility when compared to the ductility of the baseline AMDTs. The material's ability to absorb energy before rupture is defined as material toughness and is determined by calculating the area below the stress – strain curve. Based on this definition, BOL and PITM EOL samples showed higher toughness and required much more energy to fracture compared to the baseline and constant RH EOL samples subjected to severe chemical degradation.
Figure 10a presents the final strain of the AMDT samples in mechanical tests at both room and fuel cell conditions. The main discrepancy between the room and fuel cell condition results was observed in the PITM-1 sample where testing at high temperature and water content led to much lower elongation. This may be due to the lower ability of the membrane in PITM-1 to absorb water compared to PITM-2, indicating a higher level of destruction of the water channels in the membrane due to chemical degradation. On the other hand the water channel structure appeared to be highly preserved in the PITM-2 membrane. PITM-2 was found to have a much higher platinum concentration in the membrane, which suggests that increased PITM levels may result in a higher level of preservation of the membrane water channels and therefore mechanical properties.
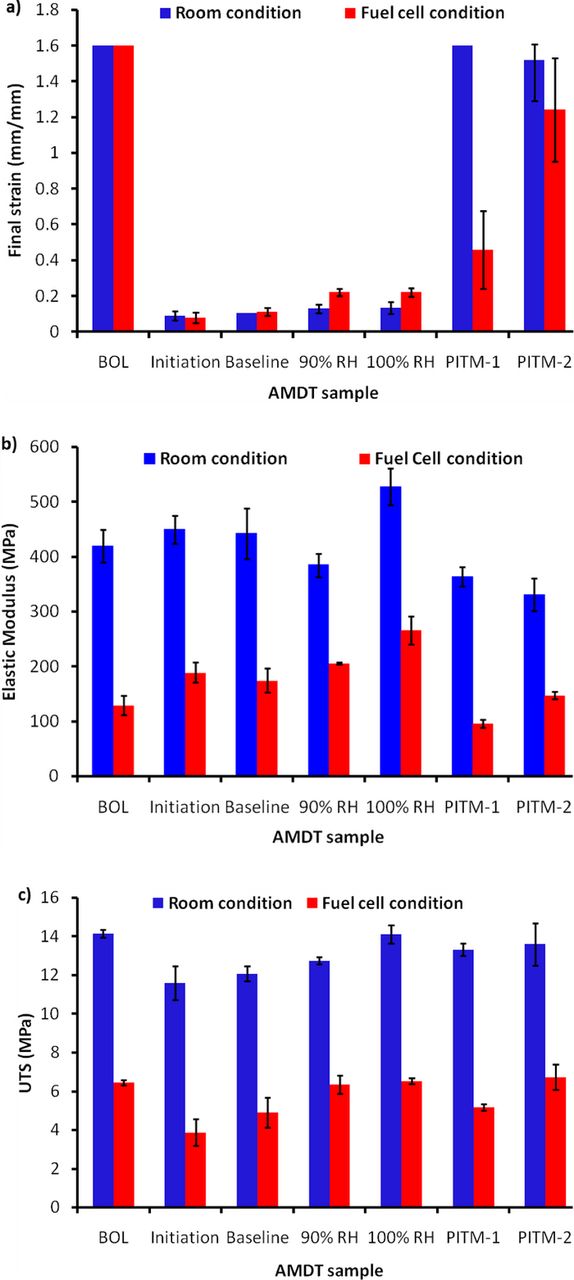
Figure 10. Tensile properties of BOL and AMDT degraded catalyst coated membranes at room (23°C, 50% RH) and fuel cell (70°C, 90% RH) conditions: (a) final strain; (b) elastic modulus; and (c) UTS.
The elastic modulus is an indication of the material's resistance against elastic deformation and is another important mechanical property evaluated in this study, as depicted in Figure 10b. In agreement with the literature, the elastic modulus is a function of test conditions and was significantly reduced by increasing the temperature and relative humidity.23,30 The PITM samples exhibited a lower elastic modulus and less resistance against deformation, i.e. less stiffness, compared to the baseline and constant RH samples. High elastic modulus and the lack of ductility observed in the baseline and constant RH cases can more easily lead to crack initiation in highly degraded areas, where the membrane experiences high stresses due to local degradation. In contrast, high elastic modulus and stiffness can reduce membrane swelling and contraction and control hygrothermal cyclic stress induced during humidity cycles. In the baseline and constant RH samples, severe chemical degradation may lead to reduced water uptake in the membrane, as indicated by the minor stiffening effect (increased elastic modulus) observed at fuel cell conditions but not at room conditions.
The maximum stress tolerated by the CCMs during the tensile test, i.e., the ultimate tensile strength (UTS), is presented in Figure 10c. The UTS remained unchanged in the constant RH and PITM samples, which were mainly affected by chemical degradation and mechanical degradation, respectively. However, in the baseline AMDTs, the UTS decreased at room and fuel cell conditions. Polymer main chain degradation and membrane global thinning caused by chemical degradation accompanied with microcracks and mechanical defects resulted from mechanical degradation may have led to a compounded reduction in membrane tolerance against mechanical loading. However, more intermediate samples would be required to elucidate conclusive trends in UTS.
As a summary of the mechanical properties represented in Figures 9 and 10 it was determined that the decay in mechanical properties was largely dominated by chemical degradation where the membrane (in a CCM) was transformed from a ductile to a fragile material in the baseline and constant RH samples. In contrast, in the PITM samples where chemical degradation mechanisms were controlled to some extent, the ductility and toughness of the membrane were maintained. However, it is also evident that that mechanical damage generated during RH cycling may accelerate the decay in mechanical properties through nucleation of mechanical microcracks at chemically degraded sites.
Conclusions
A baseline accelerated membrane durability test (AMDT) protocol was established for heavy duty fuel cell applications along with complementary experimental investigations to elucidate the respective roles of chemical and mechanical stressors in the overall membrane degradation mechanism and their impact on membrane life-time. The proposed baseline AMDT successfully accelerated membrane degradation using combined chemical-mechanical stress and significantly reduced the time to failure compared to regular duty cycle operation, achieving membrane failure in less than 300 hours. The failure modes obtained with the AMDT were similar to those observed during field operation, comprising holes and cracks in the membrane accompanied by local thinning, which demonstrates the effectiveness of the test protocol. It was found that under baseline AMDT conditions, the majority of the chemical membrane degradation occurred during the leak initiation period, followed by a rapid growth of the leak rate caused primarily by mechanical degradation.
The effects of RH cycling and Pt in the membrane were evaluated in complementary AMDT runs. The effect of RH cycling was visible when the tests at constant RH lasted significantly longer than the baseline, confirming that RH cycling indeed accelerates membrane degradation. RH cycling was found to gradually decrease the strength of the membrane due to the imposed mechanical stress, which was also found to exacerbate the effect of chemical degradation. The AMDTs at constant RH exhibited slower leak growth than the baseline, allowing for longer operation of membranes with leaks. The membrane life-time at 90% RH was shorter than at 100% RH, proving that the level of chemical membrane degradation increases with reduced humidity. The largest hole sizes and densities were found in the RH cycled samples, which also exhibited rougher damage structure indicative of mechanical degradation.
Platinum band formation extended the membrane life-time and prevented decay in thickness and elongation which suggests mitigation of chemical degradation. As a result the AMDTs with PITM displayed up to a doubling of the effective life-time. The test with high PITM concentration resulted in the longest life-time, while the test with low PITM concentration was found to have areas with gaps in the Pt band that were prone to local chemical degradation and earlier failures. Tensile tests on AMDT degraded samples determined the deterioration of CCM toughness in samples subjected to chemical degradation, while in PITM samples where chemical degradation was controlled, the mechanical strength of the membrane was preserved.
From these results, it can be concluded that PITM and constant RH operation result in enhanced membrane life-time under heavy duty fuel cell conditions. The baseline AMDT protocol developed and demonstrated in this work is recommended for rapid and reliable testing of membrane durability for heavy duty fuel cell applications.
Acknowledgments
Funding for this research provided by Automotive Partnership Canada (APC), Natural Sciences and Engineering Research Council of Canada (NSERC), and Ballard Power Systems is gratefully acknowledged. Ballard Power Systems is also acknowledged for providing access to experimental facilities and technical support. The authors thank Ramin Khorasany, Jeetinder Ghataurah, Mark Cruickshank, Freda Feng, Trevor Engh, and Curtis Allen for assisting with experimentation and characterization.