Abstract
The development process of electrified vehicles can benefit significantly from computer-aided engineering tools that predict the multi-physics response of batteries during abusive events. A coupled structural, electrical, electrochemical, and thermal model framework has been developed within the commercially available LS-DYNA software. The finite element model leverages a three-dimensional mesh structure that fully resolves the unit cell components. The mechanical solver predicts the distributed stress and strain response with failure thresholds leading to the onset of an internal short circuit. In this implementation, an arbitrary compressive strain criterion is applied locally to each unit cell. A spatially distributed equivalent circuit model provides an empirical representation of the electrochemical response with minimal computational complexity. The thermal model provides state information to index the electrical model parameters, while simultaneously accepting irreversible and reversible sources of heat generation. The spatially distributed models of the electrical and thermal dynamics allow for the localization of current density and corresponding temperature response. The ability to predict the distributed thermal response of the cell as its stored energy is completely discharged through the short circuit enables an engineering safety assessment. A parametric analysis of an exemplary model is used to demonstrate the simulation capabilities.
Export citation and abstract BibTeX RIS

This is an open access article distributed under the terms of the Creative Commons Attribution Non-Commercial No Derivatives 4.0 License (CC BY-NC-ND, http://creativecommons.org/licenses/by-nc-nd/4.0/), which permits non-commercial reuse, distribution, and reproduction in any medium, provided the original work is not changed in any way and is properly cited. For permission for commercial reuse, please email: oa@electrochem.org.
Increased utilization of lithium-ion (Li-ion) batteries for a variety of applications is driving the need for advanced simulation tools that can predict the combined structural, electrical, electrochemical, and thermal response to abuse conditions. If such simulation tools are integrated into the product development process, the resultant data have the potential to create highly optimized designs and achieve virtual verification of those designs.
In support of automotive durability and crash safety requirements, several experimental and modeling studies have reported analysis of battery mechanical properties and onset of short circuits for various loading conditions. Cylindrical cells have been subjected to uniform radial compression, localized indentation, and bending loads.1–3 Pouch cells have also been subjected to uniform and localized compression loads,4–8 as well as combined torsion and compression loads7,9,10 and nail penetration.11 Many of these references propose mechanical models that achieve reliable agreement between the simulated and measured indenter force and displacement. However, they employ homogenized models for the cell jelly roll aimed at a binary determination of whether a short circuit occurs, and they do not attempt to simulate the multi-physics consequences following the onset of short circuits.
Multi-physics models for battery abuse response prediction have been proposed for nail penetration,12 the short-time response to crush,13 and general high-rate discharge pertaining to external short circuits14 without mechanical loading or any dynamic motion creating a physical contact. In the context of this paper, the distinction between nail penetration, crush, and impact is based upon three factors. In a nail penetration, a small diameter indenter is forced through the cell layers with minimal global deformation. Although there is uncertainty in the heat transfer and electrical contact resistance between the nail and the cell layers, there is no question of whether a short circuit is formed because the layers are pierced at relatively low force levels. The deformation mode is a puncture rather than bulk failure, and other researchers have studied the effects of an internal short circuit induced by means other than mechanical loading.15 In a crush, a hydraulic or mechanically driven ram of blunt radius applies a continuous displacement and the reaction force between the cell and the indenter is recorded. In impact, the blunt indenter is released with an initial kinetic velocity and the cell absorbs that energy, with some probability of failure depending on the direction of impact and the energy delivered by the indenter. The results of this paper focus primarily on a framework for impact simulations that can assess the safety of the distributed thermal response to soft short circuits that cause the cell to discharge for a duration of tens to hundreds of seconds, though other cases could be handled by modification of the indenter shape, cell boundary conditions, and choice of time integration algorithms.
A coupled structural, electrical, and thermal simulation framework for batteries has been developed within the commercially available LS-DYNA software. The finite element model leverages a three-dimensional mesh structure that fully resolves the unit cell components. It is assumed the mechanical deformations that occur within the cell have a time scale of order 10−3 s, and methods for resolving the mechanical behavior while spanning the time scales of electrical and thermal dynamics are presented. In particular, the proposed method is more capable than prior literature for analyzing soft short circuits that take on the order of ten to hundreds of seconds to approach the onset temperature of thermal runaway processes. A spatially distributed equivalent circuit model predicts the electrical response with minimal computational complexity. The thermal model provides information to index the electrical model parameters, while simultaneously accepting irreversible and reversible sources of heat generation. A parametric analysis is performed for typical indenter shapes to demonstrate the capabilities of the simulation tool. Future work, including the selection of failure criteria for the onset of short circuits and methods to improve the model robustness, is discussed to highlight potential areas of need to other researchers in the field.
Numerical Model Development
The numerical model development begins with a description of the model implementation for an exemplary problem, followed by sections corresponding to each set of physics. The case study description contains the boundary and initial conditions, as well as time integration algorithms. The various sub-model descriptions include the constitutive models, assumptions, and governing equations for predicting the mechanical deformation, electrical potential, current density, and temperature response. A layer-resolved, finite element model is developed according to the geometric information illustrated in Figure 1. The full cell model consists of 32 unit cells, which are defined here as half the thickness of a current collector with a full layer of positive active material coating facing the opposing configuration on the negative side with separator between. An additional layer of separator material is modeled on each side of the stack exterior, giving a full cell thickness of 4.8 mm, and the in-plane dimensions of the coated area are 195 mm by 145 mm. The mesh is uniform with 5 mm edge size, leading to 38400 local circuit models from the product 40 × 30 × 32. The slight differences in the sizes of the positive and negative electrodes are ignored to simplify the meshing process. The external tabs which would exit the pouch covering and be used by the cell to pass or accept current are not modeled. However, the internal tabs which are later welded to the external tabs are modeled for the purpose of applying an electrical boundary condition, namely an isopotential constraint, which couples the response of the layers throughout the cell thickness to one another.
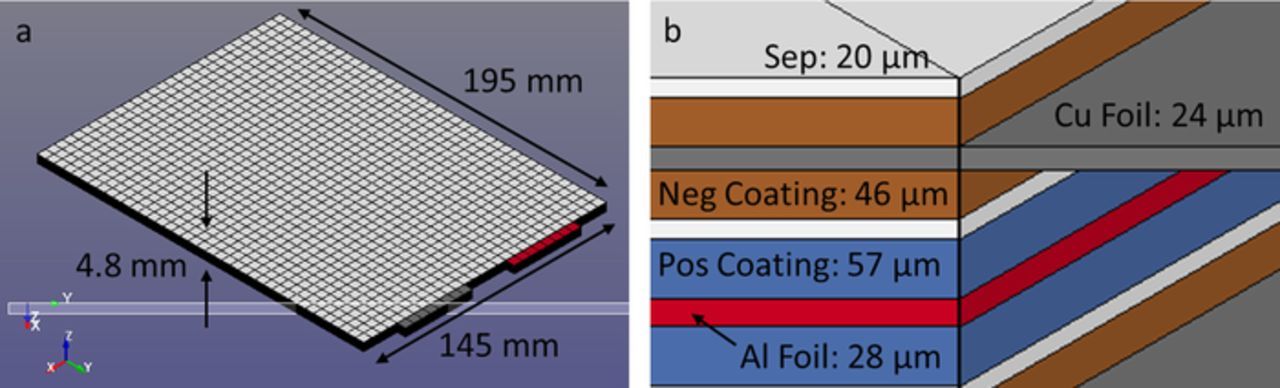
Figure 1. Illustration of the cell geometry and finite element mesh showing a) the overall physical dimensions and b) a zoomed view of a single unit cell along the section indicated in a).
Mechanical
The mechanical model furnishes the solution to the momentum equation. The individual components, namely the positive current collector, negative current collector, positive active material coating, negative active material coating, and separator are modeled with a single layer of thick shell (TSHELL) elements. The adjacent layers share common nodes, since it is assumed the exterior pouch is completely sealed and exterior atmospheric pressure prevents sliding motion between the layers. Element formulation 5 is selected because it enables 3D stress update with strain reduced integration,16 giving the TSHELL element solid-like behavior and ability to handle compressive loading.
The separators are thin porous polymer sheets, modeled using Material Model 181: Simplified Rubber/Foam (MAT-181), which is a simplified "quasi"-hyperelastic rubber or foam model defined by a single uniaxial load curve or by a family of curves at discrete strain rates. This material model is selected for its ability to simulate soft polymeric materials. The detailed element description and complete formulae can be found in Ref. 17. The input load curve for the material model is procured from tensile and compressive experiments performed on separators extracted from cell teardowns.
The electrode sheets are thin metal current collector foils coated by porous coating materials on each side. The coatings consist of active material particles which host lithium upon intercalation, carbon conductive additives, and polymeric binder. In the finite element model, all three layers (coating-substrate-coating) are resolved for both the positive and negative electrodes. The metal substrate layers are modeled using Material Model 123: Modified Piecewise Linear Plasticity (MAT-123),17 a material model that is capable of simulating the non-linear yielding behavior of metal and is expandable to incorporate strain rate effects in future studies. The coating layers use the previously mentioned MAT-181. Literature data for pure copper18 and aluminum19 materials are used to populate the inputs of the substrate material models. While the strength of the substrate dominates the overall strength of the coated electrode sheets, the properties of the coating materials control its failure strain as discussed in more detail in the Results and discussion section. Therefore, the failure strain and ultimate stress of the coating materials are used as tuning parameters. The tuning objective is to make the peak force, and elongation at peak force, in simulation match that of the physical test.
Electrochemical
The standard LS-DYNA resistive solver20 is capable of determining the potential and current distributions within an inert conductor, such as a current collector, by solving the Laplacian equation subject to arbitrary boundary conditions. To empirically represent the electrochemistry occurring within the active materials and separator of a cell, an equivalent circuit model is coupled to a modified version of the Laplacian equation by dividing each current collector into numerous finite elements and then assuming equivalent circuits govern the relationship between transverse current and local voltage across each unit cell. The relationship between the in-plane and transverse governing equations is illustrated in Figure 2. The governing equations of the generic equivalent circuit are adopted from literature,21 where the rationale and implementation of these models is well-documented and therefore not expanded upon here.
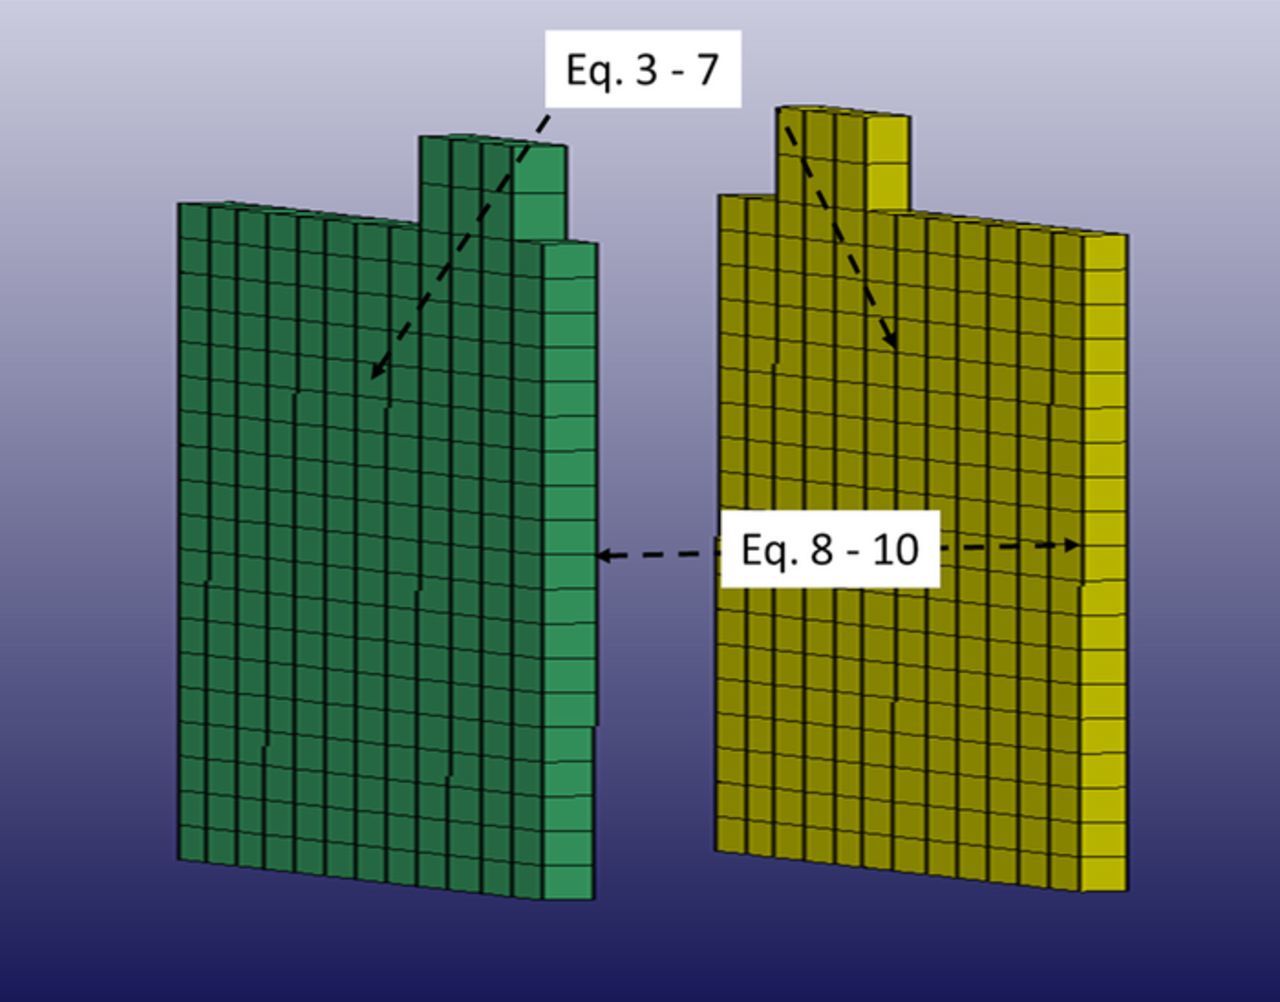
Figure 2. Schematic showing equations solved and corresponding domains for in-plane and through-plane state variables. The equivalent circuit differential equations do not strictly require an explicit mesh, but the coupling provided by the mesh in-plane conductivity impacts the finite element solution for the in-plane current density.
The electromagnetism resistive solver computes the Laplacian equation for the scalar potential, ϕ,
![Equation ([1])](https://content.cld.iop.org/journals/1945-7111/164/1/A6440/revision1/d0001.gif)
where σ is the electric conductivity. Equation 1 represents the physical equation, which after projection against the nodal basis functions, φ, using a standard finite element method, reads:
![Equation ([2])](https://content.cld.iop.org/journals/1945-7111/164/1/A6440/revision1/d0002.gif)
where S is the σ-dependent Laplace operator. Equation 2 is solved along with adequate boundary conditions discussed further in the Case study setup section. In Eq. 2, φ represents the vector of nodal values of the scalar potential, hence φ1 = φ(N1) is the value of the scalar potential at node N1, for example. From the scalar potential, the physical in-plane current density  is computed as:
![Equation ([3])](https://content.cld.iop.org/journals/1945-7111/164/1/A6440/revision1/d0003.gif)
The coupling to the local equivalent circuits creates a non-zero right-hand side in Eq. 2, which represents the potential drop between the nodes of opposing current collectors defined as
![Equation ([4])](https://content.cld.iop.org/journals/1945-7111/164/1/A6440/revision1/d0004.gif)
where φ2 and φ1 are the local potentials at the positive and negative current collector nodes N2 and N1 respectively, i is the local transverse current density, r0 is the local instantaneous resistance, u is the local open-circuit voltage, and vD is the local diffusion overpotential. All local variables are assigned to an opposing node pair on the positive and negative current collectors, so the total number of local variables of a given type is equal to the number of in-plane, surface nodes on either the positive or negative current collector (38400 in this instance). For numerical stability reasons, the r0i term of Eq. 4 is included within the Laplacian operator instead of in the right-hand side. The modified system thus reads
![Equation ([5])](https://content.cld.iop.org/journals/1945-7111/164/1/A6440/revision1/d0005.gif)
where, like S(σ), D(r0) is a matrix of size (n, n), where n is the number of nodes in the model. The matrix D(r0) is defined as
![Equation ([6])](https://content.cld.iop.org/journals/1945-7111/164/1/A6440/revision1/d0006.gif)
for all pairs of nodes (N2, N1) associated to the equivalent circuits. Furthermore, b is defined as
![Equation ([7])](https://content.cld.iop.org/journals/1945-7111/164/1/A6440/revision1/d0007.gif)
Once the system defined by Eq. 5 is solved, the local current in each equivalent circuit can be computed by
![Equation ([8])](https://content.cld.iop.org/journals/1945-7111/164/1/A6440/revision1/d0008.gif)
which allows actualization of the equivalent circuit governing equations. There are two state variables associated with each local equivalent circuit. The first is the diffusion overpotential, defined as the voltage across the resistance-capacitor (RC) pair given by
![Equation ([9])](https://content.cld.iop.org/journals/1945-7111/164/1/A6440/revision1/d0009.gif)
where cD is the equivalent capacitance of the RC pair, and rD is its resistance. The state of charge (SOC) of the local equivalent circuit is computed by
![Equation ([10])](https://content.cld.iop.org/journals/1945-7111/164/1/A6440/revision1/d0010.gif)
where cQ is a conversion factor and Q is the capacity delivered by a unit cell pair. During mechanical deformation, a short circuit may occur based on a threshold criterion selected for the simulation, as discussed further in the Case study setup section. When a short circuit is detected, the equivalent circuit governing equations at a particular node are replaced with pure resistive elements, which act as a constraint for the remaining equivalent circuits. The electrical model parameters ro, rD, cD, are assumed to depend on temperature according to
![Equation ([11])](https://content.cld.iop.org/journals/1945-7111/164/1/A6440/revision1/d0011.gif)
where β, α, and Ea are fitting constants and R is the universal gas constant.
Thermal
The thermal solver computes the finite element solution to the transient, three-dimensional heat diffusion equation
![Equation ([12])](https://content.cld.iop.org/journals/1945-7111/164/1/A6440/revision1/d0012.gif)
where T is the temperature, ρ is the mass density, cp is the specific heat capacity, k is the thermal conductivity, and  represents all volumetric heat source terms. The volumetric heat source terms considered within this model are
![Equation ([13])](https://content.cld.iop.org/journals/1945-7111/164/1/A6440/revision1/d0013.gif)
where  represents the Joule heating that results from in-plane electron transport within the current collectors, i2r0 is irreversible heat generation associated with ohmic and kinetic losses across the unit cell, and
  is the combined reversible heat generation associated with the electrode couple. These heat source terms are applied at the node existing at the interface between the active material coating and current collector, and diffuse into the remaining components accordingly. They are also corrected for the volume of the element, Ve, to maintain consistent units with Eq. 12, whereas the in-plane Joule heating is already consistent because it is calculated directly from the mesh. Note that the diffusion overpotential is not included as an irreversible heat generation term since heat of mixing effects are assumed to be negligible.22 A single, isotropic thermal constitutive model is implemented with parameters from literature23 for battery components soaked with electrolyte. If a short circuit is initiated, the heat source terms are replaced within the short circuited region by
![Equation ([14])](https://content.cld.iop.org/journals/1945-7111/164/1/A6440/revision1/d0014.gif)
where rS is the resistance of the local short circuit. At the time of the short, the total energy remaining in the corresponding equivalent circuit is added locally to the thermal solver. As presented, the model does not conserve energy since the heat produced by the diffusion overpotential is not included in the heat diffusion equation. This would produce erroneous results for situations involving normal cycling and has been corrected in future releases of the model. However, data is presented in the Results and discussion that indicates the heat generated by the diffusion overpotential is less than 1% of the magnitude of Eq. 14 for the cases presented in this paper.
Case study setup
The case studies analyzed here assume that rapid mechanical deformation is imposed on the cell on a time scale of approximately 0.5 ms by an indenter with fixed velocity. It is further assumed that all kinetic energy is converted into mechanical strain energy of the cell components within that time span, and the indenter instantaneously stops at 0.5 ms. Within the initial 0.5 ms where mechanical deformation occurs, explicit time integration is used to solve the structural equations and implicit time integration is used to solve the electrochemical and thermal equations. All sets of physics in this initial phase use a time step of 2.0 × 10⁻⁷ s. Following this initial phase, the mechanical deformation is assumed to be rigid and fixed for the remaining simulation time. Therefore, the time step of the implicit time integration is increased to 1 s without any stability issues, and no further calculations are performed for the structural equations.
In two separate cases, cylindrical and spherical indenters of 75 mm diameter are implemented in simulation as rigid bodies using *RIGIDWALL_GEOMETRIC. These cases create different failures within the simulated cell to investigate the parametric dependence of the total short circuit resistance that results from varying types of mechanical deformation. The failure criterion for the onset of short circuit is a compressive strain threshold applied at the unit cell level. When the distance between the current collectors is reduced by ten percent of its initial value the local equivalent circuit is replaced by a purely resistive constraint between the opposing current collectors. The resistivity value chosen in this study is 12.5 mΩm2 which leads to a short circuit that discharges at a rate that is slow enough to observe the thermal and electrical dynamics. This failure condition is arbitrary but useful for demonstrating the effectiveness of the software tool, and it is expected that future users will incorporate their own comprehensive failure conditions that are representative of the system they are studying. For example, data representing contact resistance between various pairs of components could be leveraged.
The boundary conditions imposed on the cell encompass mechanical, thermal, and electrical constraints. It is assumed that no external electrical load is placed on the cell tabs during the crush, so that current exiting the cell tabs is zero. The negative terminal potential is also set to zero to consider only the potential difference between the two terminals. It is further assumed that the cell exchanges heat with its ambient environment by natural convection from its top surface, with a convection coefficient of 10 W/m2/K, and all other external surfaces are adiabatic. A rigid wall supports the cell along its bottom surface and prevents displacement in the x,y, and z-directions, as well as rotation about those nodes.
Experimental
The experimental methods include mechanical testing on components extracted from cell disassembly, and electrical testing at the cell level. All methods can therefore be performed in laboratories that do not possess specialized equipment for handling the crush response of fully charged, large format battery cells. The goal is to define a set of benign experiments that can serve as simulation inputs to reduce the need for energetic tests. Tensile tests are performed on the cell separator and electrodes to determine their contributions to the cell global bending stiffness. Compression tests are performed on these components as well, to determine the localized force-displacement characteristics and degree of compressive strain induced by various loads. Finally, the cell-level electrical testing defines the input parameters needed to compute the current and voltage response of the cell subject to the short circuit value.
The tensile testing performed on the cell components uses dog bone samples with a gauge length of 40 mm and a gauge width of 6.1 mm connected to an Instron load frame with compressive grips. The samples are cut in three orientations, which (in reference to Figure 1) include parallel to the x-axis, parallel to the y-axis, and the 45° angle between, to determine whether anisotropic behavior is present. The samples are mounted onto an Instron test machine and elongated at a rate of 24 mm per minute. Five to ten samples are tested for each component and each direction. The relevant test data include force versus displacement and maximum elongation before rupture.
Compression tests are conducted using square stainless steel indenter of 6 mm edge size connected to an Instron machine. Samples are cut to approximately 3 cm × 3 cm squares and placed on a stainless steel plate. Again, force versus displacement data is recorded. The test data indicates that the compressibility of the negative electrode is much greater than that of the positive electrode (twice the displacement under the same compressive load). Therefore when a cell is crushed uniformly in the out-of-plane direction, most of the internal displacement will concentrate in the negative electrode layers.
The electrical model is calibrated using cycling experiments at the cell level for temperatures of 25, 40, and 50°C. An Arbin Instruments BT-2000 cycler is used to pass current and record the electrical and thermal response, while an Espec thermal chamber is used to maintain the cell ambient environment.
Results and Discussion
First the calibration of the mechanical model inputs obtained from component experiments is presented, followed by the calibration of the equivalent circuit model. Then the results of the impact case study are presented, beginning with the mechanical response and proceeding to the electrical and thermal consequences.
Calibration
The stress-strain curves for the tensile test of each component are plotted in Figure 3. In the case of the separator, the material stress-strain data is used directly as a model input. The difference between stress-strain curves for different orientations is not significant compared to sample variation for this particular separator type, so the simulation input is based on the average values of data from all three orientations. In the case of the electrodes, the test results show that, on average, the positive electrode specimen ruptures under a stress of approximately 17 MPa at 0.6% elongation, and the negative electrode specimen ruptures under a load of 22 MPa at 1.6% elongation. The failure strain of the electrode specimen is significantly lower than that of the pure current collector metals. One reasonable explanation of this phenomenon is stress concentration on the metal foil caused by small fractures of the active material coating. During elongation test of a tensile specimen, the active material coating will fracture at a strain of one to two percent, because the coating is a mixture weakly held together by polymer binder. As soon as the fracture occurs, almost all further elongation of the specimen is concentrated on the exposed metal substrate which is less stiff than the unexposed portion, leading to rapid rupture of the specimen at the exposed location. Thus the overall elongation of the tensile specimen is much lower than pure metal. This reasoning is used to develop the mechanical models of the battery electrodes implemented in this work, but other explanations such as embrittlement due to the calendaring process are also possible.
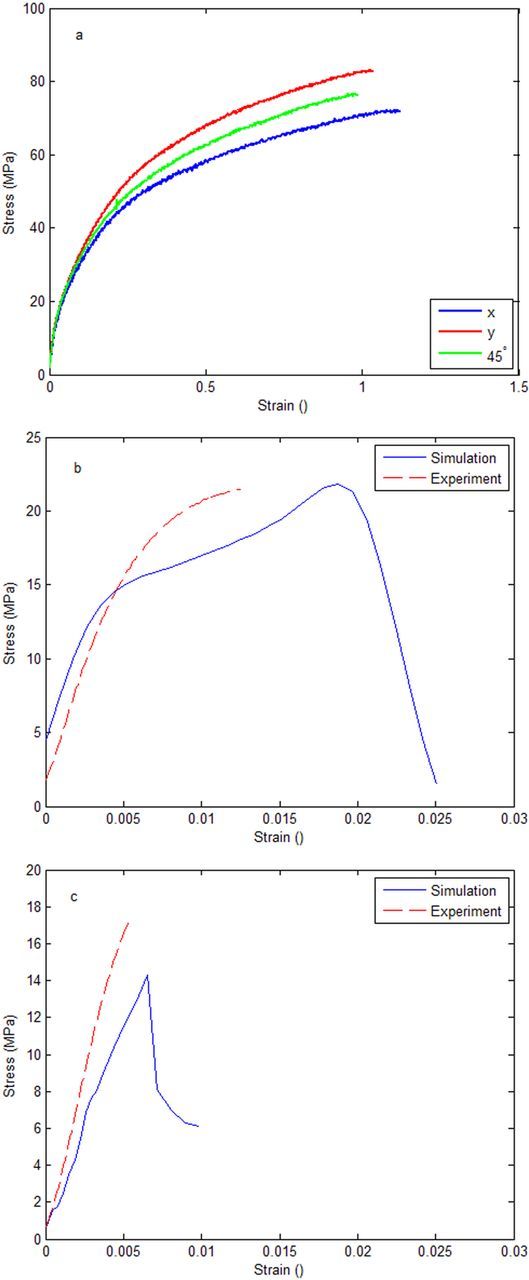
Figure 3. Tensile stress and strain data by sample type including a) separator, b) positive electrode, and c) negative electrode.
In order to confirm this hypothesis, finite element models of the tensile test were created, and the output of these simulations are also plotted for Figures 3b and 3c. From comparing the simulation and experimental curves for positive and negative electrode specimens, it is noted that although the peak force and elongation when force peaks in simulation match that of the physical test, the simulation force curves do not drop to zero immediately after the peak, as demonstrated by the test curves. In the physical test, after the active material coating ruptures, the stress is concentrated in the extremely small area of the exposed metal substrate and the entire specimen ruptures immediately. In the simulation, however, due to the finite size of a substrate element, stress is not concentrated on an infinitesimally small area after the coating ruptures. Therefore, the force drops from the peak as the coating ruptures to a lower value, and then to zero as the substrate ruptures after additional elongation. Figure 4 shows a CAE tensile specimen with coating element deletion. The red elements are exposed metal substrate which further elongates during the CAE run until final rupture.
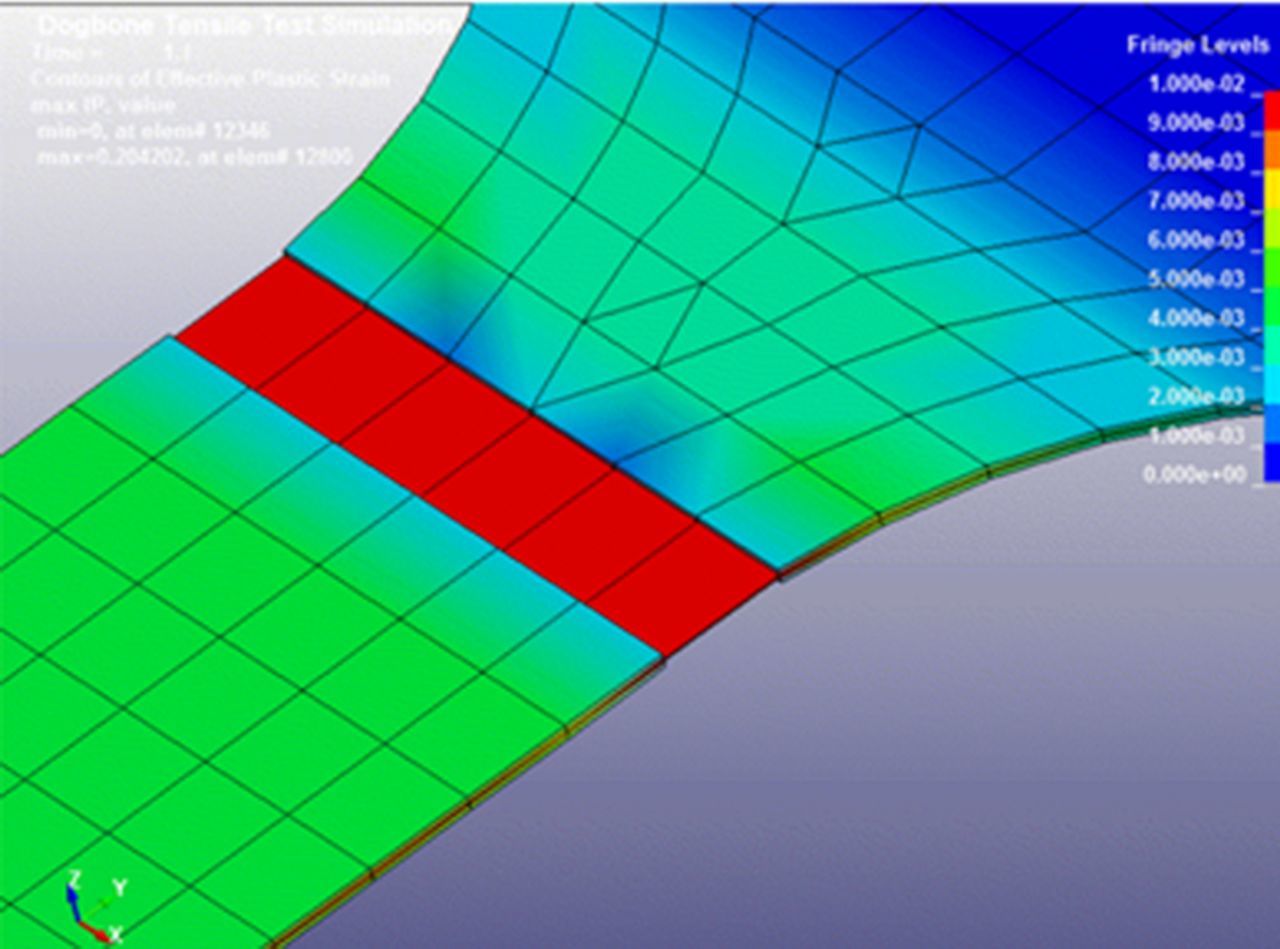
Figure 4. Simulated tensile specimen showing stress concentration in red after coating rupture.
Finite element models were also constructed to simulate the compression tests. Initially, the stress-strain curves from the tests are directly used as the material load curves in the finite element model. Then, a scale factor is applied to the finite element material load curve so that the force-displacement curve in simulation matches that of the test. Figure 5 shows calibrated simulation curves versus test data.
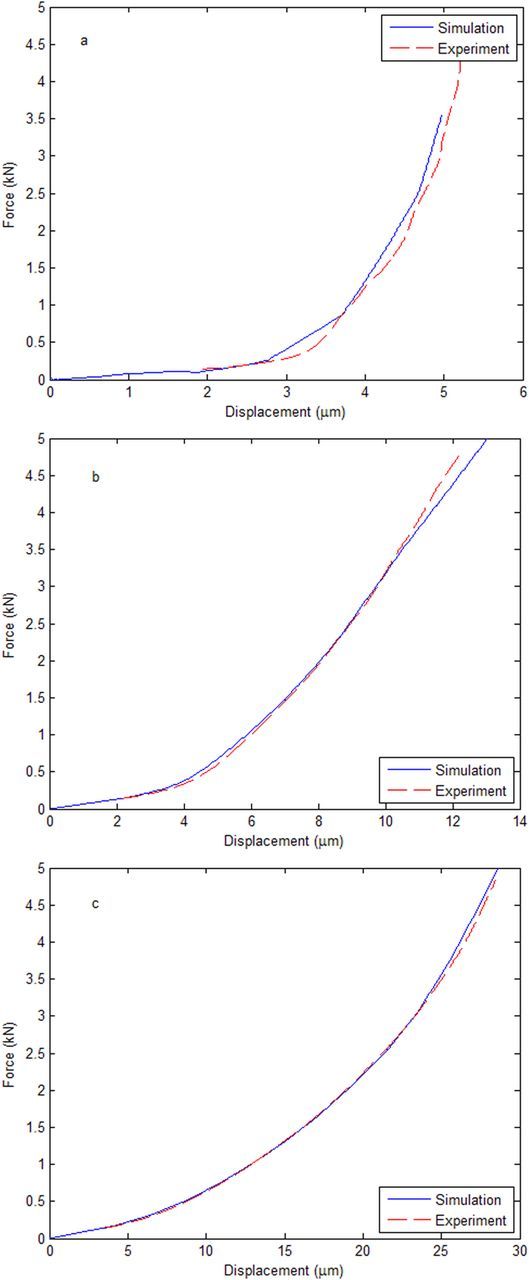
Figure 5. Comparison of simulated and test compressive stress and strain data by sample type, including a) separator, b) positive electrode, and c) negative electrode.
A linear least squares23 approach is used to identify the circuit model parameters from the cell-level current and voltage response. As mentioned previously, the Arrhenius dependence of Eq. 11 is assumed for the equivalent circuit parameters to interpolate between, and extrapolate beyond, temperatures other than the measured values. The average resistance (or capacitance) across all state of charge values at a given temperature is first computed. Then, an Arrhenius plot is constructed and the activation energy is identified from the slope of the best fit line to the data at the tested temperatures. The reported temperature dependence of electrical conductivity for aluminum25 and copper26 are applied to the current collectors. The average of C/10 charge and discharge voltages is assumed to represent the open-circuit voltage as a function of state of charge. The identified electrical parameters for 25°C are plotted in Figure 6 and the Arrhenius characteristics shown in Table I.
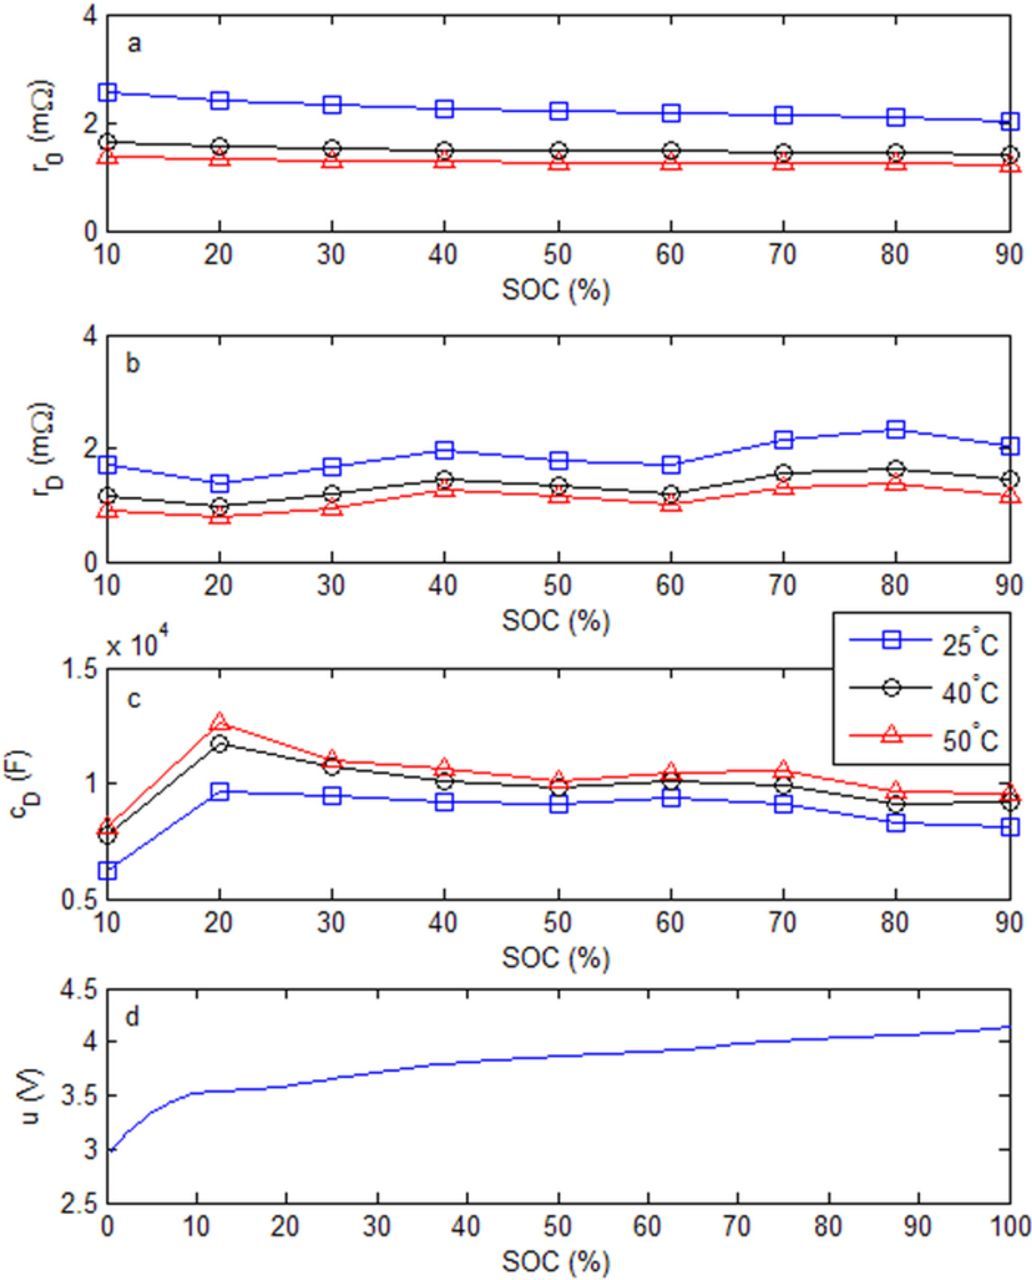
Figure 6. Electrical model parameters as a function of state of charge at various temperatures, including a) instantaneous resistance, b) diffusion resistance, c) diffusion capacitance, and d) open-circuit voltage.
Table I. Identified parameters for Arrhenius fit of electrical parameters, and the assumed contact resistance that computes the local resistive constraint after the occurrence of a short circuit.
| Parameter | β | Ea | α |
|---|---|---|---|
| r0 | 5.17 × 10⁻⁷ | 21500 | 0.25 × 10⁻³ |
| rD | 1.78 × 10⁻⁶ | 17200 | 0 |
| cD | 79800 | −5480 | 0 |
| rs | 0 | 0 | 500 |
Impact simulation
The simulation described in the Case study section is carried out using parallel processing on 48 CPUs. The total wall time is 7 hours, 36 minutes for the full cell model with 150687 elements. Analyzed further, the initial simulation of 0.5 ms physical time takes 1 hour, 48 minutes, and the longer time scale simulation encompassing a physical time of 250 s takes 5 hours, 48 minutes. Clearly these simulation times are dependent upon the time step chosen by the user, and in the case of the fully implicit solution over the long time scale, larger time steps are feasible to reduce the simulation time.
The shorted area time series data are plotted in Figure 7. This simulation output represents the number of elements which have exceeded the compressive strain failure criterion and therefore have been replaced by resistance constraints as a function of time. A constant resistivity as a function of applied pressure is assumed, so the shorted area is inversely proportional to the total short circuit resistance. Both indenters exhibit a period during the initial mechanical deformation where compression occurs without initiating a short circuit. The first failures occur around 0.3 ms for the spherical indenter, and 0.37 ms for the cylindrical indenter. The broader contact area of the cylindrical indenter leads to a more rapid increase in the short circuit contact area, as compared to the spherical indenter. By assumption, the mechanical deformation stops at 0.5 ms, and the electrochemical and thermal responses are driven by the steady state value for the remainder of the simulation. The steady state response is a shorted area of 0.026 m2 for the cylindrical indenter and 0.0015 m2 for the spherical indenter, or the equivalent of 1040 and 600 local circuit models replaced by shorts respectively. Combining this analysis with the fringe plots of Figure 10 reveals that all layers through the cell thickness short, with greater occurrence (width of the shorted region) in the layers closest to the indenter.
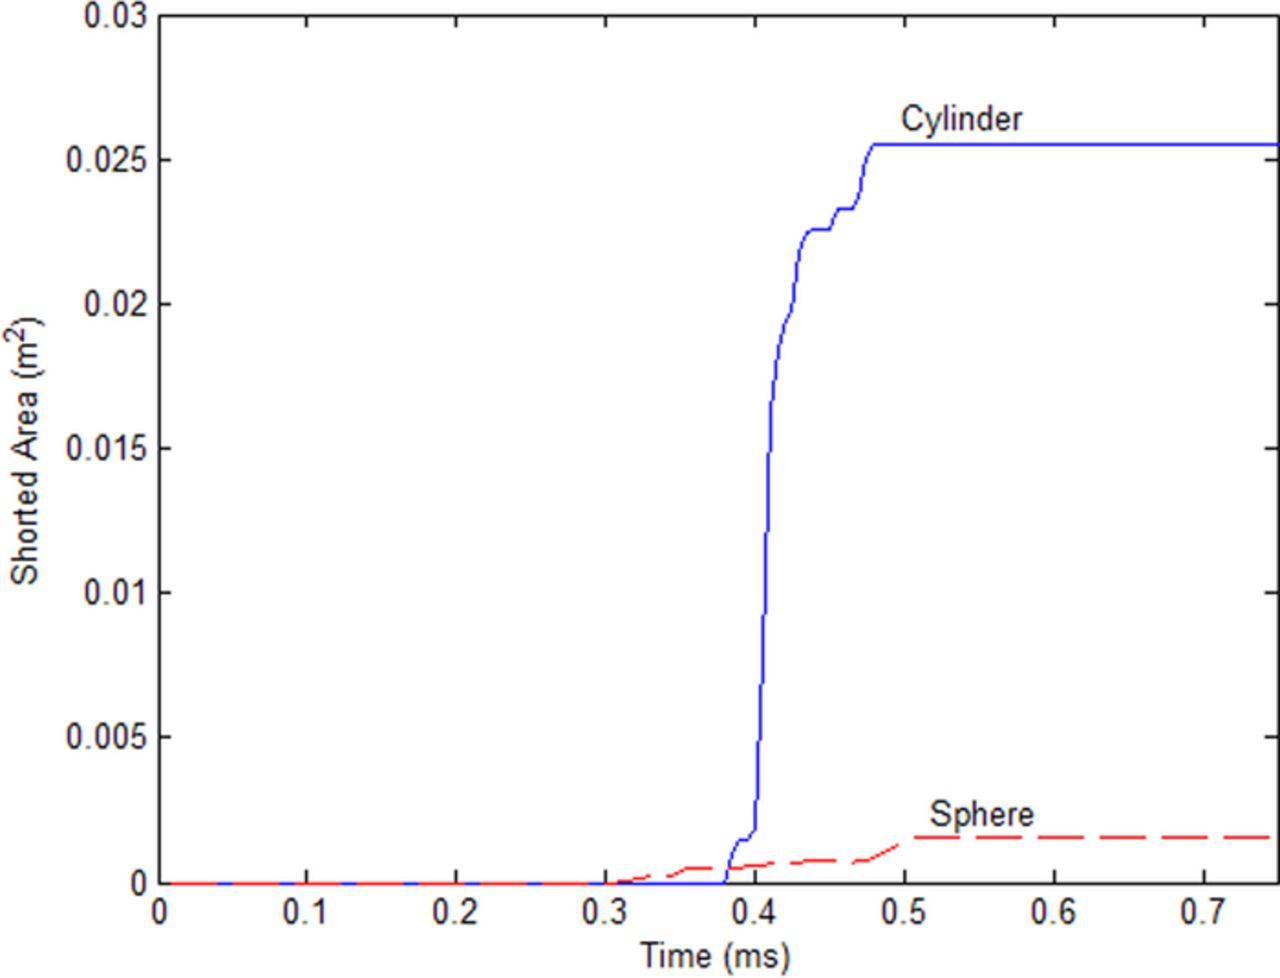
Figure 7. Shorted area time series data, showing the steady increase in shorted area as the indenter impacts the cell, followed by a steady state value once motion ceases. The steady state value is held constant for the remainder of the electrical and thermal simulation.
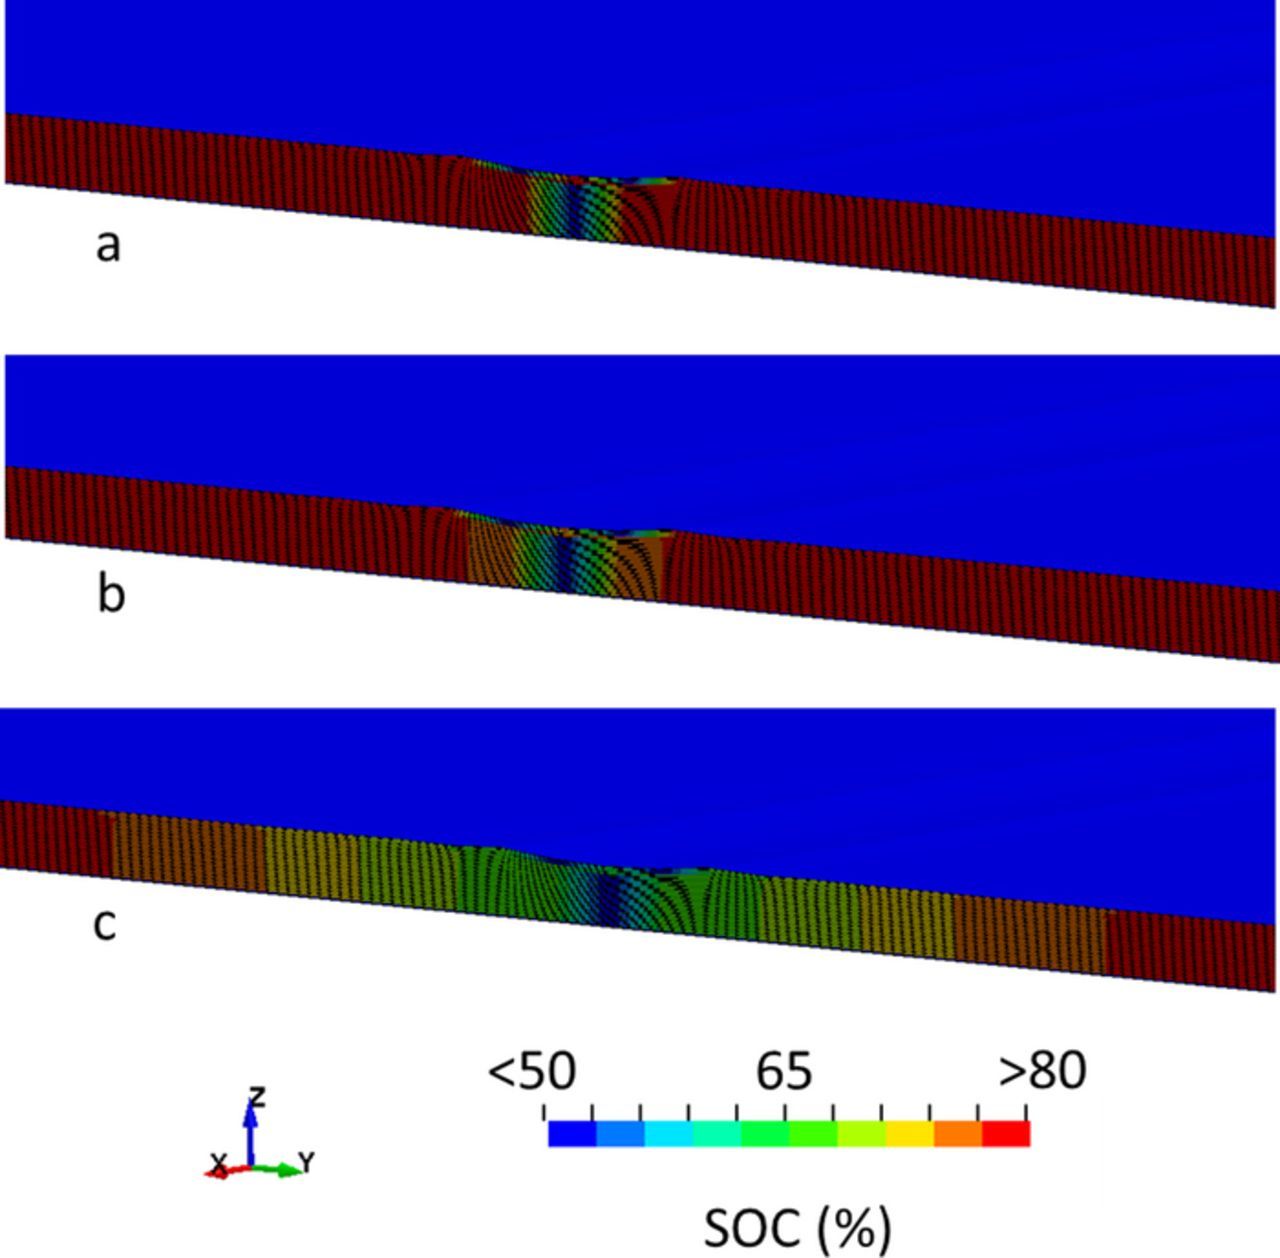
Figure 10. State of charge fringe plots at selected time steps, including a) t = 10 s, b) t = 50 s, and c) t = 100 s, focusing near the indenter contact region. Areas where equivalent circuits have been replaced by a pure resistive element have been set to zero state of charge.
The force versus displacement curves for each indenter, along with nodal displacement fringe plots at the final state, are shown in Figure 8. The characteristic strain hardening observed at the component level is also present when compressing the complete cell. As expected, the strain is concentrated under the contact zone and decays toward zero at a sufficient distance from the failure area. Furthermore, the spherical indenter case, with its more localized contact area, demonstrates a much lower force required to achieve the 0.5 mm compression.
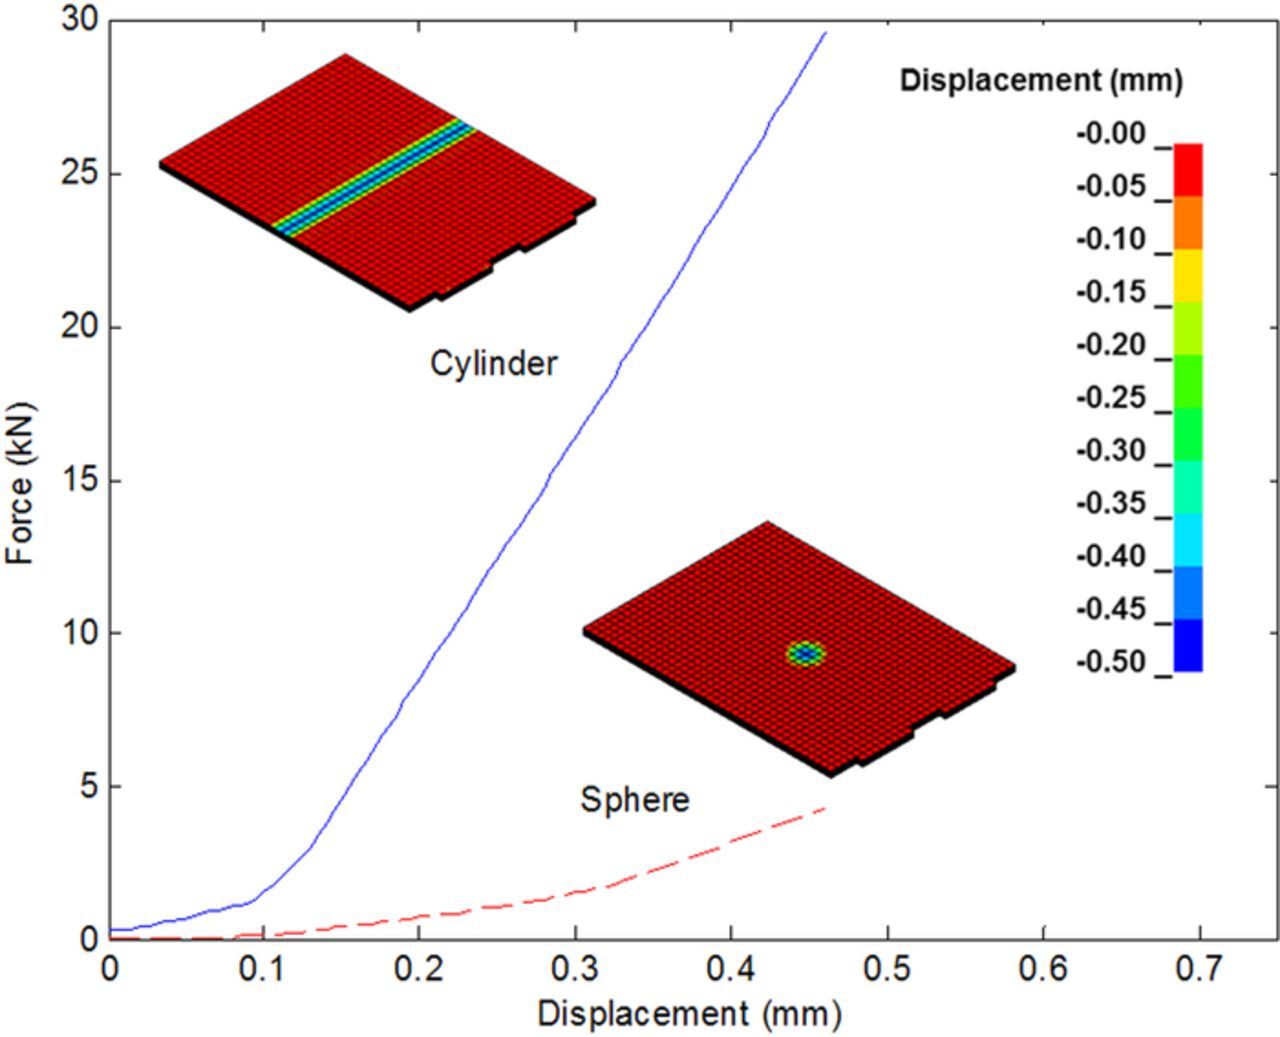
Figure 8. Force versus displacement curves for the cylindrical and spherical indenter cases, including a nodal displacement fringe plot for each case at the final mechanical simulation state of t = 0.5 ms.
The voltage response, as simulated at the cell terminals, is plotted in Figure 9. A nearly instantaneous drop in voltage occurs as the mechanical deformation creates the internal short circuit in less than 0.5 ms. Following the initial drop, dictated by the short circuit magnitude and the cell internal resistance, the equivalent circuit parameters and cell geometry define the voltage response. In the case of the spherical indenter, the short circuit is of a high resistance and the overall discharge rate is slightly less than 1C, which leads to a voltage response that is slightly but steadily decreasing. In the case of the cylindrical indenter, the discharge rate is approximately 10C. This aggressive discharge rate creates immediate and sustained temperature gradients throughout the cell, which causes the electrical resistance parameters to decrease dramatically according to their Arrhenius dependence. The rapid temperature rise overcomes the loss of stored energy that steadily decreases the open-circuit voltage, and the terminal voltage actually increases as a result.
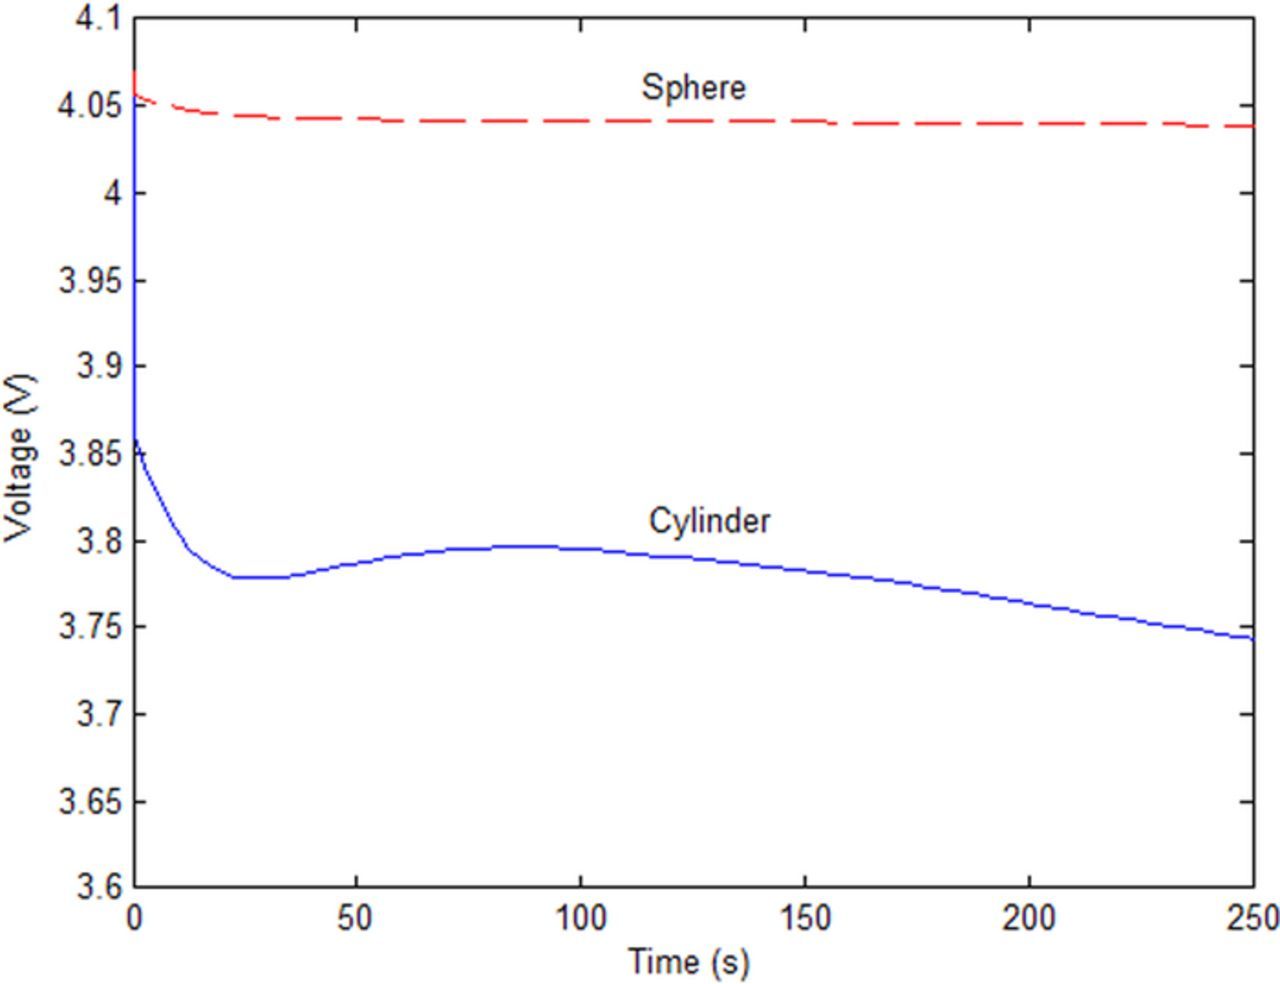
Figure 9. Cell terminal voltage response versus time.
State of charge fringe plots are shown for selected time steps in Figure 10. The response is characterized by ohmic limitations of the current collector. For example, the regions nearest the failure area discharge through the short circuit more rapidly than those positioned further away. The cylindrical indenter case experiences a gradient of around 15% state of charge between the regions nearest the indenter and those toward the cell perimeter. The spherical results are not pictured because the overall change in state of charge is nearly negligible due to the slow discharge rate.
Current density within the outermost positive current collectors, viewed from the cell top and bottom surfaces, is shown in Figure 11. In the case of the cylindrical indenter, the failure area bisects the cell into upper and lower regions that are coupled by the resistive constraint created in the failure area. For the sphere, a centralized short circuit location leads to a radial distribution of the current density. In both cases, an interesting pattern is displayed where the top cell layers have a larger short circuit area than the layers further from the indenters. Therefore, the current density near the tabs shows that the layers in the cell interior, through to the bottom layer, actually supply discharge current to the more aggressive short circuit created in the top unit cell.
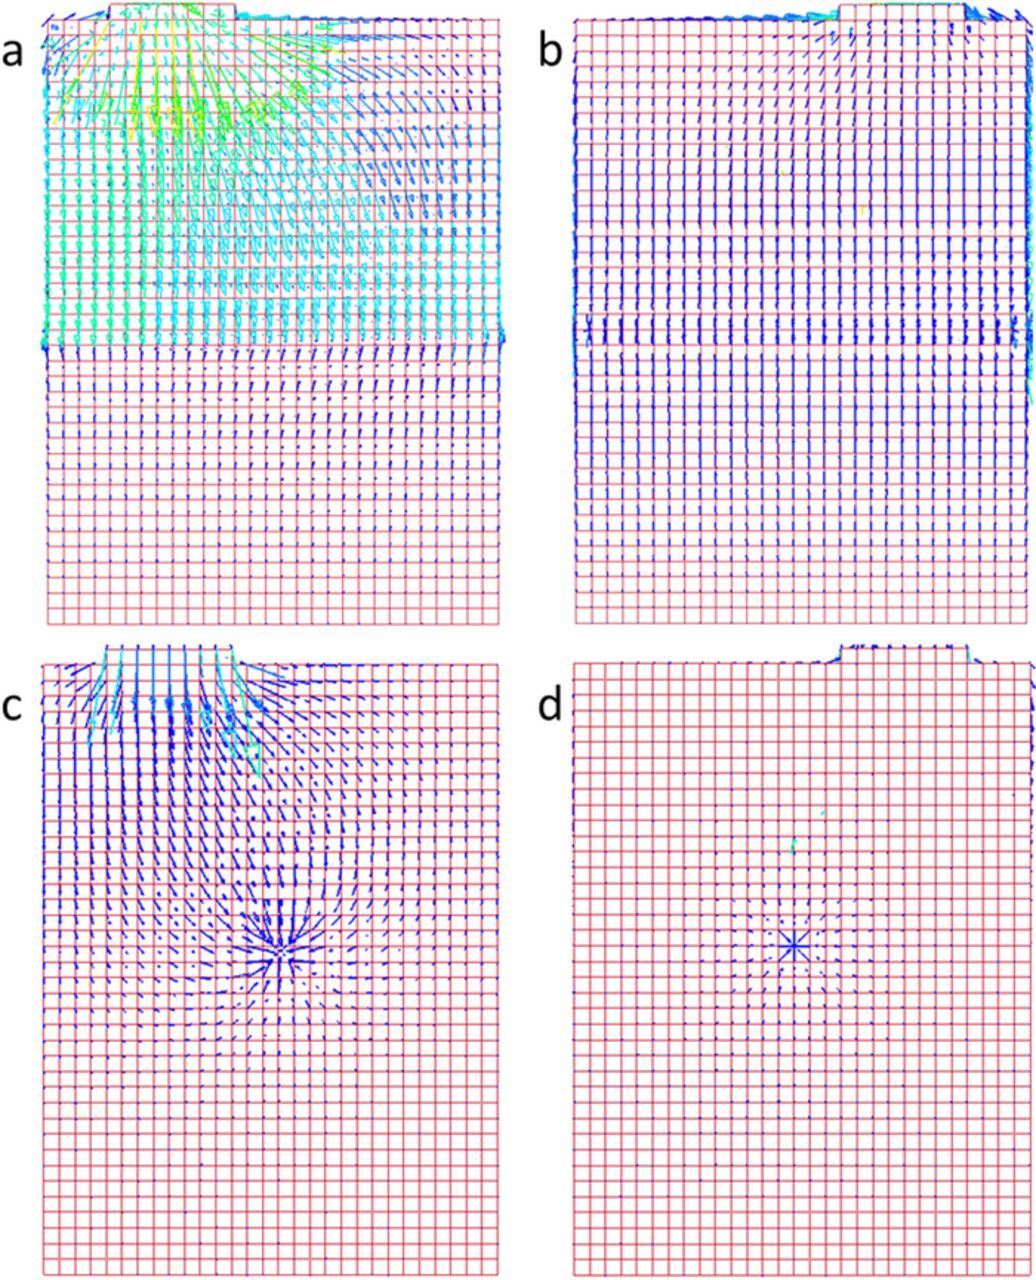
Figure 11. Current density vector plots on the positive current collector immediately following the arrival at the steady state mechanical deformation. Results are from the a) top view subject to a cylindrical indenter, b) bottom view subject to a cylindrical indenter, c) top view subject to a spherical indenter, and d) bottom view subject to a cylindrical indenter.
Temperature fringe plots and the nodal temperature time series data for a node at the geometric center of the top surface of the cell are shown in Figure 12. The thermal response is dominated by the ohmic heating emanating outward from the short circuit location, which averages 3300 W for the cylindrical indenter and 300 W for the spherical indenter over the simulation time. By comparing the maximum element temperature predicted by the model with known onset temperatures of exothermic side reactions for a cell design, an engineering safety assessment can be made. Furthermore, since local state of charge variations are incorporated in the model, the dependence of side reactions on state of charge can also be accounted for when assessing safety. In both cases, the temperatures initially rise rapidly before the rate slows due to the free convection imposed on the top cell surface. Figure 13 summarizes the progression of the mechanical and thermal responses for the spherical case to emphasize the separate time scales involved.
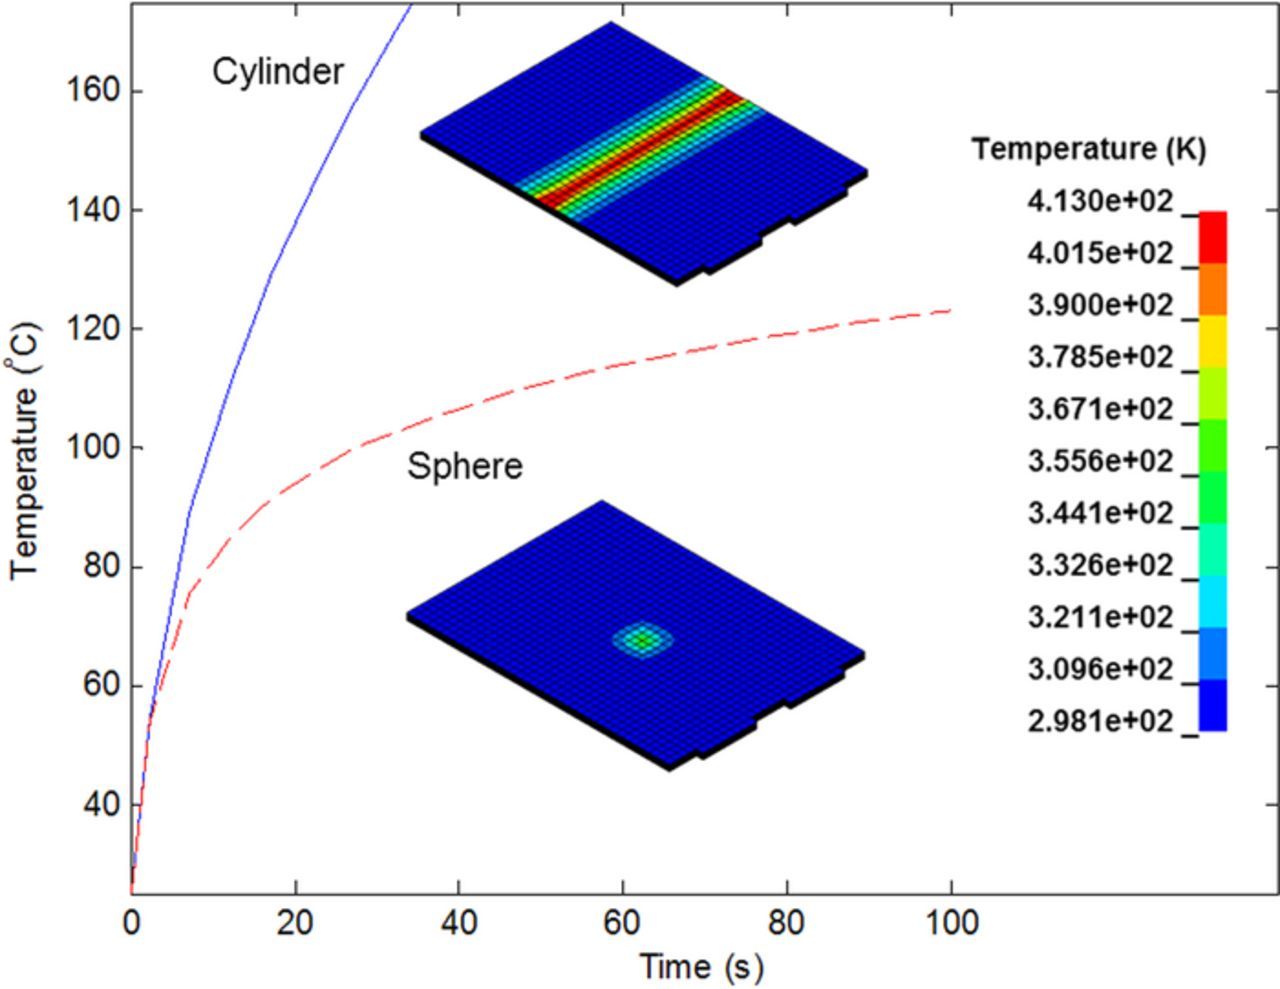
Figure 12. Time series data for maximum element temperature and temperature fringe plots for the cell at t = 20 s after impact.
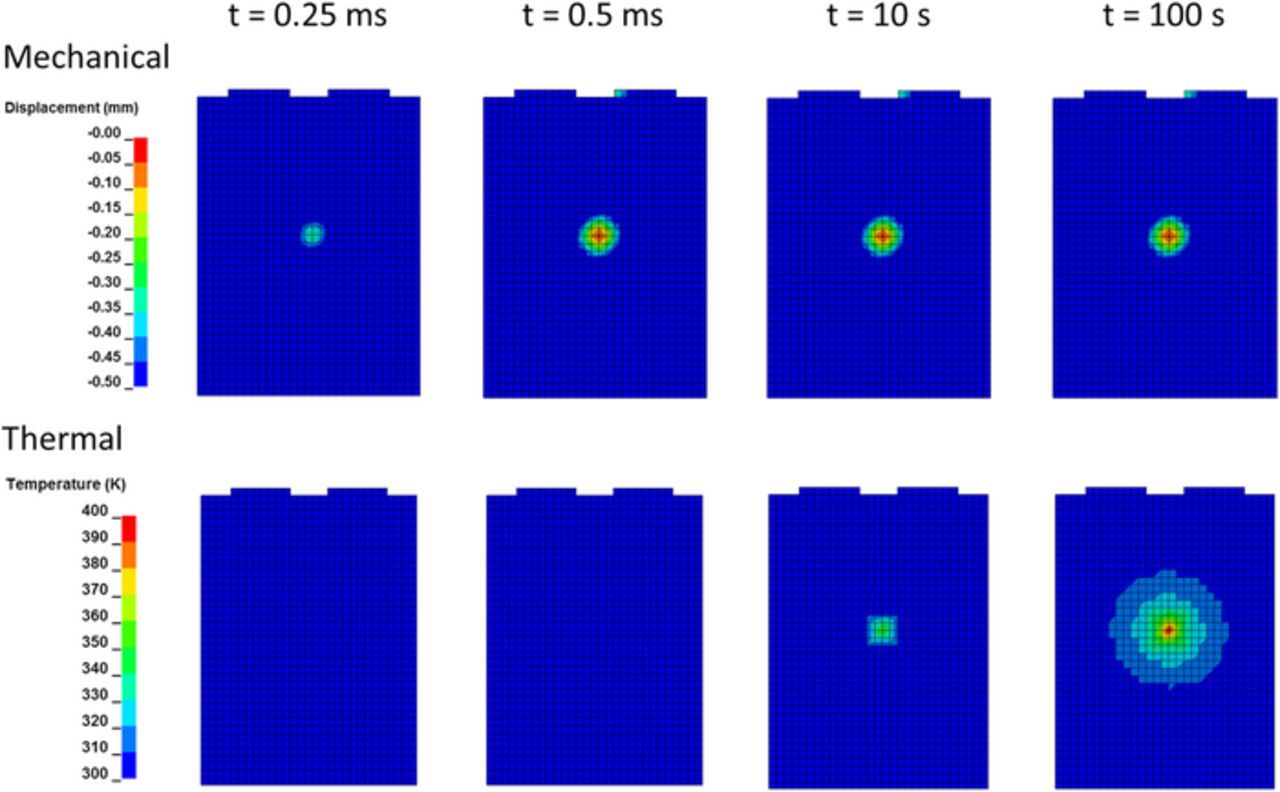
Figure 13. Progression of mechanical and thermal responses to the spherical indenter.
There are several areas of future work that are critical to validating the simulation capability and to move from simulation development toward virtual verification. First, the understanding of the configuration, area, and contact resistance of the internal short circuits that are formed is crucial. This improvement hinges upon both high fidelity mechanical models and experimental methods for creating and measuring internal short circuits that are representative of those that occur during blunt impact loading. The compressive strain criterion is a simple, easily implemented failure criterion that was chosen to demonstrate a method for one-directional coupling for this study, but experimental studies suggest the mechanics responsible for forming an internal short circuit are more complex. The simulation format used in this paper is easily extendable to short circuits defined by other means, such as element deletion due to tensile or compressive failure, and further combined modeling and experiments will be required to select a robust set of failure criteria. Though an assumed constant value for short circuit contact resistance was used in this work, the simulation can accept a tabular function of contact resistance versus contact pressure which could also be used to parameterize the resistance values. Second, a more detailed investigation into the element formulations and sizes that define the mechanical model is warranted, to maintain accuracy while reducing computation time. As previously mentioned, thick shell elements with strain reduced integration are deemed a reasonable first choice, as they are recommended for applications featuring a high aspect ratio and coarse through-thickness discretization. To confirm this element formulation choice, full cell testing will be performed with measurement of the indenter contact force and displacement during a variety of mechanical loading conditions. The elements used in the presented simulation exhibit aspect ratios as high as 250. These poor aspect ratios lead to hourglass modes at higher degrees of crush, so further reduction of the mesh size in the indenter contact zone may also prove useful for increasing the robustness of the simulation. However, increasing the number of elements will increase the computational cost per time step. Therefore, methods for creating transition meshes which employ elements with moderate aspect ratios in areas that experience intrusion and high aspect ratios further away from the indenter are needed to balance robustness with computational time. Given the relatively modest computation time of the presented model, a finer mesh could be used and still be tractable. These aspects will be explored in future work as the simulation tool is validated with experimental data for impact scenarios.
Conclusions
A transient, finite element simulation framework for the mechanical deformation of Li-ion cells leading to internal short circuit that leverages LS-DYNA software has been presented. The model is parameterized using benign experiments at the cell and component level. Parametric analyses have demonstrated that both the rapid mechanical response and slower electrochemical and thermal consequences are captured in a single, computationally efficient simulation using a combination of explicit and implicit time integration with variable time step size. In particular, the ability to predict the thermal response of the cell as its stored energy is completely discharged through the short circuit enables an engineering safety assessment based on whether local temperatures exceed the onset temperature for thermal runaway, as determined by material calorimetry data or other means. Future work will focus on the identification of representative failure criteria which dictate the onset and magnitude of short circuits, the validation of these generalized failure criteria for a variety of mechanical loading conditions, and robustness and scaling improvements to enable simulation of large-scale hardware.
Acknowledgments
The authors gratefully acknowledge financial support from the Department of Energy Office of Energy Efficiency and Renewable Energy and United States Army TARDEC via contract DE-EE0007288. Prior to initiating the contract, the authors thank Livermore Software Technology Corporation and Ford Motor Company for financial support. The authors also thank Srdjan Simunovic, Abhishek Kumar, Sergiy Kalnauss, and Srikanth Allu of Oak Ridge National Laboratory, and James Cheng, Omar Faruque, and Hongyi Xu of Ford for their thoughtful discussions.